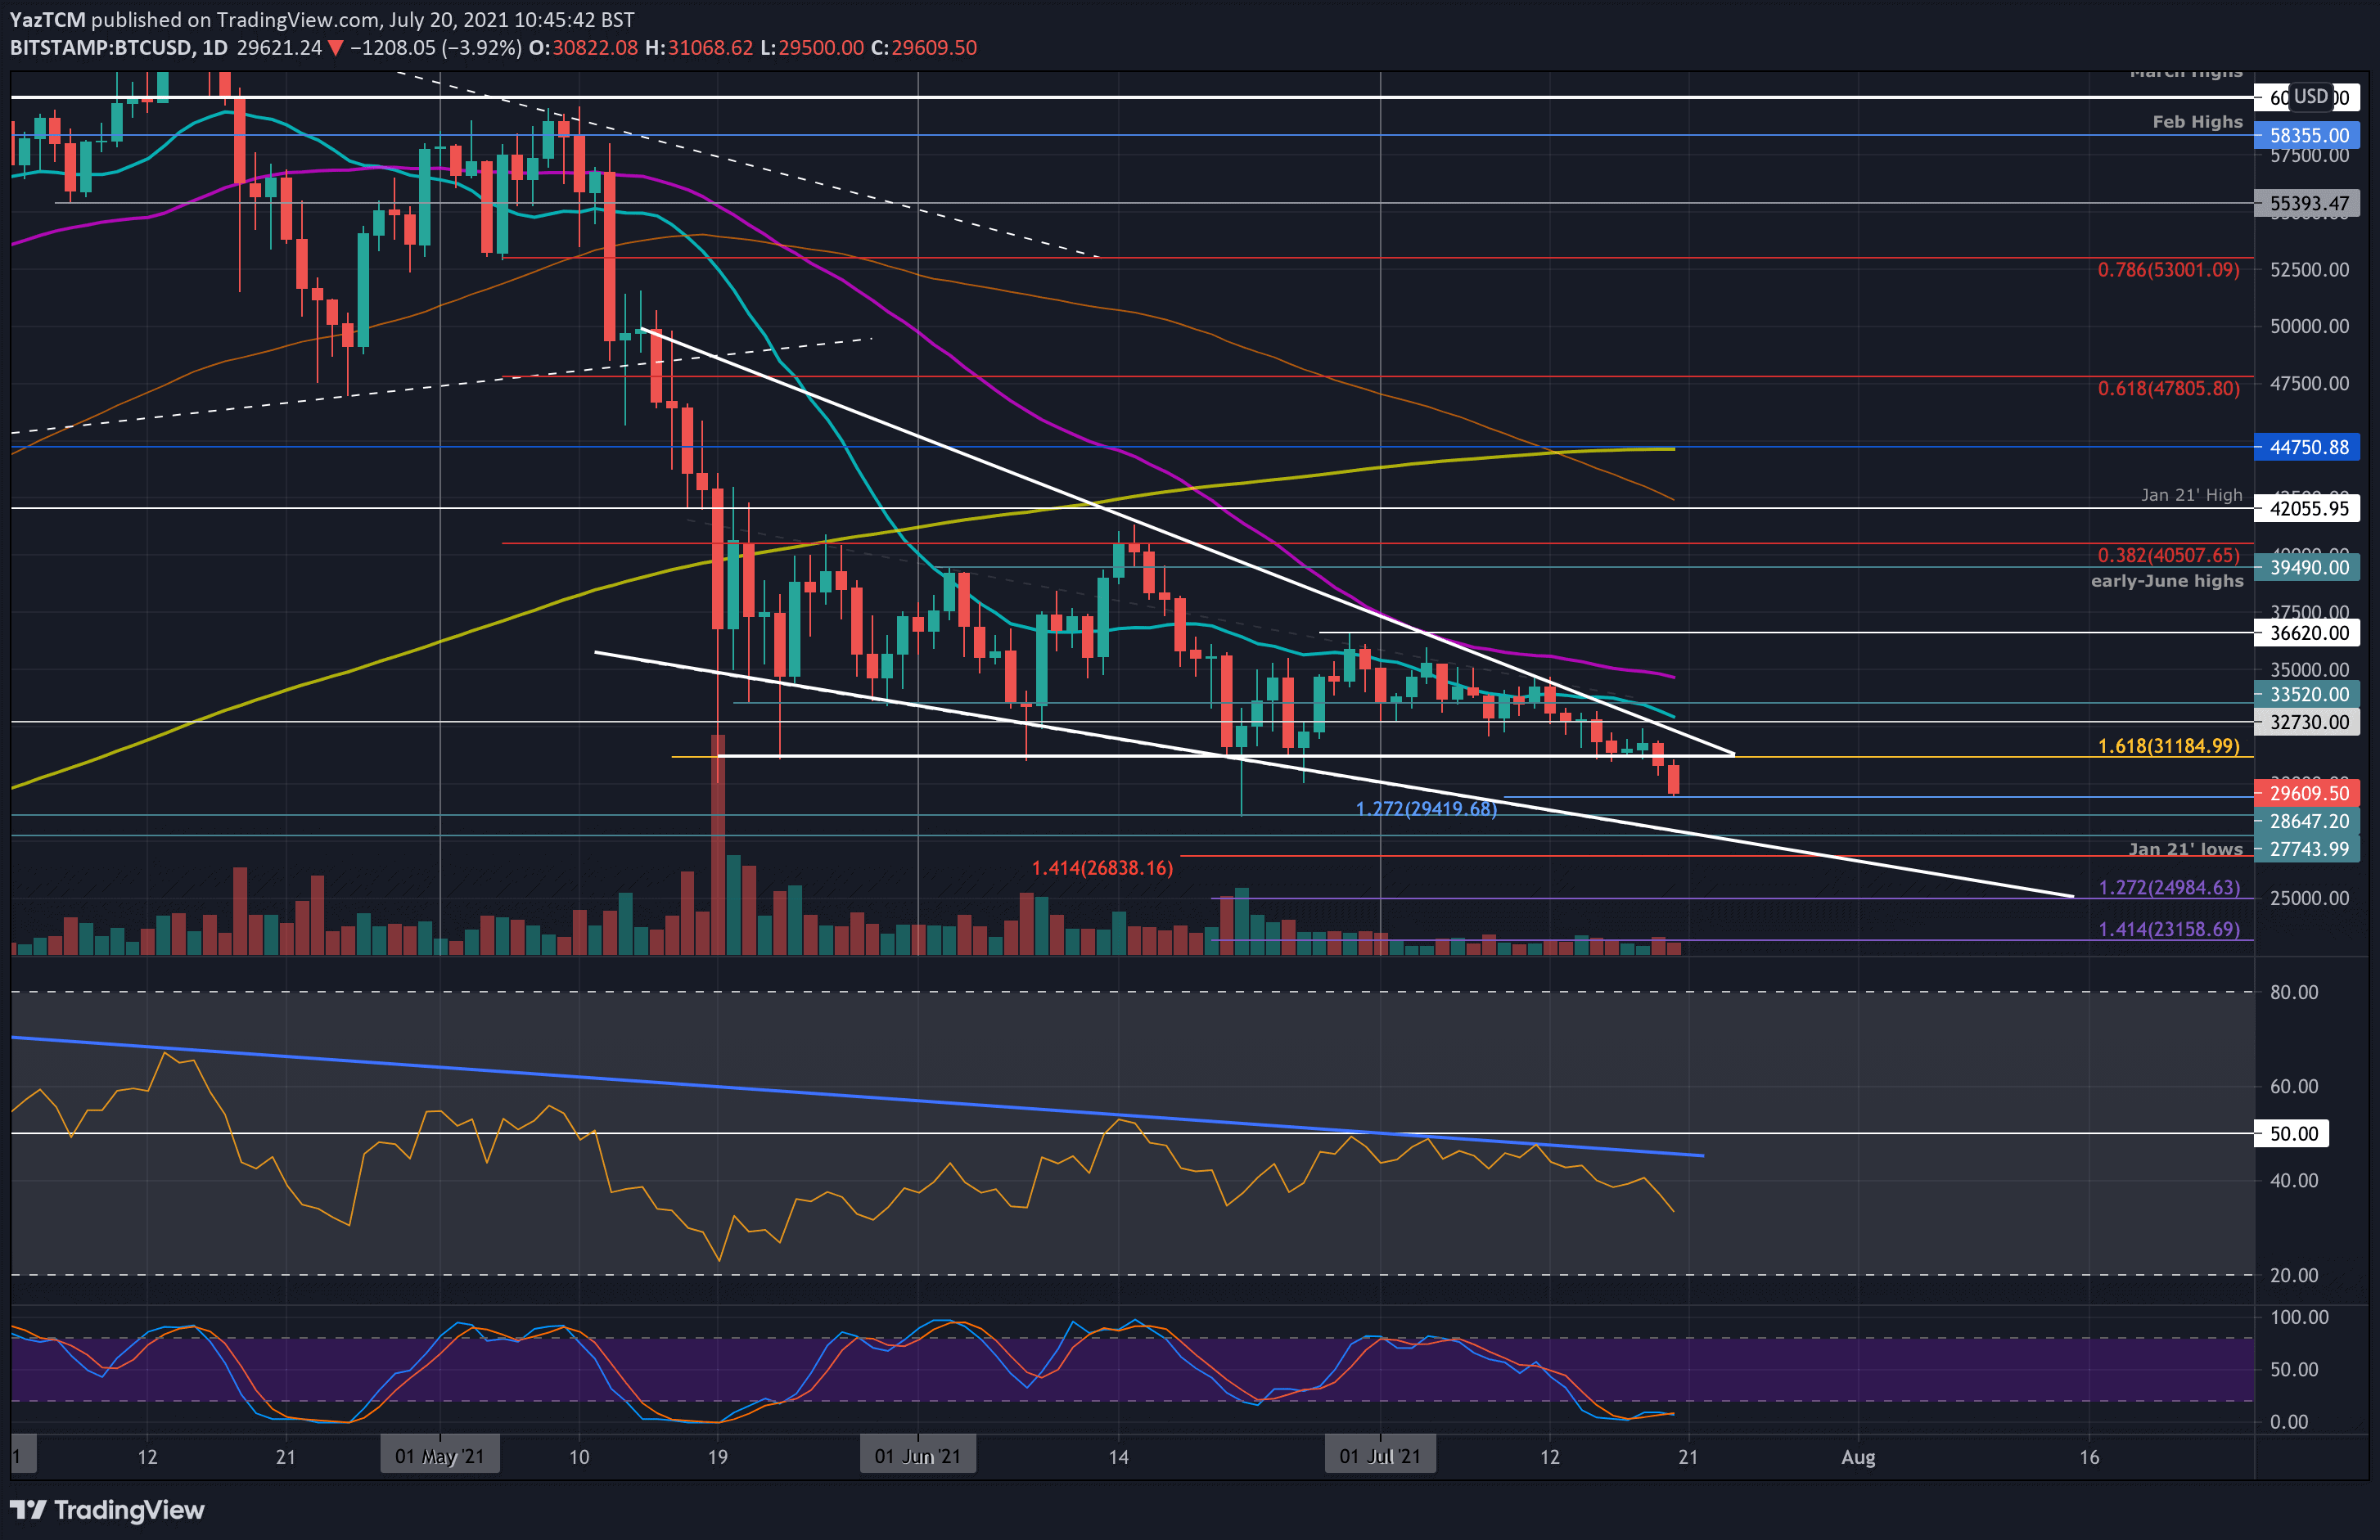
BTC/USD Daily Chart. Source: TradingView.
After weeks of consolidation, which were followed by a declining interest and trading volume, BTC finally broke out of the $30-42K trading range. Earlier today, the primary cryptocurrency dropped below the $30K level.
Before the breakdown, BTC’s price was trading inside a bearish triangle pattern, with the floor of the triangle at around $31,100. It was approaching the apex e where a breakout is typically expected, and yesterday the coin dropped and broke below the triangle and set its lowest daily candle close since January 2021.
The bearishness continued, after Bitcoin broke below the $30K mark as well. The last time this happened, on June 22, the bitcoin price was able to reclaim the $30K mark and close above $31K. This time, however, things might be different.
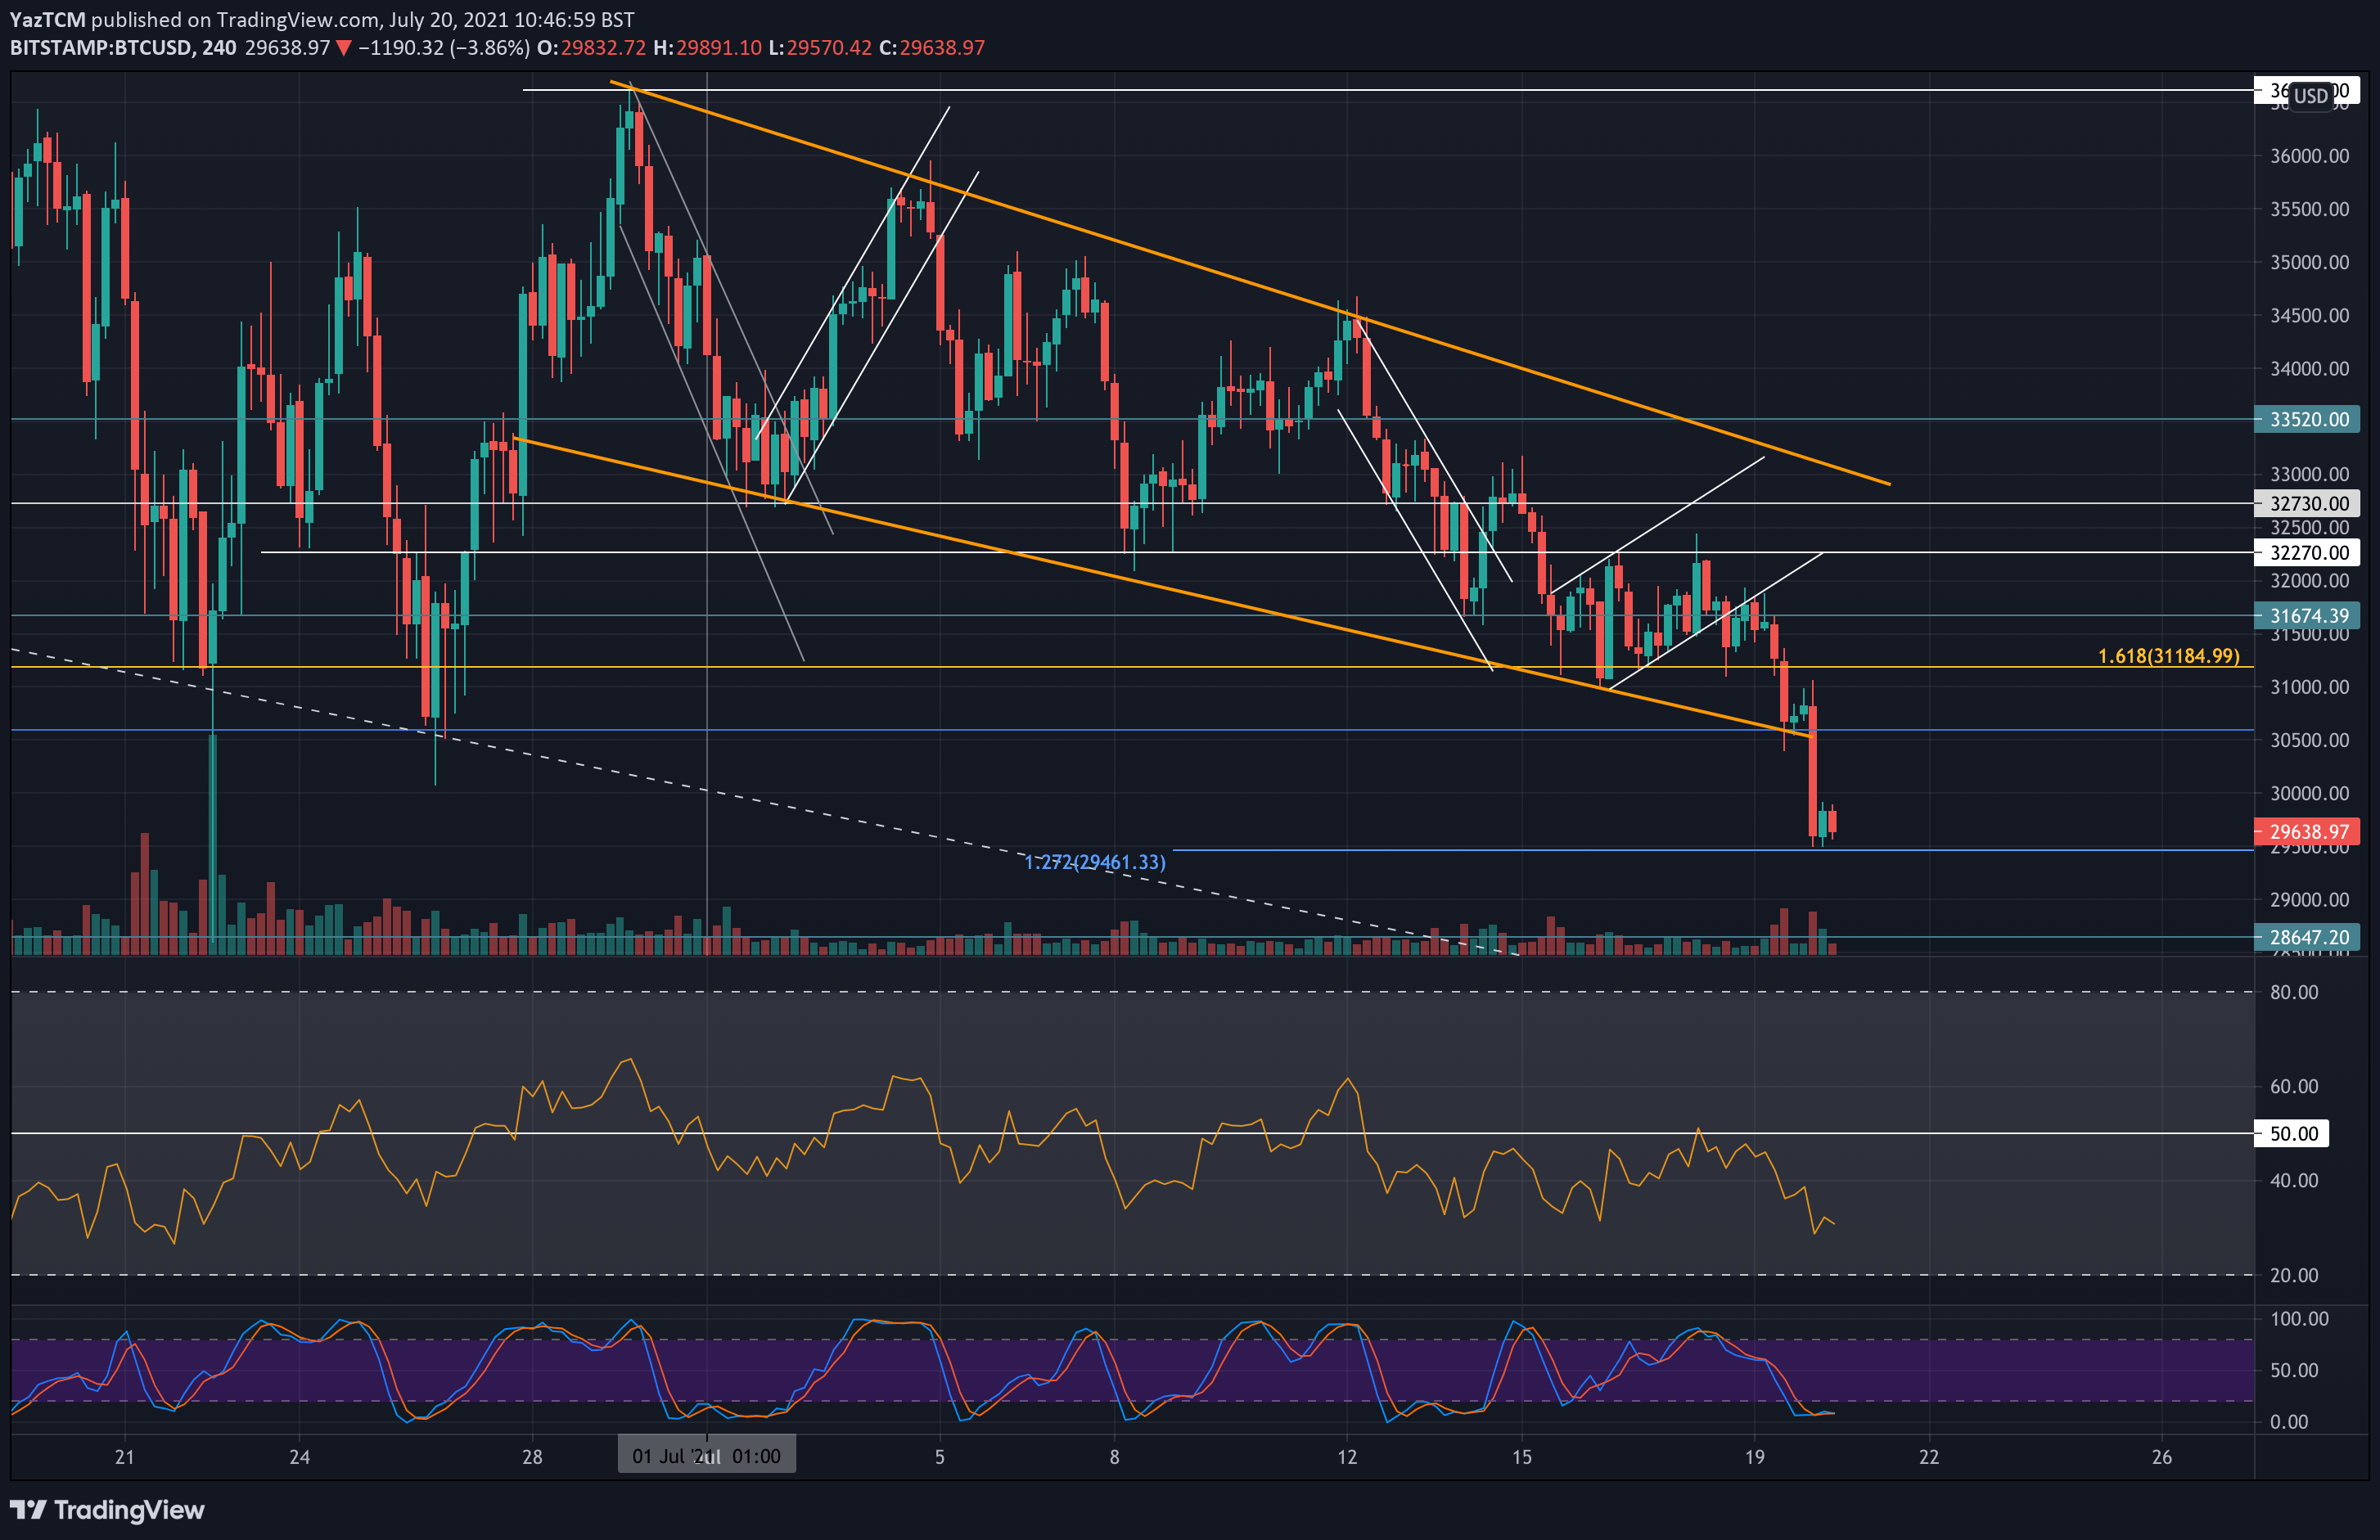
The breakdown beneath $30K also caused BTC to fall below the descending price channel it was trading within since the start of July on the following 4-hour chart.
Bitcoin remains inside a descending wedge formation on the bigger timeframe, as shown on the daily chart below. Beneath June’s low ($28.6K), the confluence of the lower angle of the wedge and the January 2021 lows at $27,750 would be the next critical support to look out for.
Key Support Levels: $29K, $28,650, $27,750, $26,800, $25,000.
Key Resistance Levels: $30,000, $31,100, $32,270, $33,520.
Moving forward, if today’s low (~$29-29.3K) breaks, the first support is expected at $28,600 (June lows). This is followed by critical support around $27,750, provided by the lower angle of the descending wedge and the January 2021 lows.
Beneath the wedge, additional support lies at $26,800 (downside 1.414 Fib Extension – red), and $25,000 psychological level.
On the other side, the first resistance lies at $30K. This is followed by $31,100 (previous triangle base and support turned resistance), $32,270 (20-day MA), $33,520, and $34,700 (50-day MA).
The daily RSI, which is the momentum indicator, is now showing the most bearish momentum since June. Stochastic RSI is around oversold levels, which might open an opportunity for a temp correction. In conclusion, the momentum is bearish on the daily timeframe.