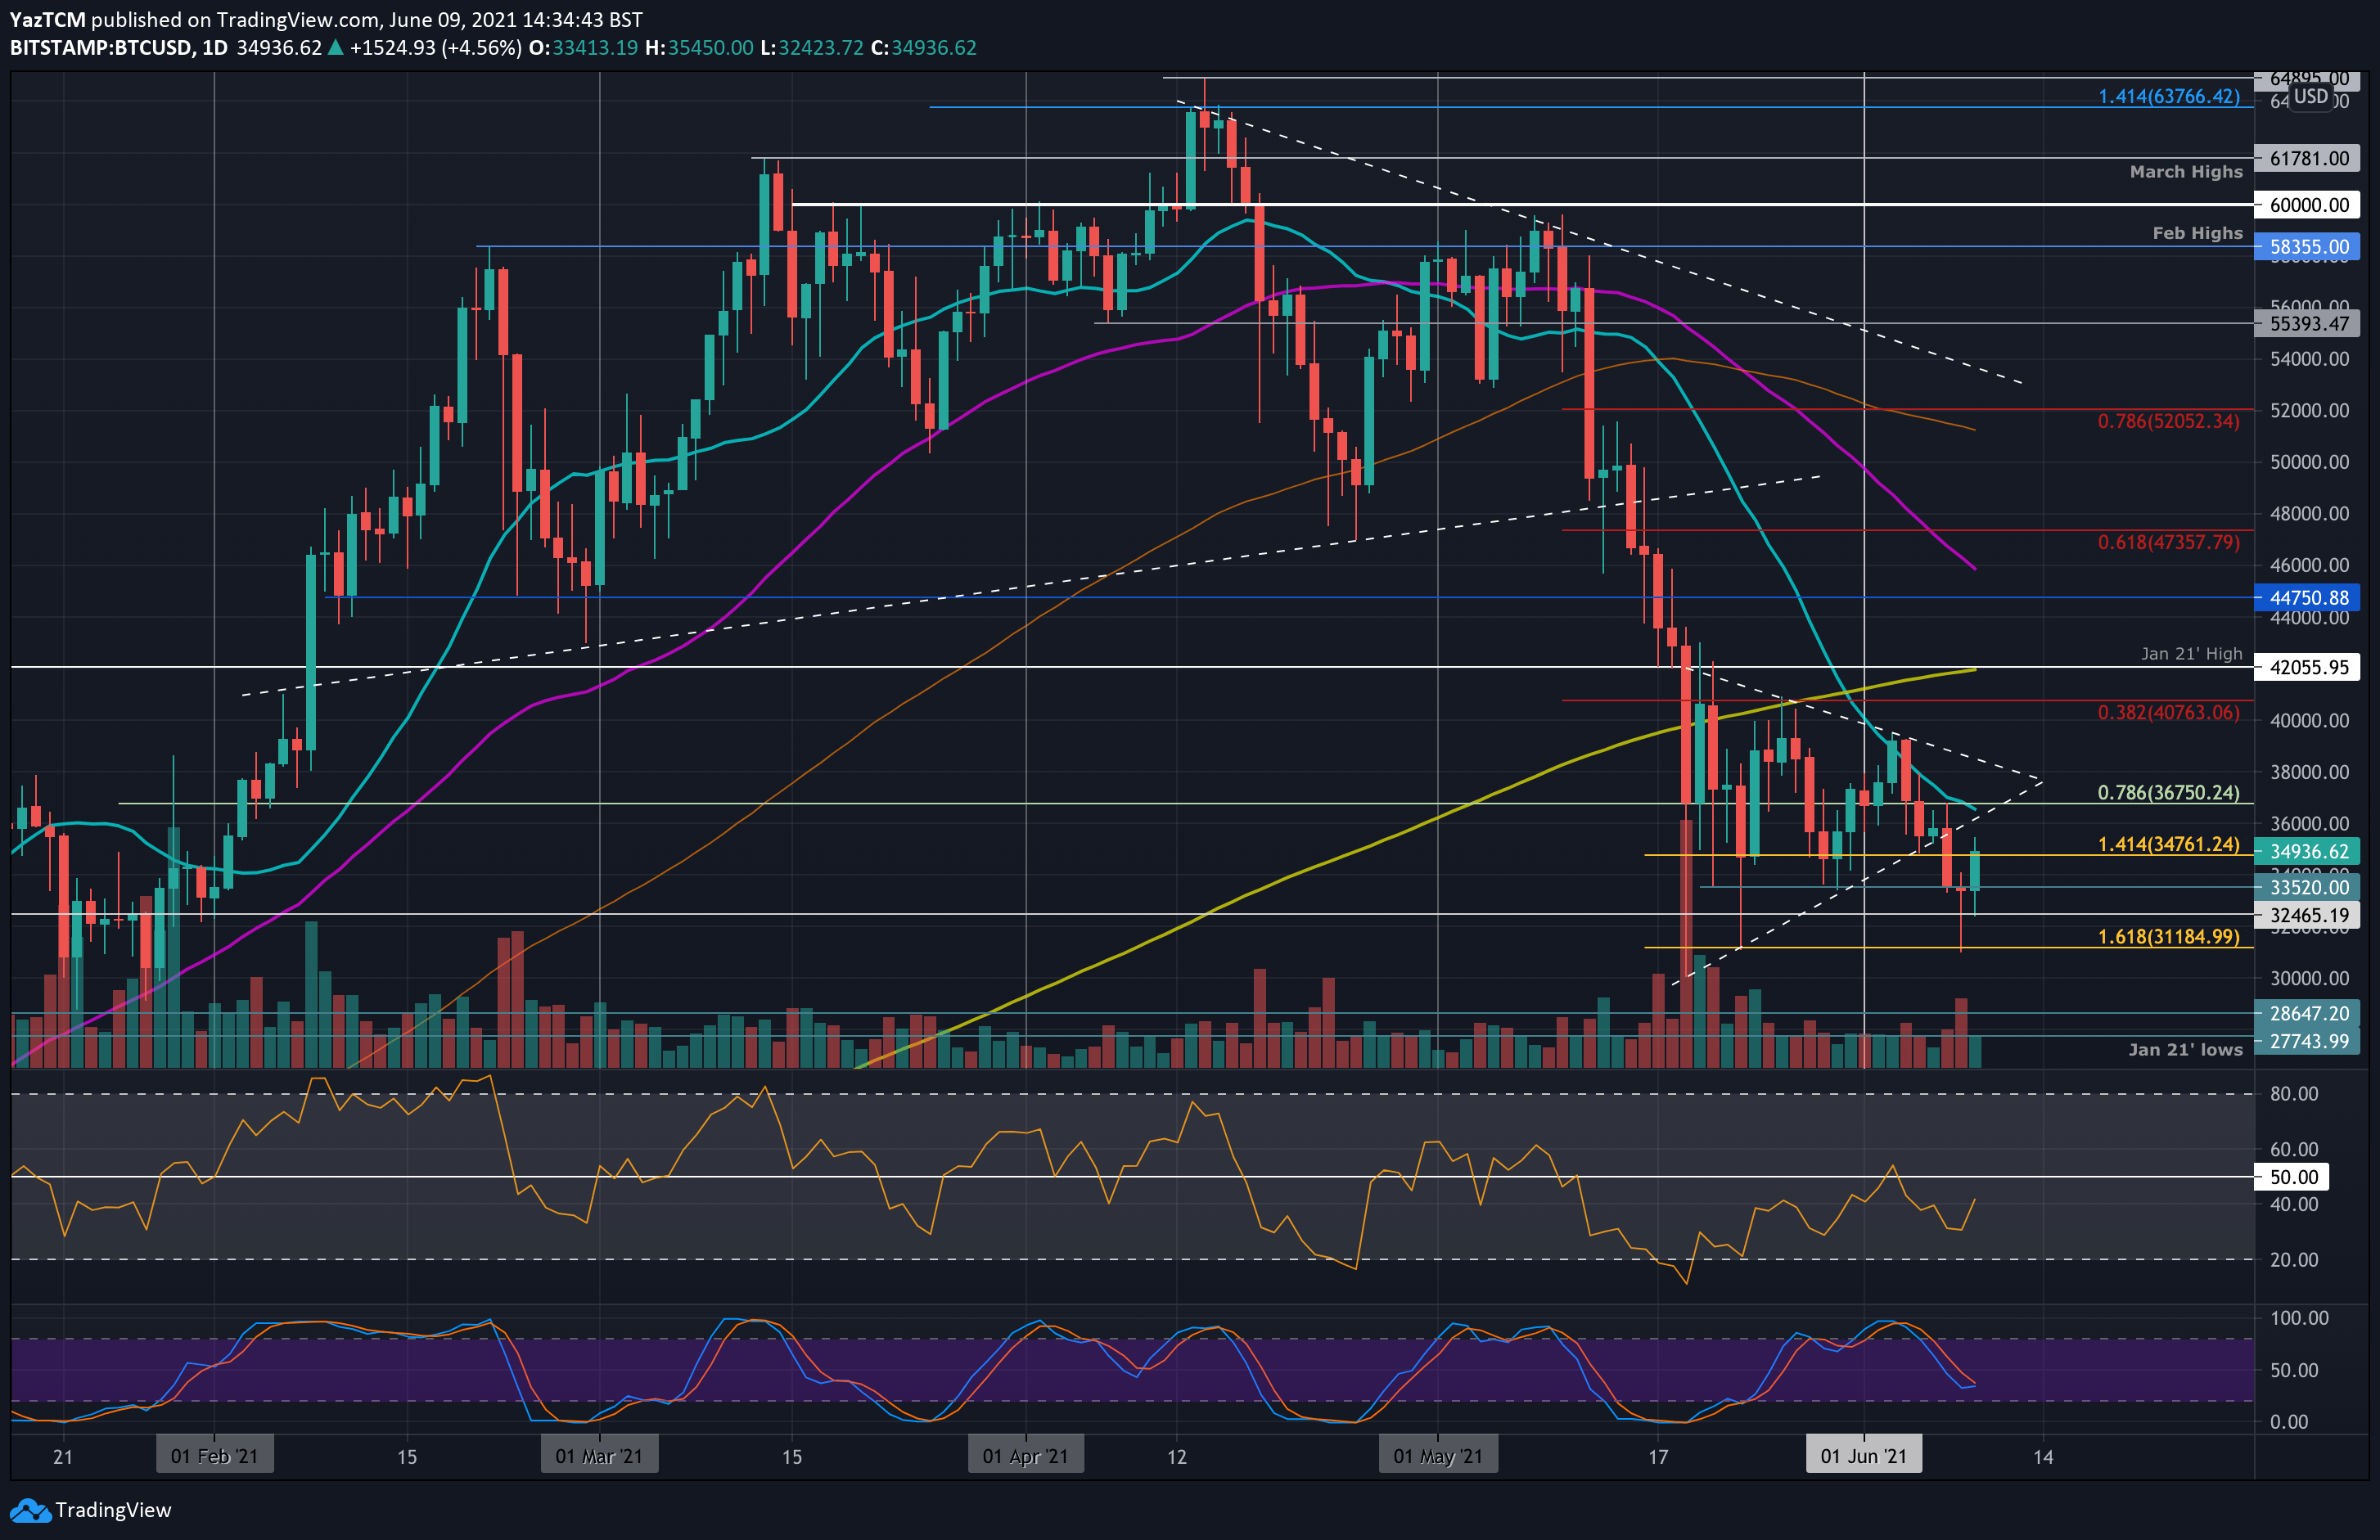
BTC/USD Daily Chart. Source: TradingView.
Bitcoin is up by 12% from yesterday’s low of $31,000, according to Bitstamp, and is currently battling to climb above a descending trend line that spans the first week of June.
The primary cryptocurrency saw a turbulent week after breaking beneath the previous symmetrical triangle pattern on Monday. BTC kept sliding following the bearish breakout as it even broke the late-May support at $33,500 and continued lower yesterday to hit the low at $31,000, which was the lowest price for BTC since May 19 crash.
However, the rebound was rapid, as bitcoin found a temp bottom at $31,000 – the same level at which it rebounded on May 23. In conclusion, after another very volatile they, the market eventually closed yesterday’s candle at the same price it opened, at around $34,000.
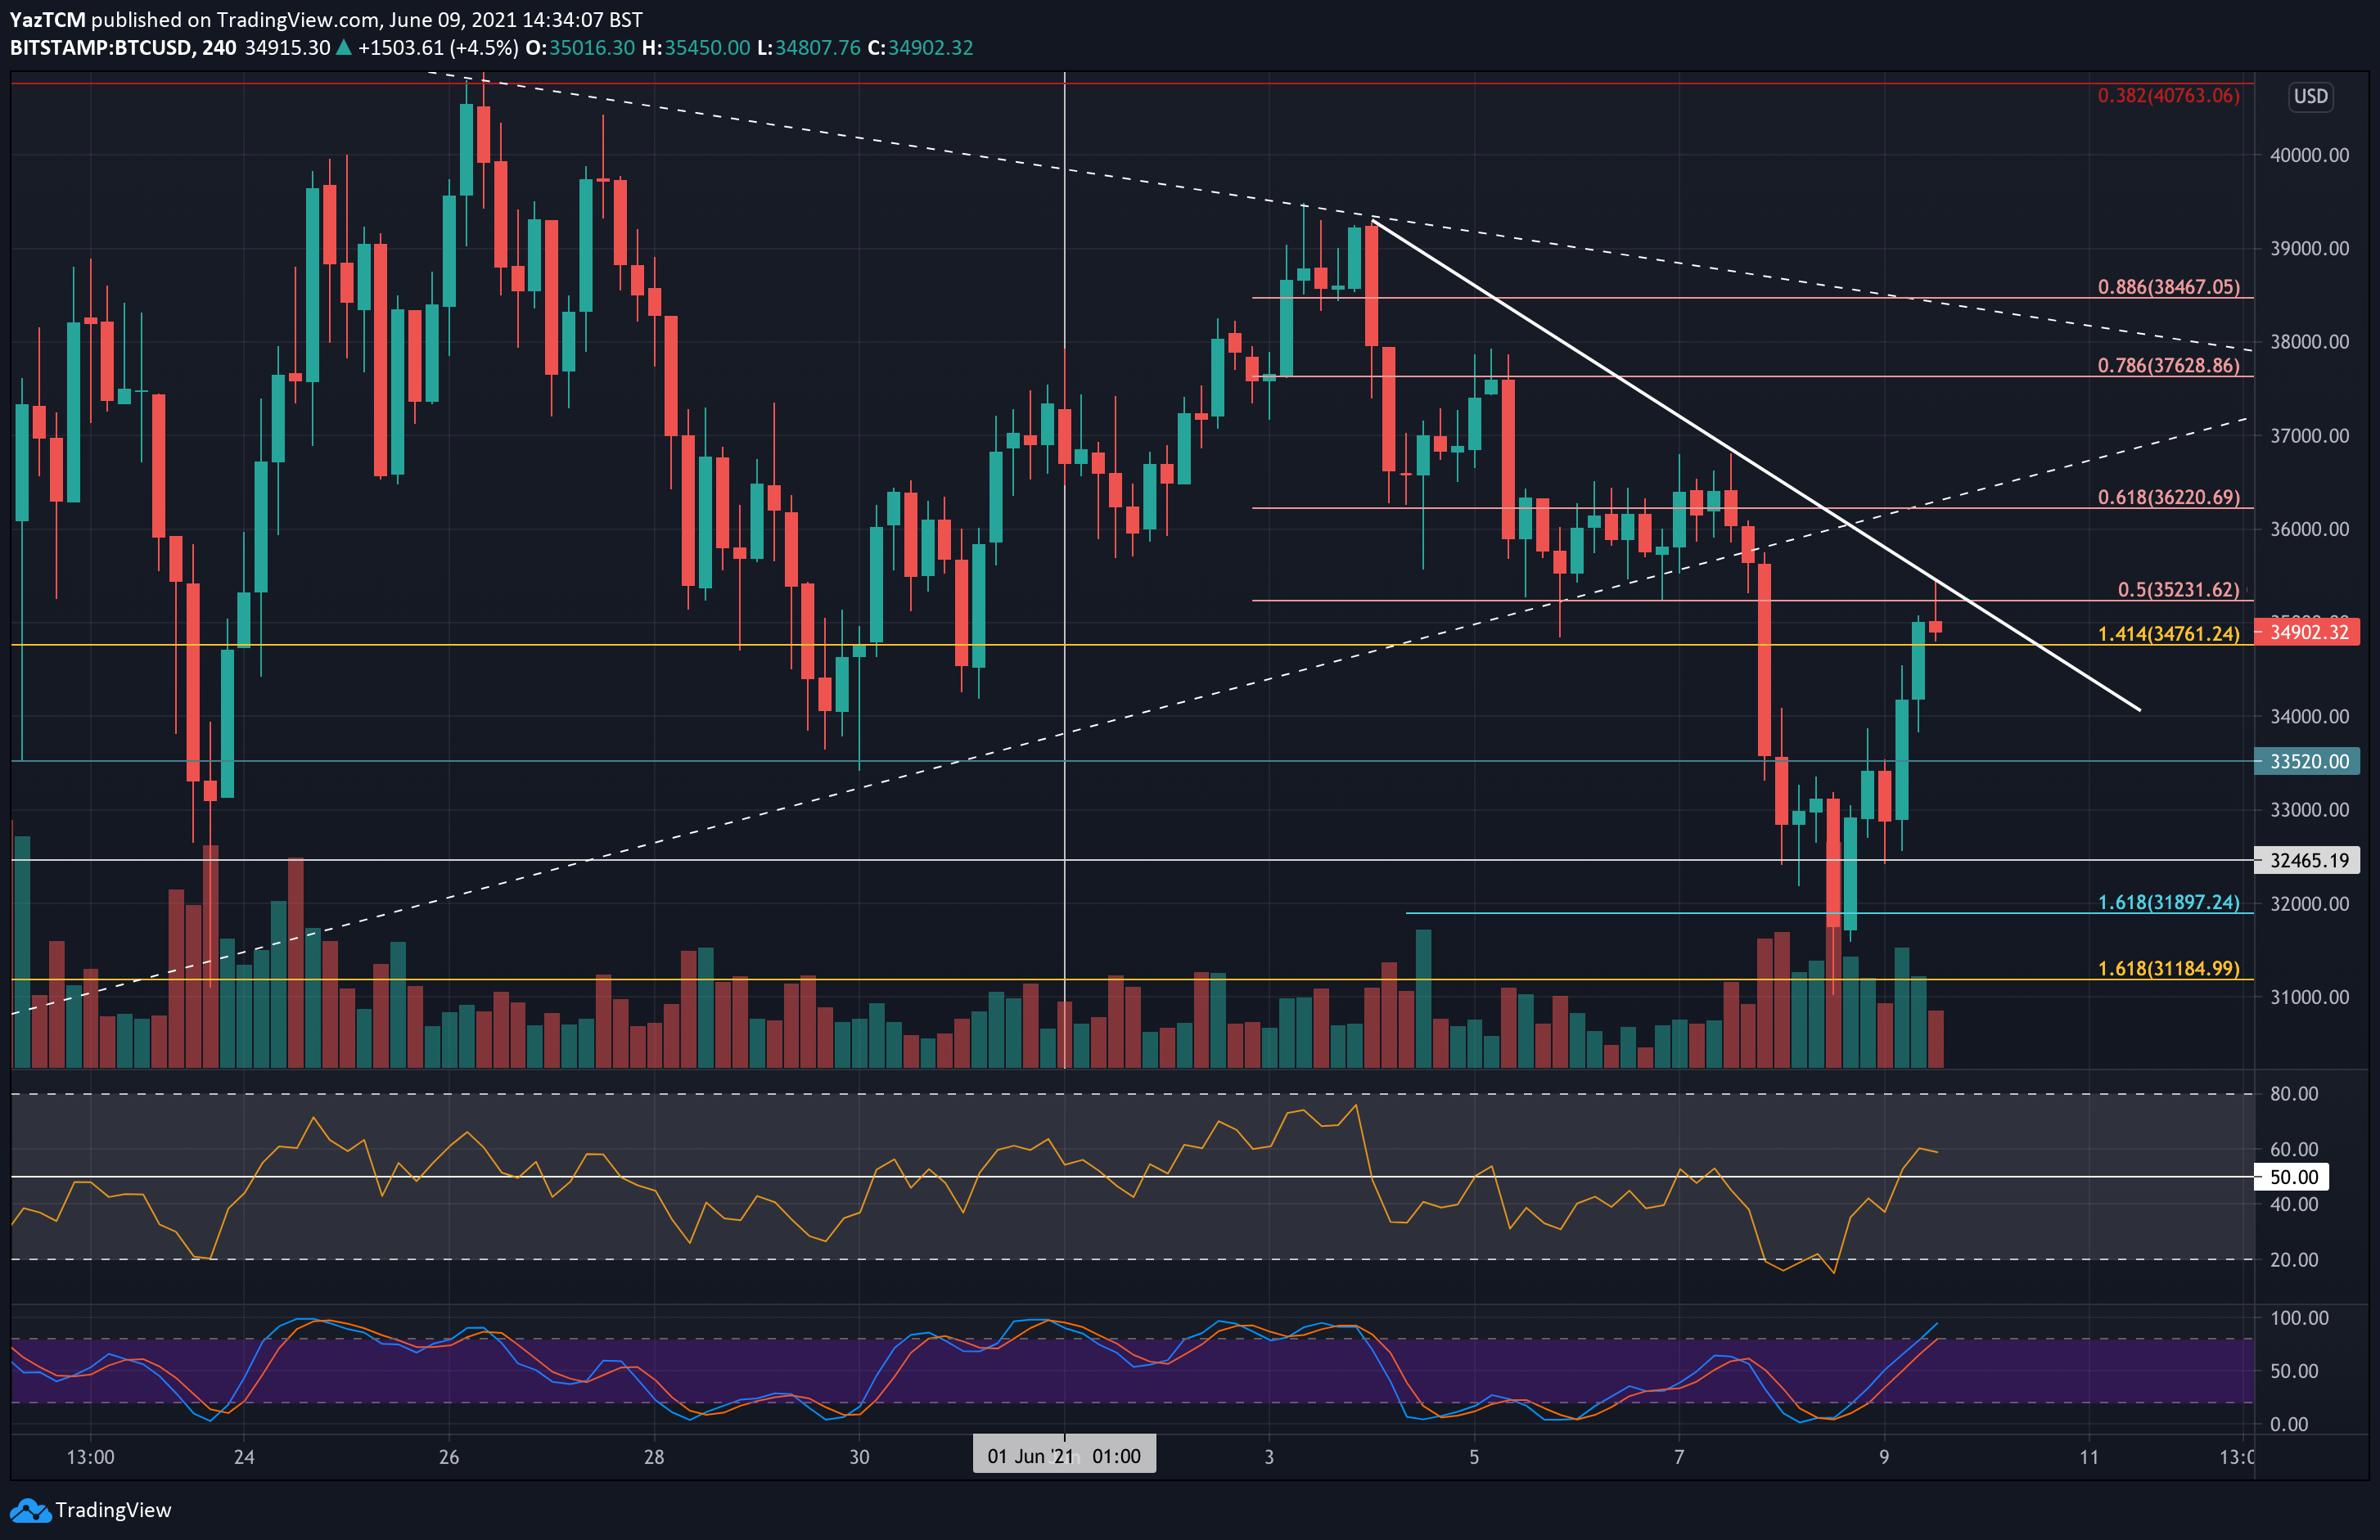
Today, BTC continued to push higher above $34,000 and managed to get to $35,450 before running into a descending trend line that started from the early-June highs. A bearish .5 Fib further bolsters the resistance at $35,230, measured from the June high to low.
Optimistically, if today’s candle can close beyond $35,000, the market would form a morning star candlestick pattern, which is a bullish reversal pattern formed over the last three days of trading.
Key Support Levels: $34,760, $34,000, $33,520, $33,000, $32,465.
Key Resistance Levels: $35,230, $36,220, $36,750, $37,630, $38,570.
Looking ahead, the first resistance lies around $35,230 (bearish .5 Fib & descending trend line). This is followed by $36,220 (bearish .618 Fib), $36,750 (20-day moving average line), $37,630 (bearish .786 Fib), and $38,570 (bearish .886 Fib).
On the other side, the first major support is expected at $34,760. This is followed by $34,000 (late-May horizontal support), $33,520, $33,000, and $32,465. Further down lies yesterday’s low at $31K.
The daily RSI remains in the bear’s favor. However, it is starting to regain momentum, which indicates that the short-term bearish momentum is fading again. Yet, it would need to push beyond the midline and break the early-June spike above 50 to indicate any sustainable bullish momentum.
The RSI has finally spiked above the midline on the short-term chart, indicating short-term bullish momentum is showing up again. It would need to rise beyond 60 for this bullish momentum to be sustained.