After two more days of consolidation, Bitcoin finally made a slight move: the last two 4-hour candles were neat and green and brought the coin back above the $3400 resistance level.
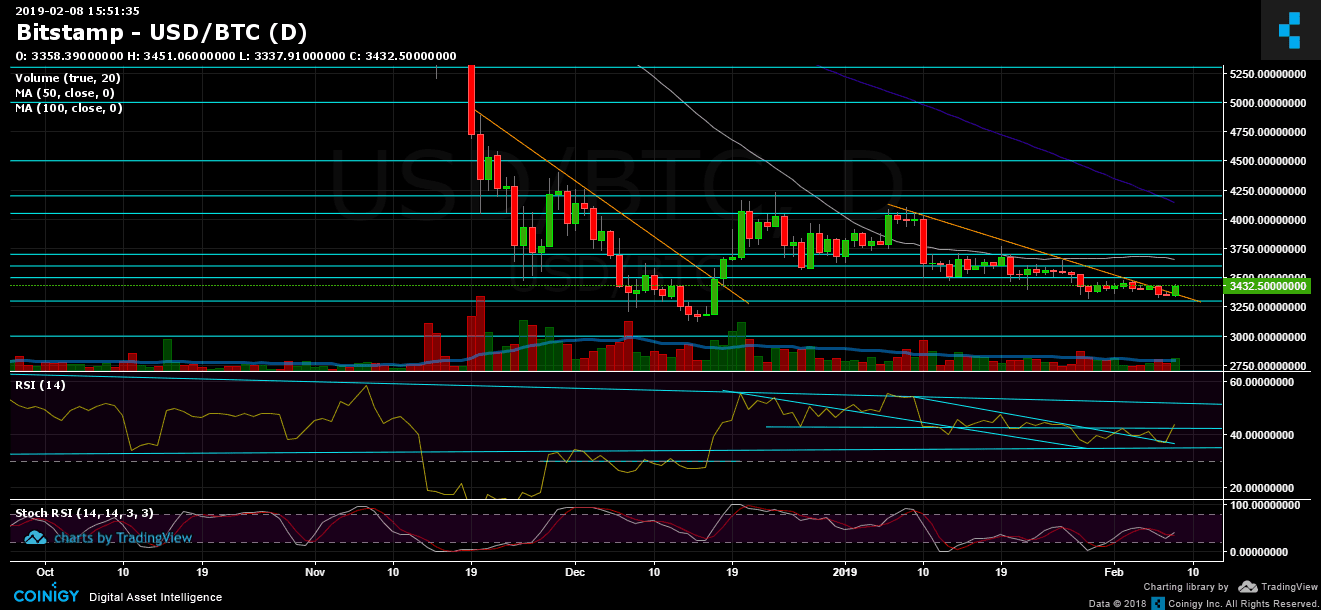
Looking at the daily chart as of now, the descending trend-line got broken up. However, there is still time until the daily candle closes.
In case the daily candle confirms a breakout, followed by a decent amount of green volume, it could be a very positive sign for Bitcoin’s short-term.
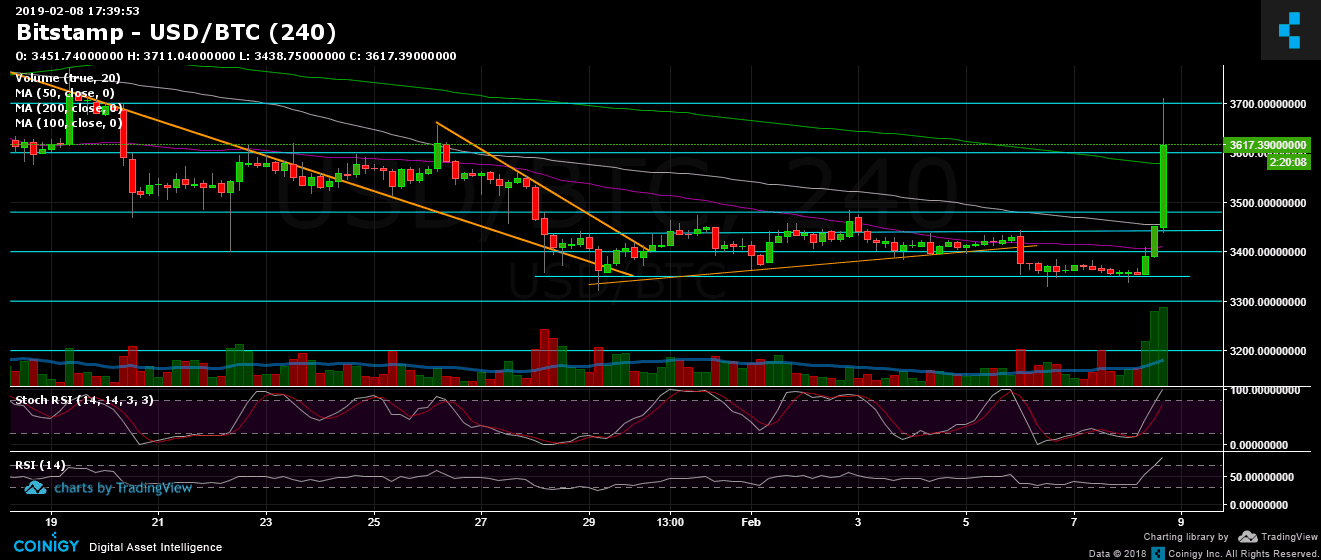
UPDATE 17:30 UTC: Since we published the price analysis, Bitcoin had gained another $200-$250 to confirm this breakout of the mid-term descending trend-line. The volume looks decent, let’s wait for this daily candle to end. The following is an updated 4-hour chart:
As of writing this, Bitcoin had touched the $3650 – $3700 resistance, along with the 1-day 50-days MA. To my opinion, this should be a major resistance area.
Looking at the 1-day & 4-hour charts
- The daily chart’s RSI: RSI is currently facing a resistance trend-line, as of writing this update. To continue bullish, Bitcoin’s RSI has to overcome the 43-44 level.
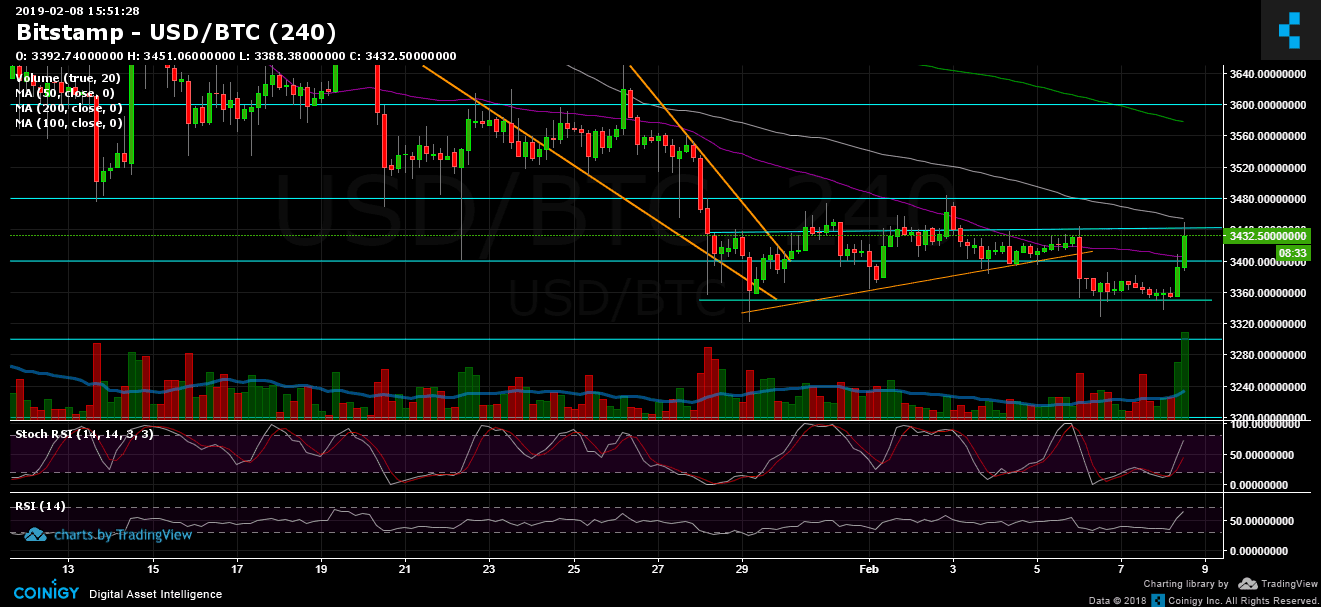
- Support and resistance areas: after breaking up $3400, along with the 4-hour 50 days moving average line, the level has turned into being support for the short-term. The next support lies around $3350 – $3360, before reaching down to test the $3300. Below are the $3200 support and 2018 lowest price of $3120.
- From above: $3440 – $3450 is the next resistance level (the 4-hour 100 days moving average line, marked in white). The next major resistance area is the $3480 – $3500 zone, including the 100 days moving average line (marked in white). Further lies $3600 and $3650 – $3700 (along with the daily chart’s 50 days moving average line, marked in white).
To start thinking bullish for the mid-term, Bitcoin has to return above the critical 50 days moving average line of the daily chart, which is hovering around $3650.
- The trading volume has risen, and has the potential to turn into a reversal day for the short-term. Let’s see what the next hours will lead.
- BitFinex’s open short positions increased to 27K BTC of open positions.
BTC/USD BitStamp 4-Hour chart
BTC/USD BitStamp 1-Day chart
SPECIAL OFFER (Sponsored)
LIMITED OFFER 2024 for CryptoPotato readers at Bybit: Use this link to register and open a $500 BTC-USDT position on Bybit Exchange for free!
Disclaimer: Information found on CryptoPotato is those of writers quoted. It does not represent the opinions of CryptoPotato on whether to buy, sell, or hold any investments. You are advised to conduct your own research before making any investment decisions. Use provided information at your own risk. See Disclaimer for more information.
Cryptocurrency charts by TradingView.