Since our previous price analysis, whereas the market was hovering around the $3600 mark, Bitcoin had been moving sideways with not much price action.
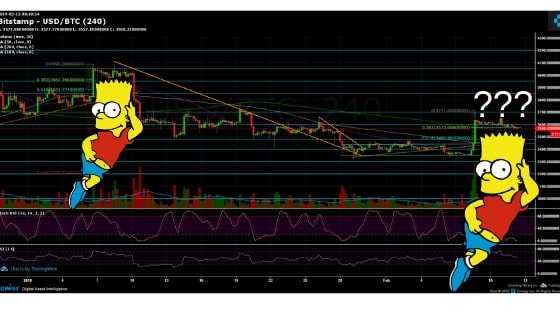
However, this set-up reminds me of Bart’s head pattern from January 6th:
In both cases, Bitcoin raised around 10%, in both cases the consolidation was around the 38.2% Fibonacci retracement level. Looking at the January set-up, it lasted for about four days before completing Bart’s right side, declining towards the baseline.
This was just one incident of Bart’s head. Barts are said to be related to price manipulations as the heavy traders are making their profits by longing and then shorting the market.
Remember, there is always the other scenario, so nothing is for granted.
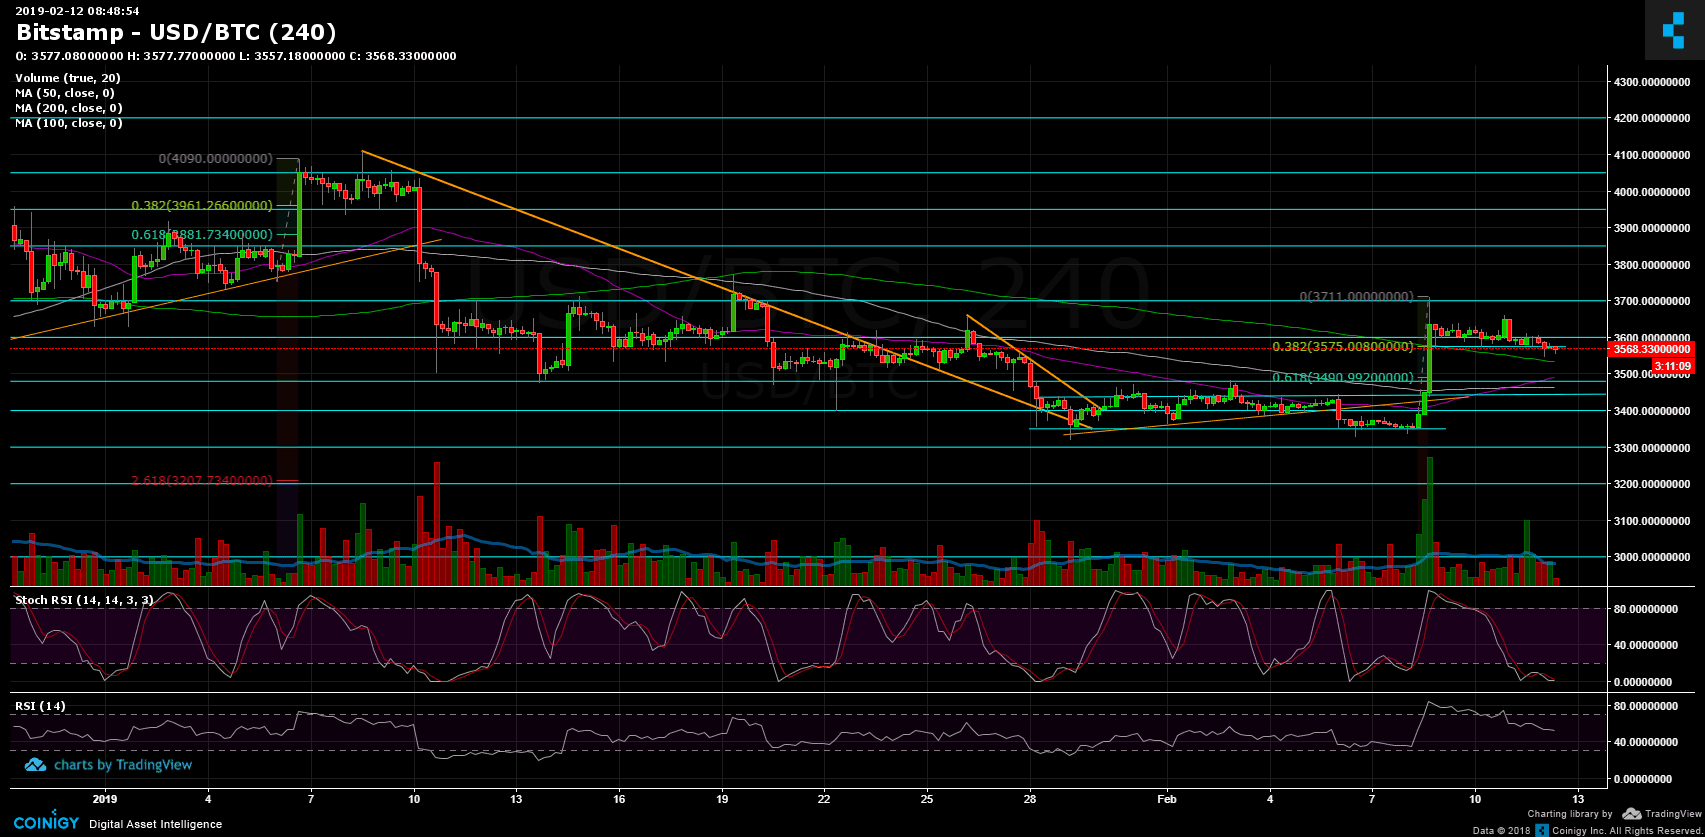
Looking at the 1-day & 4-hour charts
- The daily chart’s RSI: Following RSI reaching the significant resistance level around the 56 line, the RSI had turned around bearish and is currently facing the long-term descending support trend-line. The last time Bitcoin’s RSI was higher than 56 was in November, before Bitcoin broke down the $6K mark
- Support and resistance areas: Bitcoin had failed to break-up the key-level of the 50 days moving average line (on the daily chart, marked in white). This level currently lies around $3620.
Breaking it up could lead BTC to retest higher resistance levels of $3700, $3800 and $3850. However, Bitcoin is now facing down the Fib retracement level at $3575 which supported the price for the past four days. The next support lies around $5530 (200 days moving average line, marked in light green), while the significant support area is the $3480 – $3500 strong resistance turned support zone. Further lies the $3400 level.
- To start thinking bullish for the mid-term, Bitcoin has to return over the critical 50 days moving average line of the daily chart, which is hovering around $3620.
- A high amount of trading volume followed the last rise, but, since then the volume has been decreasing with not much action.
- BitFinex’s open short positions slightly increased to 24.55K BTC of open positions.
BTC/USD BitStamp 4-Hour chart
BTC/USD BitStamp 1-Day chart
SPECIAL OFFER (Sponsored)
LIMITED OFFER 2024 for CryptoPotato readers at Bybit: Use this link to register and open a $500 BTC-USDT position on Bybit Exchange for free!
Disclaimer: Information found on CryptoPotato is those of writers quoted. It does not represent the opinions of CryptoPotato on whether to buy, sell, or hold any investments. You are advised to conduct your own research before making any investment decisions. Use provided information at your own risk. See Disclaimer for more information.
Cryptocurrency charts by TradingView.