

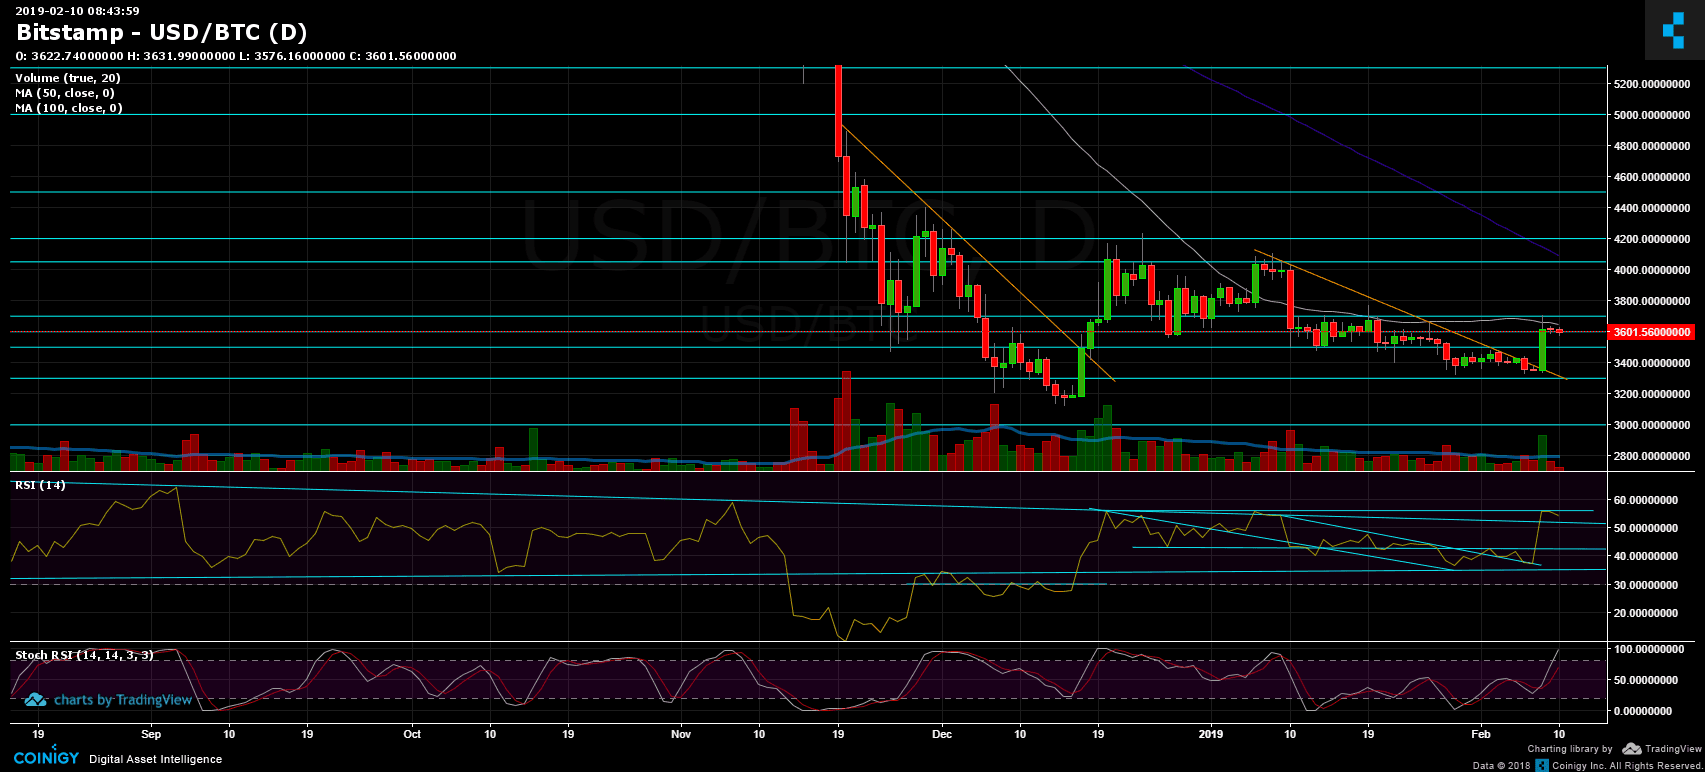
Two days ago, just an hour after publishing our previous analysis, Bitcoin broke up the mid-term descending trend-line (can be seen on the 1-day chart).
In a matter of ten hours, Bitcoin went up from $3355 to a high of $3711 (Bitstamp). As much as a 10% gain.
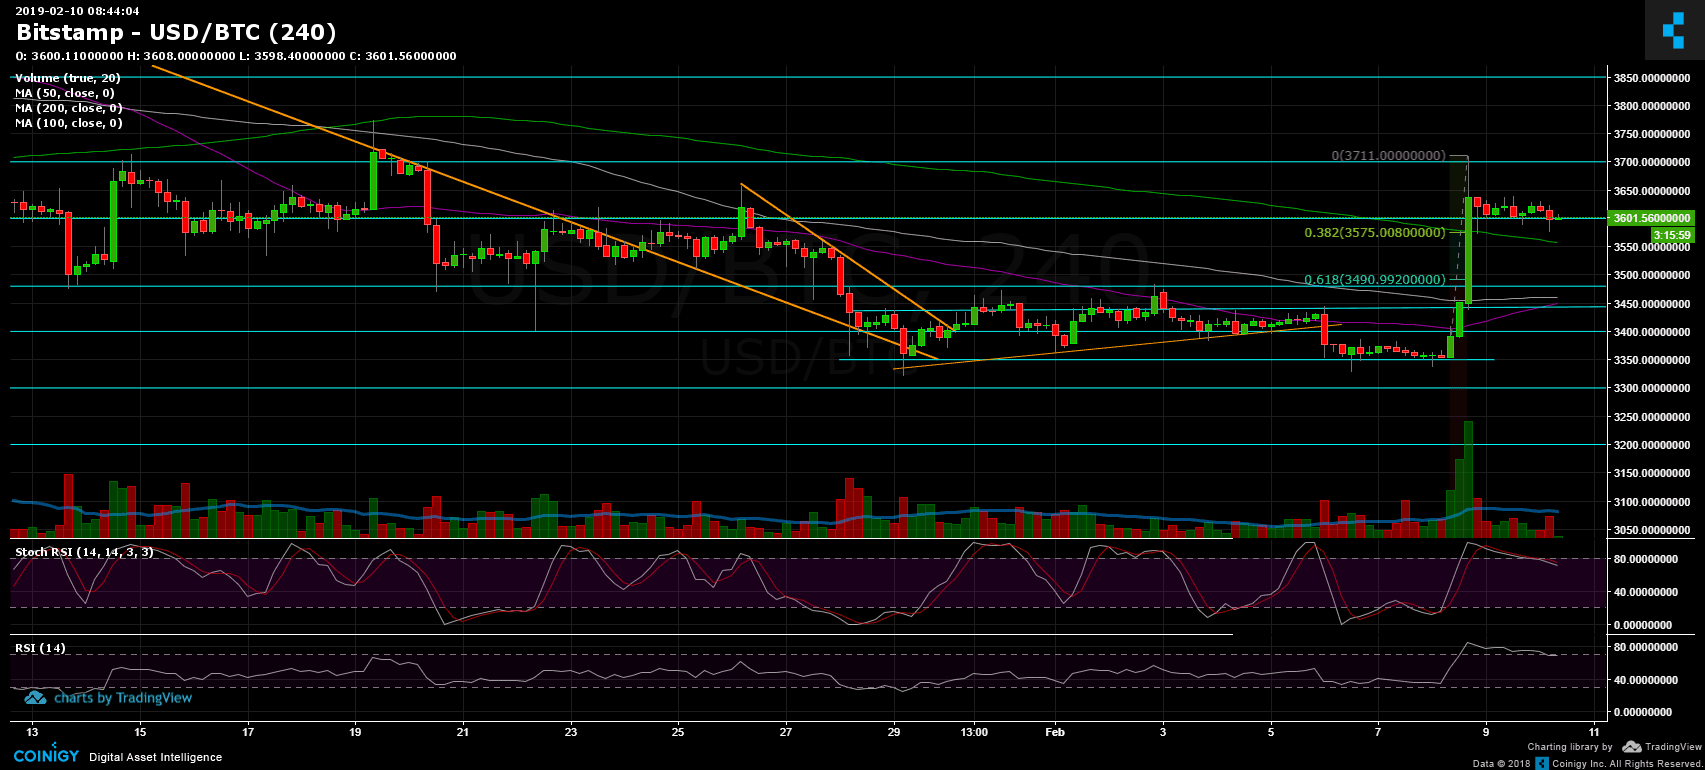
From there and up till now, Bitcoin had been consolidating around the $3600 level, in anticipation for the next big move.
Looking at the 1-day & 4-hour charts
- The daily chart’s RSI: RSI reached a resistance level at the 56 line, following the breakout. The last time the RSI was higher than 56 was at the beginning of November 2018 (when BTC was over $6,000). Breaking above the 56 level could signal a bullish continuation.
- Before we mention the critical levels, to my opinion, this last Bitcoin move can become a deeper correction to the upside (higher targets lie around $3800 and $4000), while there is always a high chance that this move would end up being another Bart’s head pattern going sharply back to the “base” line around $3400 – $3500.
- Support and resistance areas: Bitcoin is now facing the key-level of the 50 days moving average line on the daily chart (marked in white). This level lies around $3650. Breaking it up could lead BTC to retest higher resistance levels of $3700, $3800 and $3850.
- Short-term support can be found at current price range: $3550 – $3600 (along with the 4-hour 200-days moving average line). Further below is the $3480 – $3500 strong resistance turned support area. Further lies the $3400 level.
- Fibonacci retracement levels can be found at $3575 (38.2%) and $3490 (61.8%). The two are possible support levels for a healthy correction.
- A reminder: To start thinking bullish for the mid-term, Bitcoin has to return back over the critical 50 days moving average line of the daily chart, which is hovering around $3650.
- The last rise was followed by a high amount of trading volume. In the following weekend days, the volume is back to normal/low, compared to the past month.
- BitFinex’s open short positions sharply decreased to 23.8K BTC of open positions.
BTC/USD BitStamp 4-Hour chart
BTC/USD BitStamp 1-Day chart
Disclaimer: Information found on CryptoPotato is those of writers quoted. It does not represent the opinions of CryptoPotato on whether to buy, sell, or hold any investments. You are advised to conduct your own research before making any investment decisions. Use provided information at your own risk. See Disclaimer for more information.
Cryptocurrency charts by TradingView.


