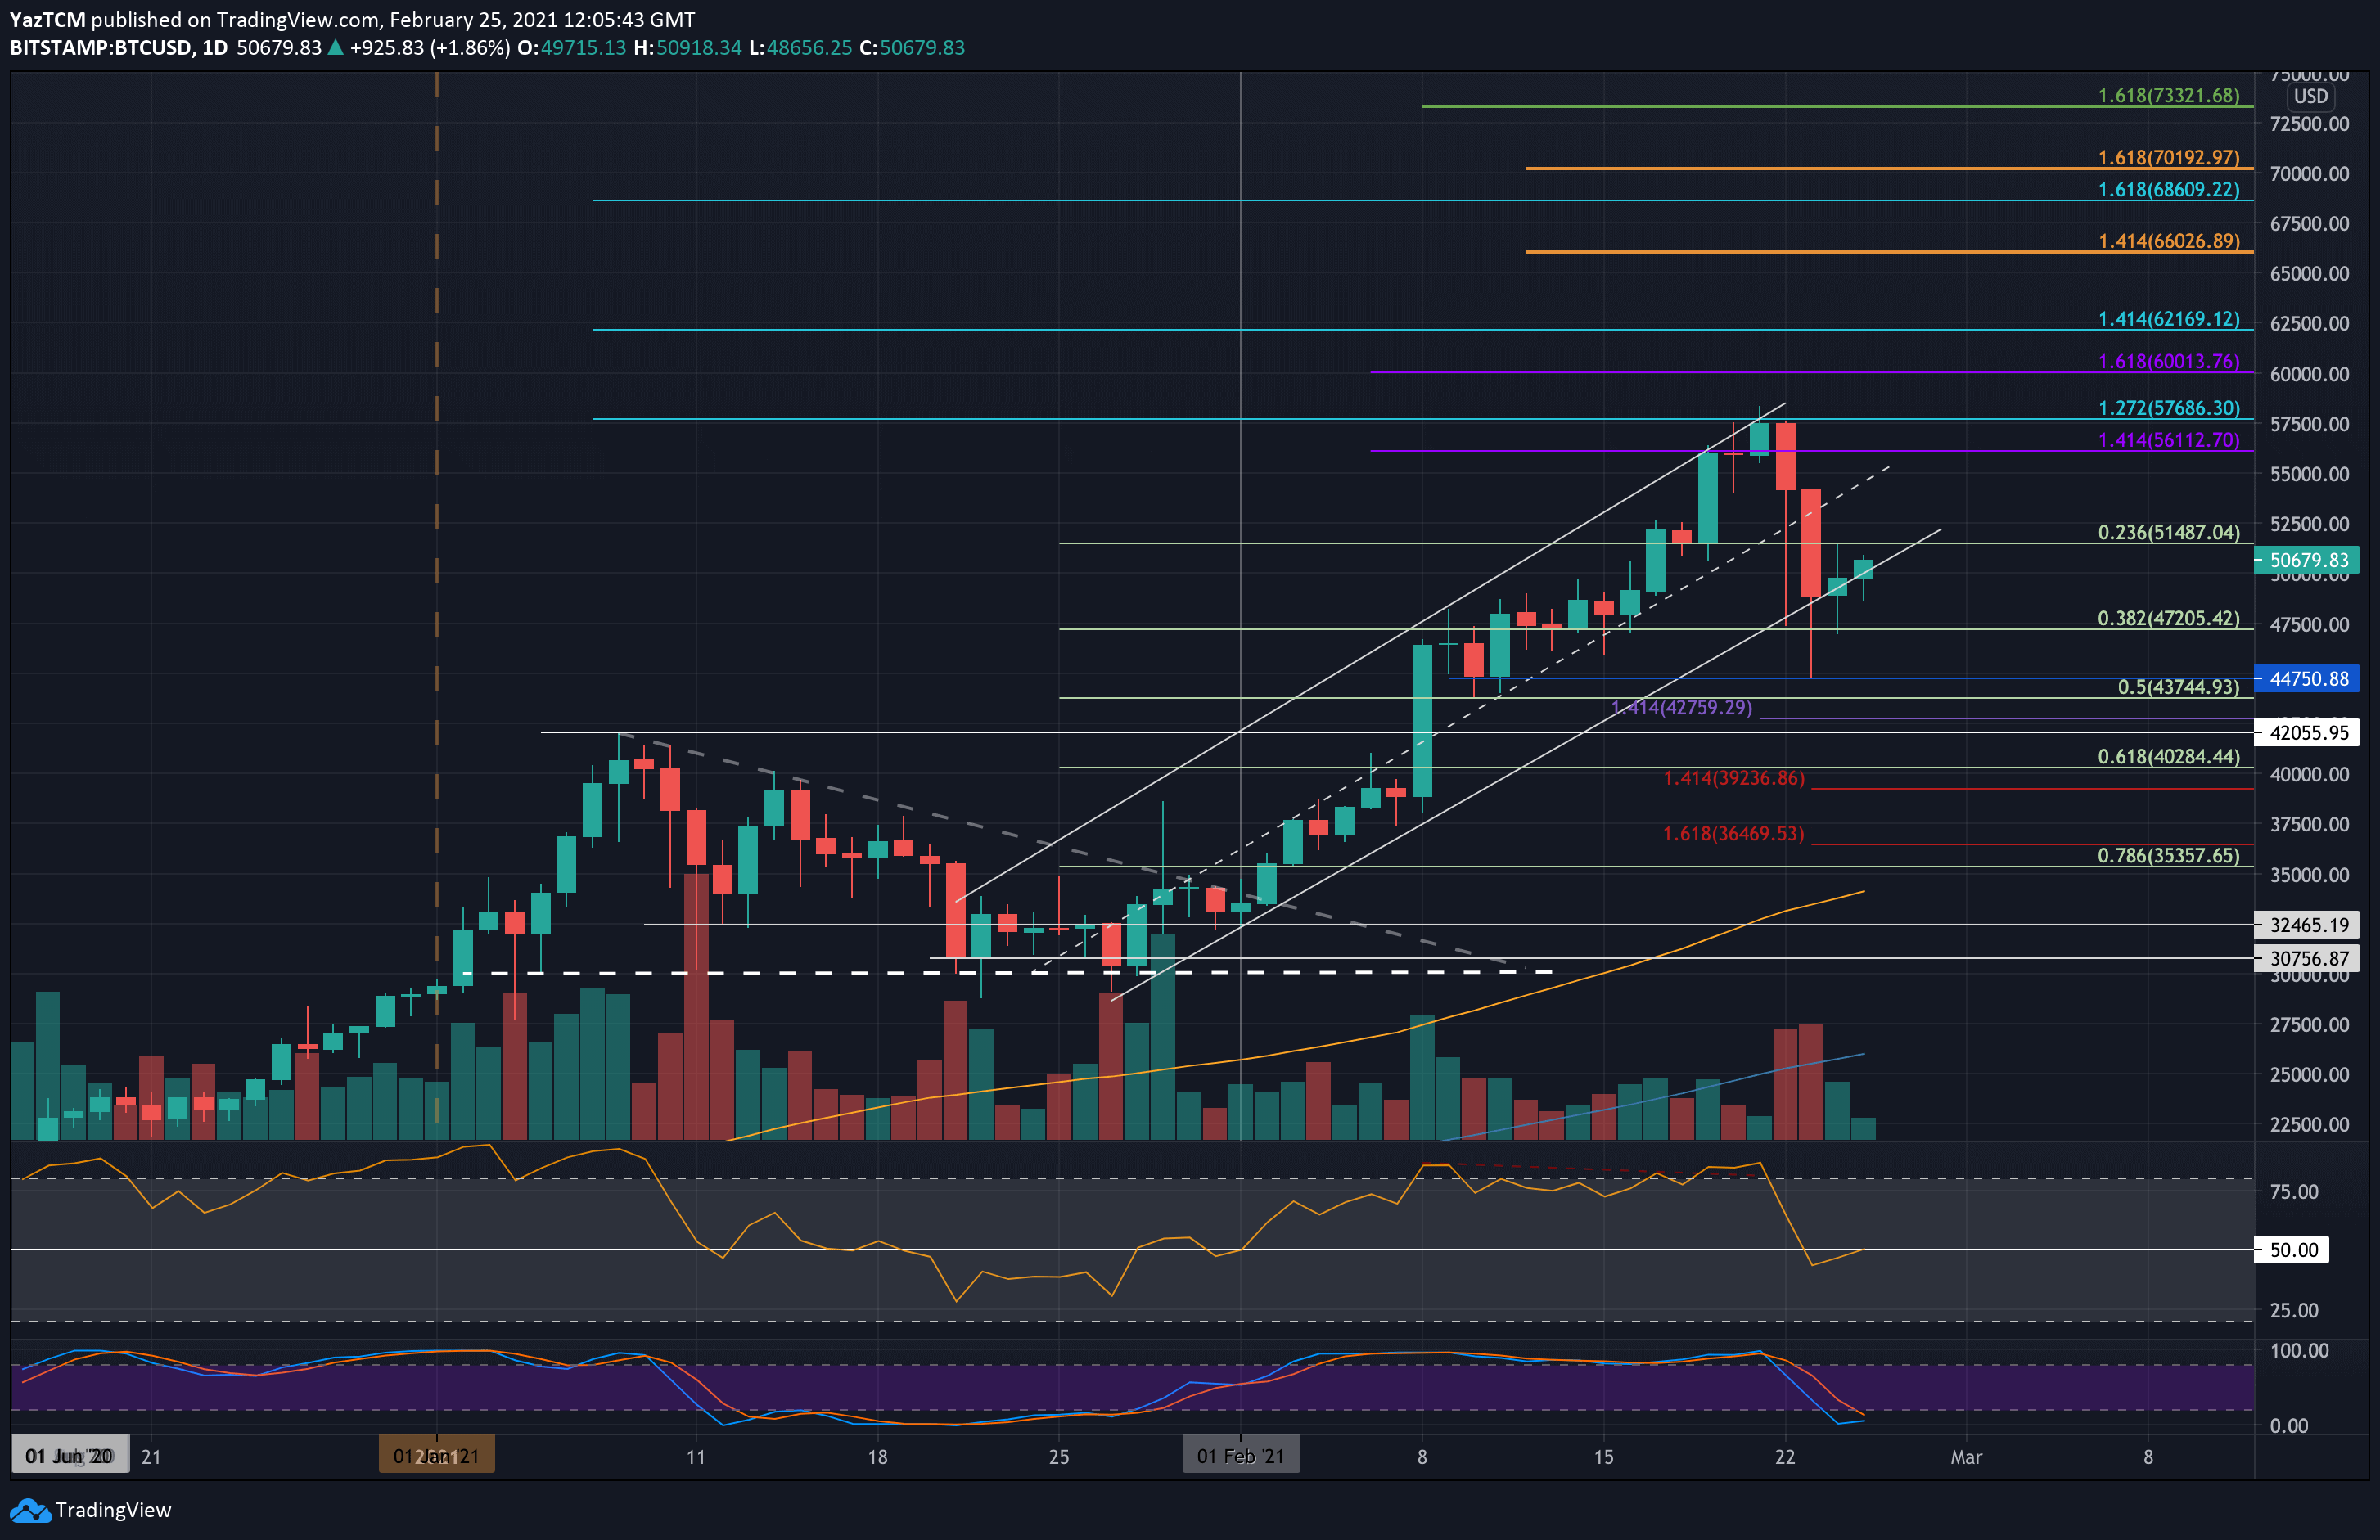
BTC/USD Daily Chart. Source: TradingView
The recent days were rough for Bitcoin after it dropped from the record high at $58,000 on Sunday by almost 25% just two days later. As of now, BTC bottomed at $44,750 on Tuesday and bounced back steadily to the $50K region. But, was that the ultimate short-term bottom after the 2-day bloodbath earlier this week?
Looking from a longer-term perspective, BTC managed to close the daily candles inside the ascending price channel that it has been following for the entire period of February. The upper boundary of this channel had provided strong resistance for the cryptocurrency on Sunday, just as BTC turned bearish and plunged towards $45K.
Following a decent recovery, yesterday Bitcoin dipped once again, reaching as low as $47,200 (.382 Fib) but it recovered to close the day inside the aforementioned price channel.
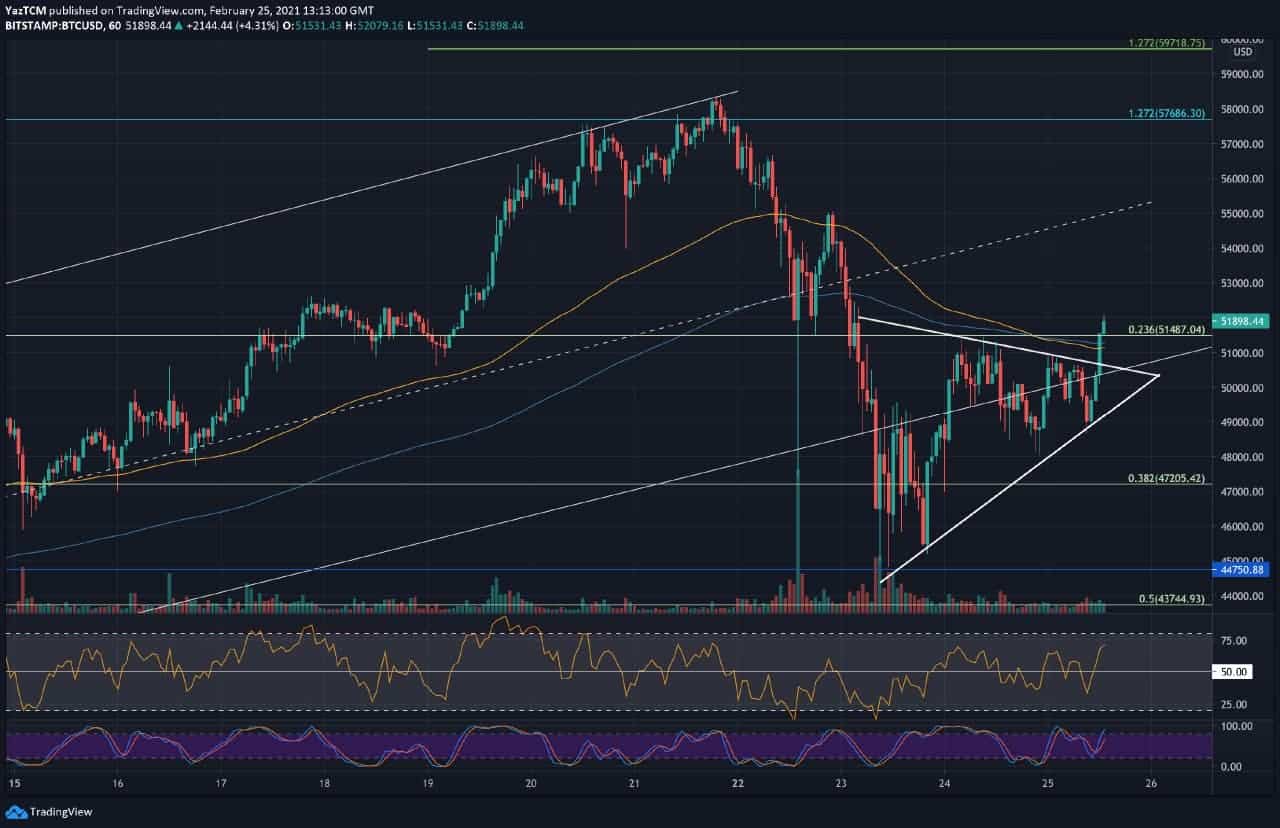
Looking at the short-term perspective, as can be seen on the following hourly chart, Bitcoin is now trading inside a symmetrical triangle pattern as it battles with the upper boundary, as of writing these lines. A breakout toward the upside could speed up the recovery, creating the necessary support around the $50K line. On the other side, a breakdown from the triangle’s lower boundary and Tuesday’s low might not be the weekly lowest.
UPDATE: As of Feb-25, 13:20 UTC, the anticipated breakout took place shortly after we posted this analysis. Bitcoin broke above the triangle around the $50.6K mark, spiking above $52,000 immediately.
Key Support Levels: $50,000, $48,000, $47,200, $44,750, $43,745.
Key Resistance Levels: $51,000, $52,500, $55,000, $56,112, $57,686.
Moving forward, in case BTC breaks above the triangle, the first level of resistance lies at $51,000. This is followed by $52,500, $55,000, and $56,112 (1.414 Fib Extension – purple). Additional resistance lies at $57,686 (1.272 Fib Extension – blue & ATH-day closing price), $59,000, and $60,000.
On the other side, the first support lies at $50,000. This is followed by the lower angle of the triangle, $48,000, and $47,200 (.382 Fib Retracement). Additional support is found at $44,750 (Tuesday’s low), $43,745 (.5 Fib), and $42,050.
The daily RSI has bounced higher over the past three days and is now at the midline, indicating indecision within the market. If it can rise higher from 50, the bullish momentum will increase and should help BTC trade higher within the price channel.