Following a bloody start to the new year of 2022, including a dip below $40K, Bitcoin finally sees some green. This analysis will determine if a local bottom was found and some relief to the bulls.
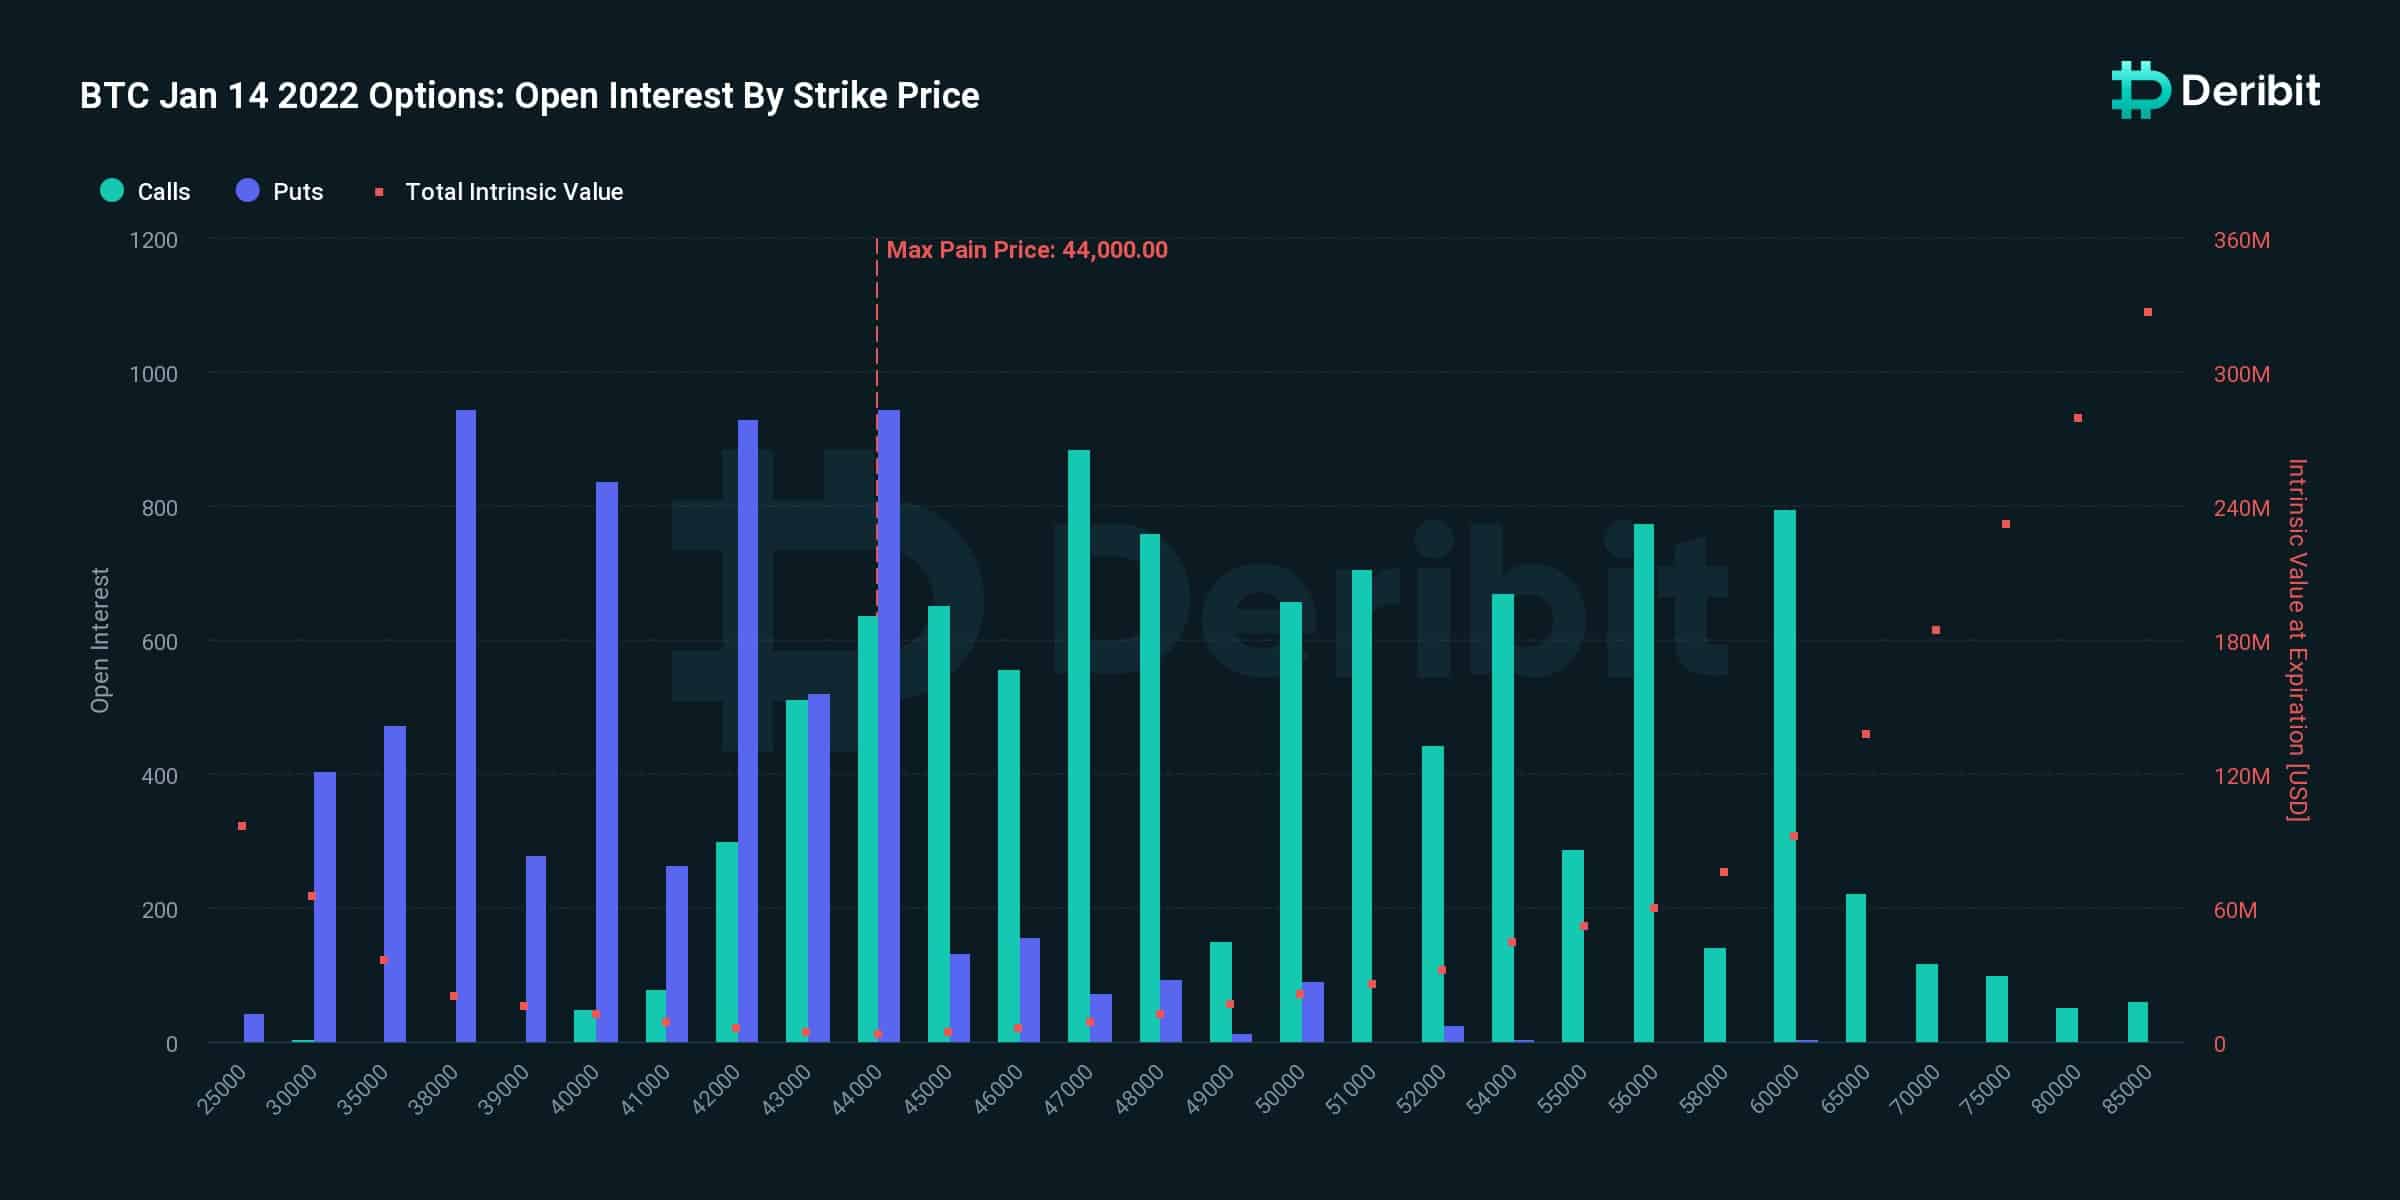
This coming Friday, January 14th, approximately $690 million worth of bitcoin options contracts will expire on Deribit’s exchange, with a max pain level of $44K, as can be seen below.
Currently, the put options open interests are significantly high, which could be due to the uncertainty in the crypto market caused by the Federal Reserve’s Board Chairman meeting with the Senate Banking, Housing, and Urban Affairs Committee.
It seems that options traders preferred to hedge their portfolios against any upcoming volatility over the next week. The options market data indicate that traders anticipate two significant levels – $38K and $45K – as the possible support and resistance for this incoming expiry.
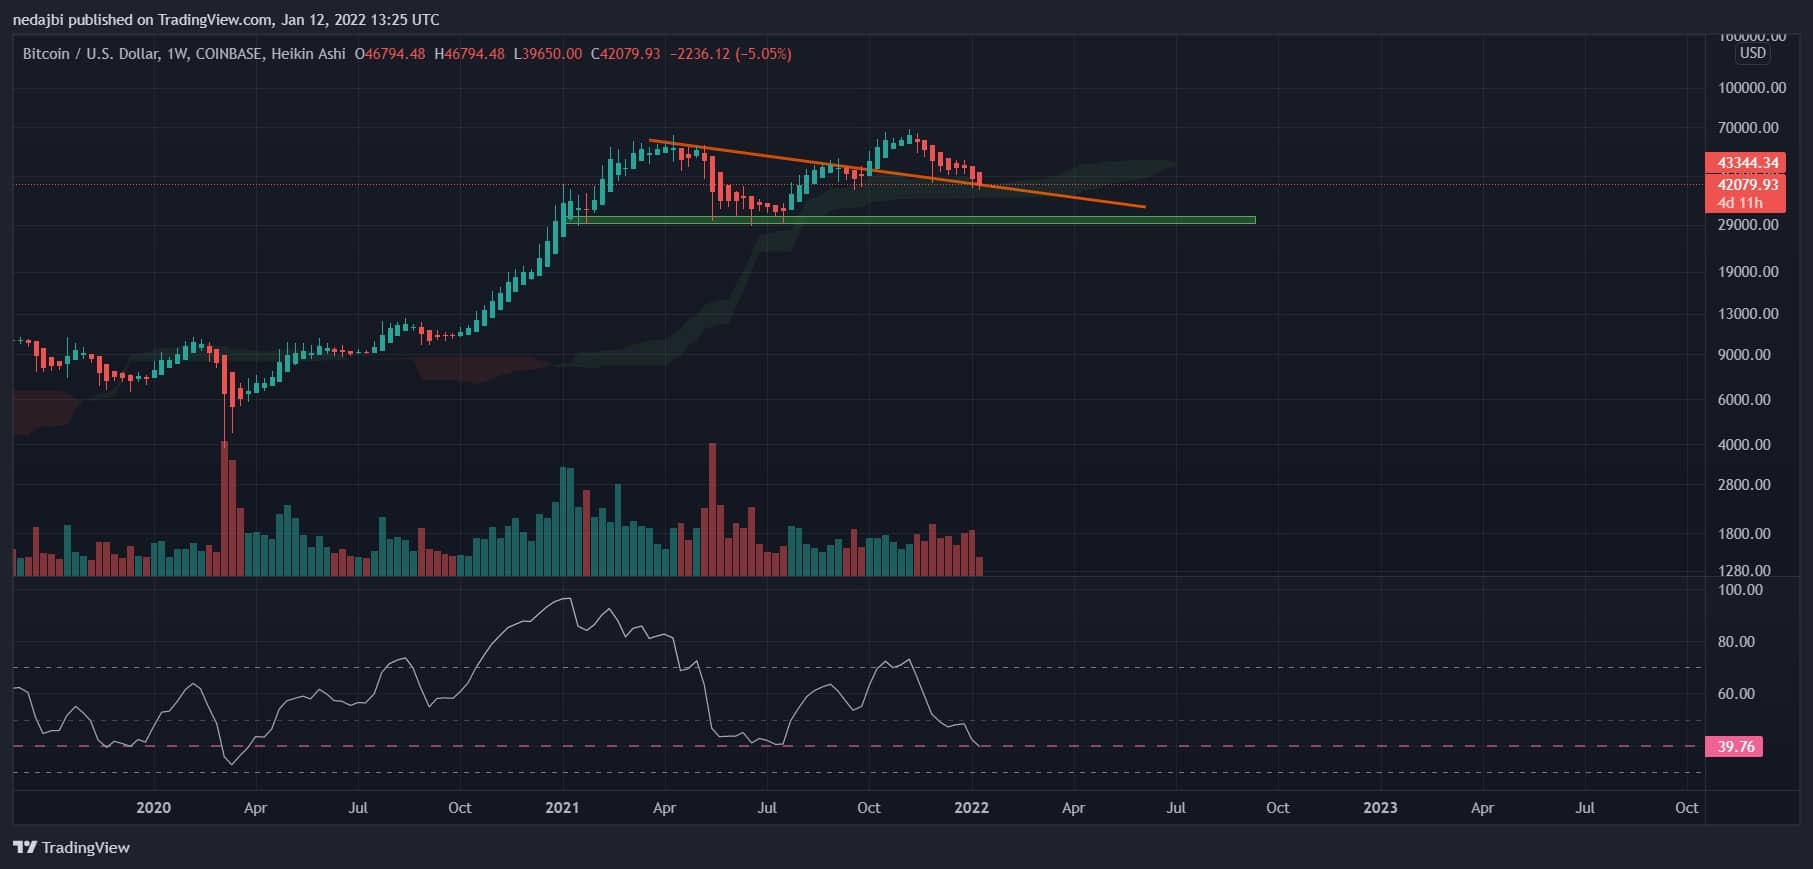
On the weekly time frame, bitcoin has been supported by the Ichimoku cloud. Additionally, the marked orange trendline has acted as support. Technical analysts may interpret this pattern as a pullback to the mentioned trendline on the weekly time frame.
If bitcoin loses the Ichimoku cloud as support and closes a full candle body inside the cloud, there is a high chance of dropping to $37K. The dotted line now supports the RSI on this time frame. Historically, the last the RSI lost this dotted line as support was amidst the Covid crash on March 2020.
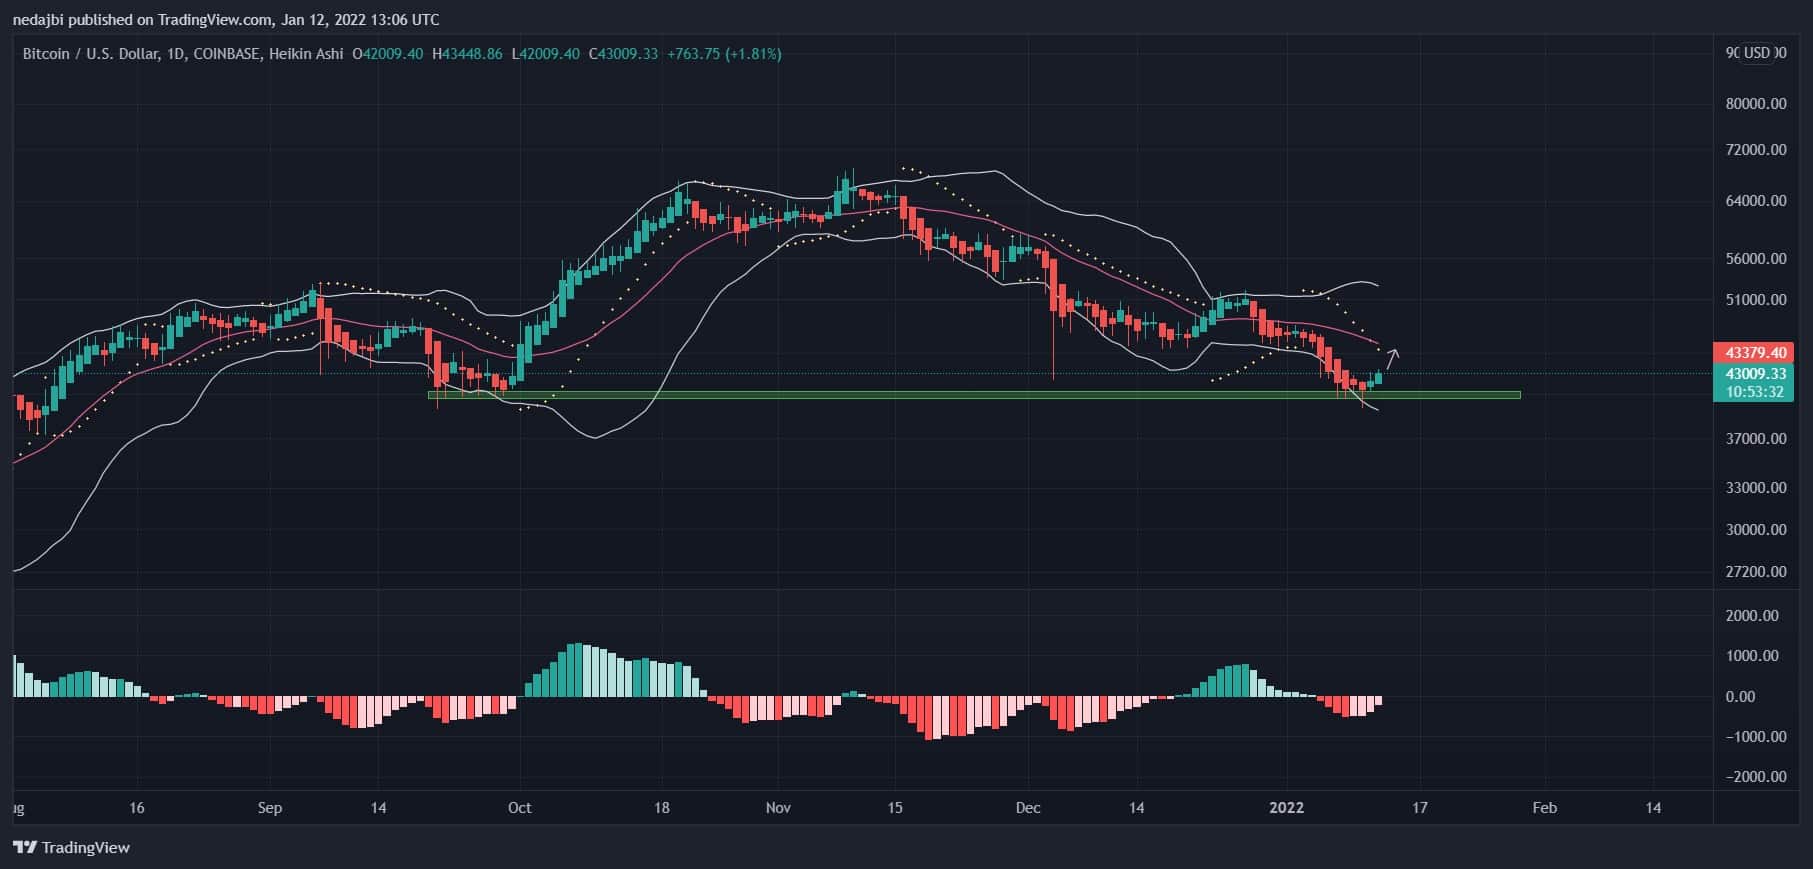
Over the last few days, the $40-42K zone acted as a decent support level for bitcoin. Since BTC lost the middle line of the Bollinger Bands, the parabolic SAR also signaled a downtrend.
On Monday, bitcoin temporarily lost the green zone support but quickly rebounded above this critical zone. Since that reaction to the green support zone, the price has sharply increased (bitcoin is now trading above $43K). However, the parabolic SAR still does not confirm a momentum change in the price action despite the recent hours’ recovery. If the uptrend continues, Bitcoin may target the next resistance at the middle line of the Bollinger Bands over the upcoming days, which is around $45.5-46K.
An interesting on-chain event to highlight was an aggregated -29K BTC Netflow (outflow) from all exchanges on January 10th. This Netflow was the largest outflow since September 19th, 2021. A negative Netflow with this volume usually indicates the ‘capitulation phase’ in the market.
Technical analysis courtesy of @N_E_D_A.