Following our recent price analysis, we saw Bitcoin starting to go lower for a deeper correction. At least lower than the usual 38.2% Fib level correction we had seen three times before since the magnificent 2020 begun.
After Bitcoin was testing the long-term ascending trend-line at $10,500 – a trend-line which had started forming in July 2019 – we saw Bitcoin getting rejected severely, breaking down the 38.2% Fib level at $10,200.
On our recent price analysis, we expected Bitcoin to go even lower, and this is precisely what happened. Yesterday’s low was $9,598 (Bitstamp).
Is this the end of the correction? Would Bitcoin make a come back above $10,000 very soon? Could be.
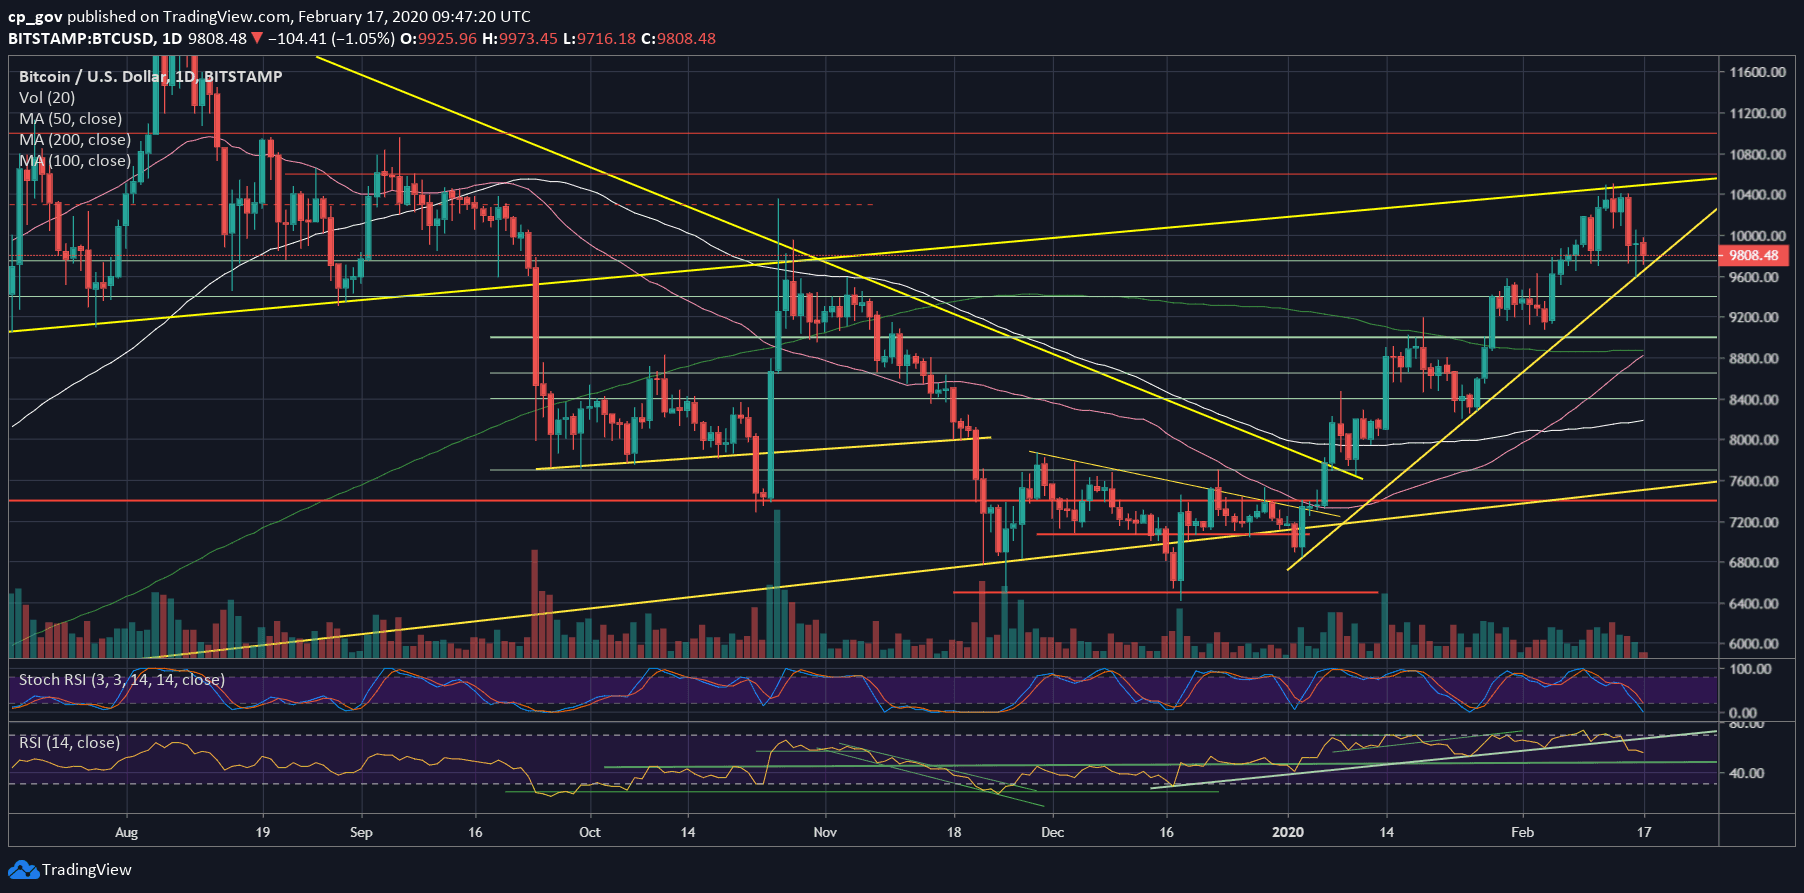
One bullish supporting sign might be coming from the speed of the buyers that rapidly bought Bitcoin around yesterday’s $9600 low. Besides, the $9600 is also a mid-term ascending trend-line, as can be seen on the following daily chart.
At first, the recent Bitcoin price correction didn’t cause a further sell-off of altcoins. However, today the story is different. After the dominance of Bitcoin reached low of 61%, the latter had surged to over 63%. The altcoins are plunging today in their Bitcoin value, many of the top ones seeing double-digit losses.
Total Market Cap: $282 billion
Bitcoin Market Cap: $178.8 billion
BTC Dominance Index: 63.3%
*Data by CoinGecko
– Support/Resistance levels: After Bitcoin found supported by the ascending trend-line, along with horizontal support at $9600, Bitcoin is now back above the critical level of $9770.
The next significant resistance lies at $9900, before the $10,000 resistance mark. In case of a break-up, then the next possible target is the $10,200 support turned resistance level. The next major level is $10,400 before the 2020 high at $10,500, along with the above mentioned long-term ascending trend-line on the daily chart.
From below, the first significant area of support now lies around the $9750 mark. This includes a robust horizontal support area which was kept since February 5. Besides, the Golden Fib level of the 2017 bull-run lies at $9770.
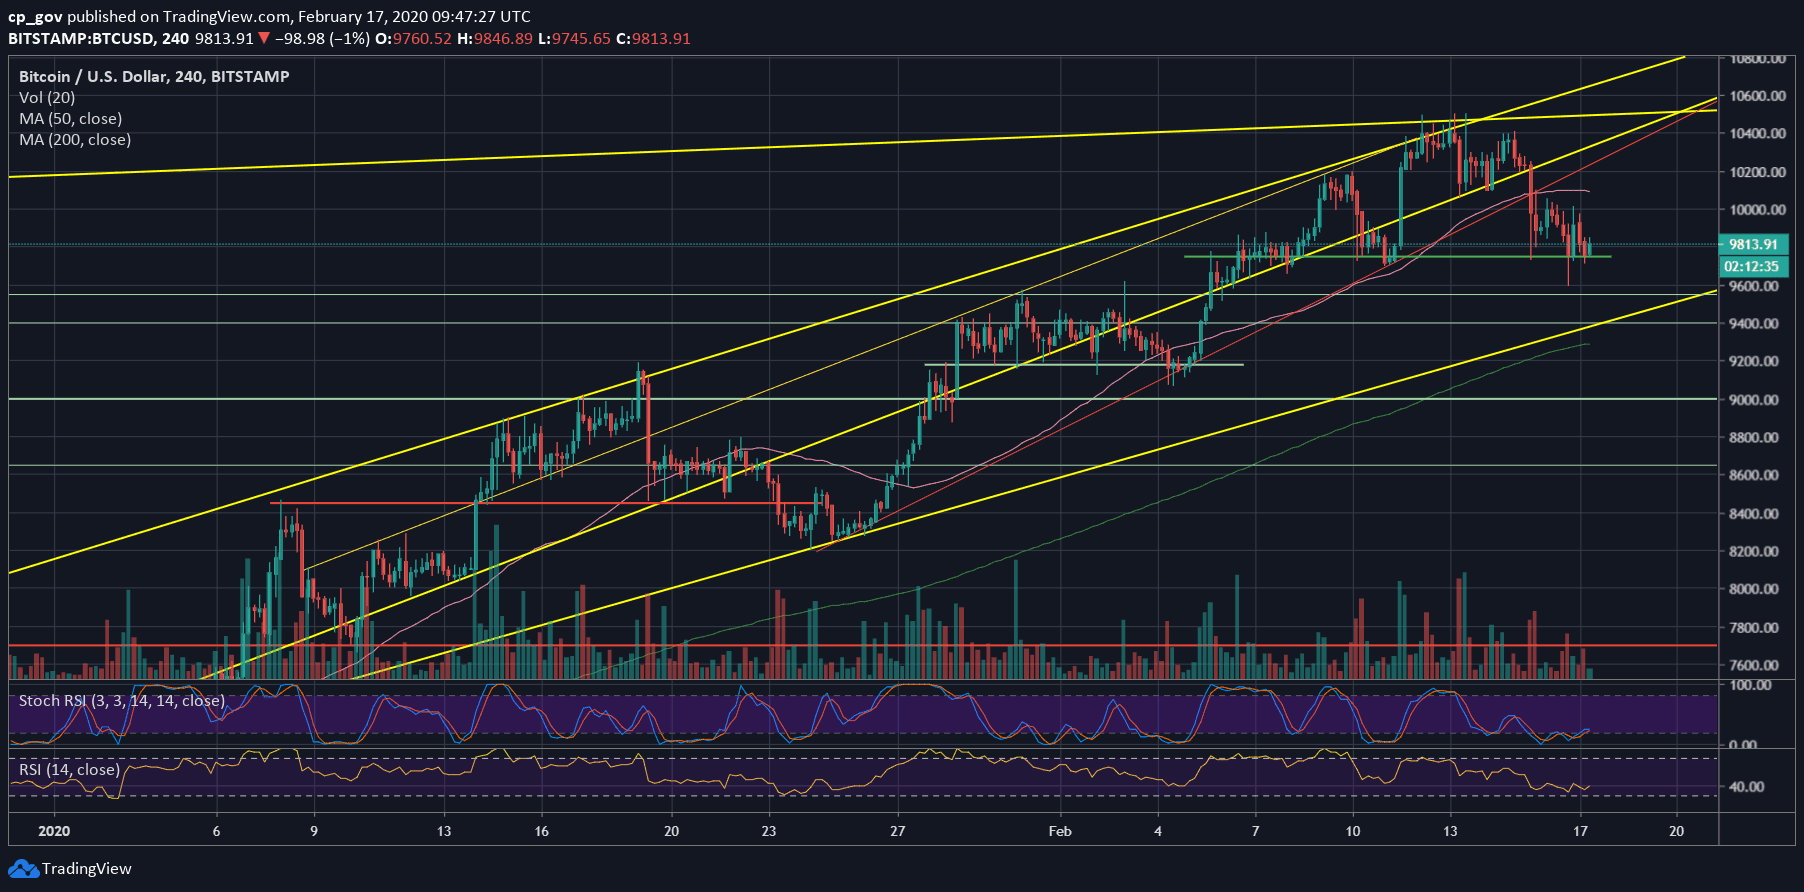
In case Bitcoin does break down the latter, the next support is yesterday low at $9600, before the significant $9400 support, along with a mid-term ascending trend-line shown on the 4-hour chart. Further below lies $9170 and $9000.
– The RSI Indicator: Following the breakdown of the higher lows’ trajectory in the RSI, we see the significant momentum indicator facing the 60-support area.
The stochastic RSI oscillator is very close to the overbought territory, so there is a little more room to go down; however, it might also signal on a possible end to the negative correction.
– Trading volume: In the last two days, the volume was low. This might prove that the market is indecisive and waiting for the next big move.