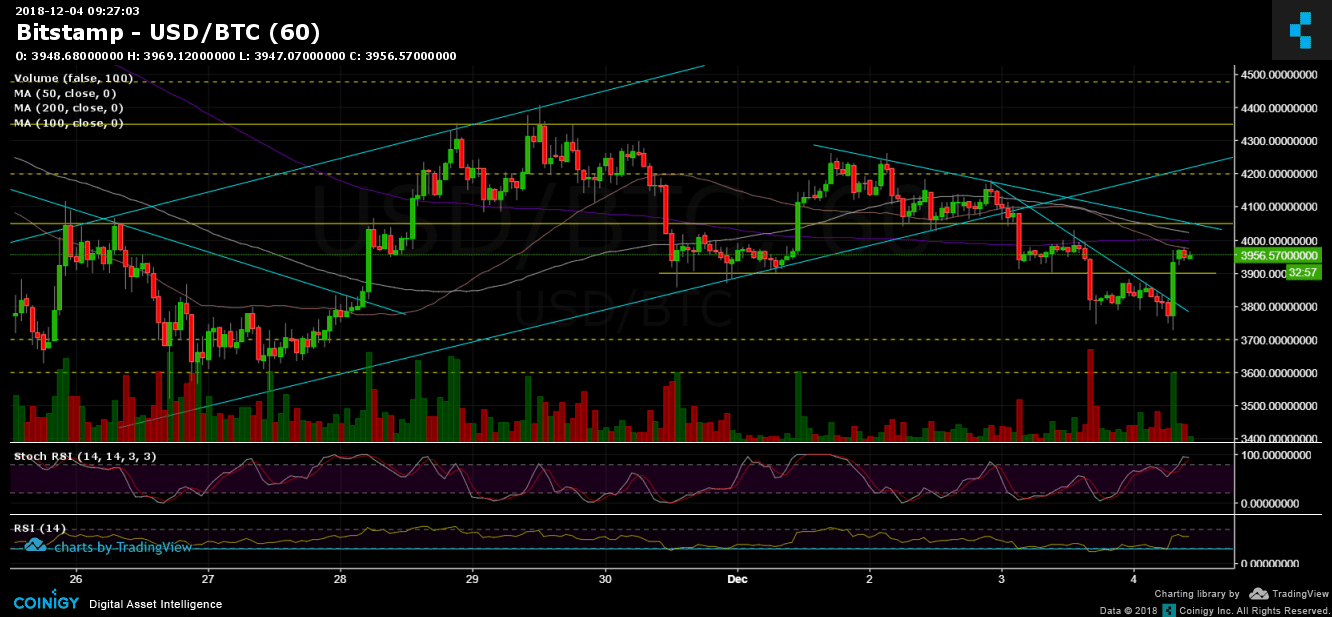
Over the past day and since breaking down the ascending channel, Bitcoin had lost the $3900 support level in its way to find the current low around the $3700 support mark.
There, buyers stepped in to produce a beautiful $250 one-hour green candle along with breaking out the hourly chart’s descending trend-line.
As a result, Bitcoin is now consolidating on top the $3900 level, where it was just a day ago.
For the mid-long term, I don’t see any change of the bearish momentum. Bitcoin might re-test the $4050 critical area, in order to confirm the level as a support-turned resistance, before turning bearish again.
To start thinking bullish, I would look for a breakout of the $4250 zone, which is the major prior high that was reached three days ago.
An issue to consider has risen lately following a very rare $257 Million worth of Bitcoin’s transaction. More info about the breaking news can be read here.
Looking at the 1-day & 1-hour charts
- The short-term: The hourly chart’s Stochastic RSI is about to cross at the overbought area. This might indicate on a possible correction down.
- From the bear side, the next support levels lie at $3900, $3800 and $3700 (the daily low), before getting to the yearly low’s area at $3500.
- From the bull side, the next major resistance level is around $4050, afterward is the $4250, and then the $4350 level.
- The trading volume is still low, compared to last week’s volume.
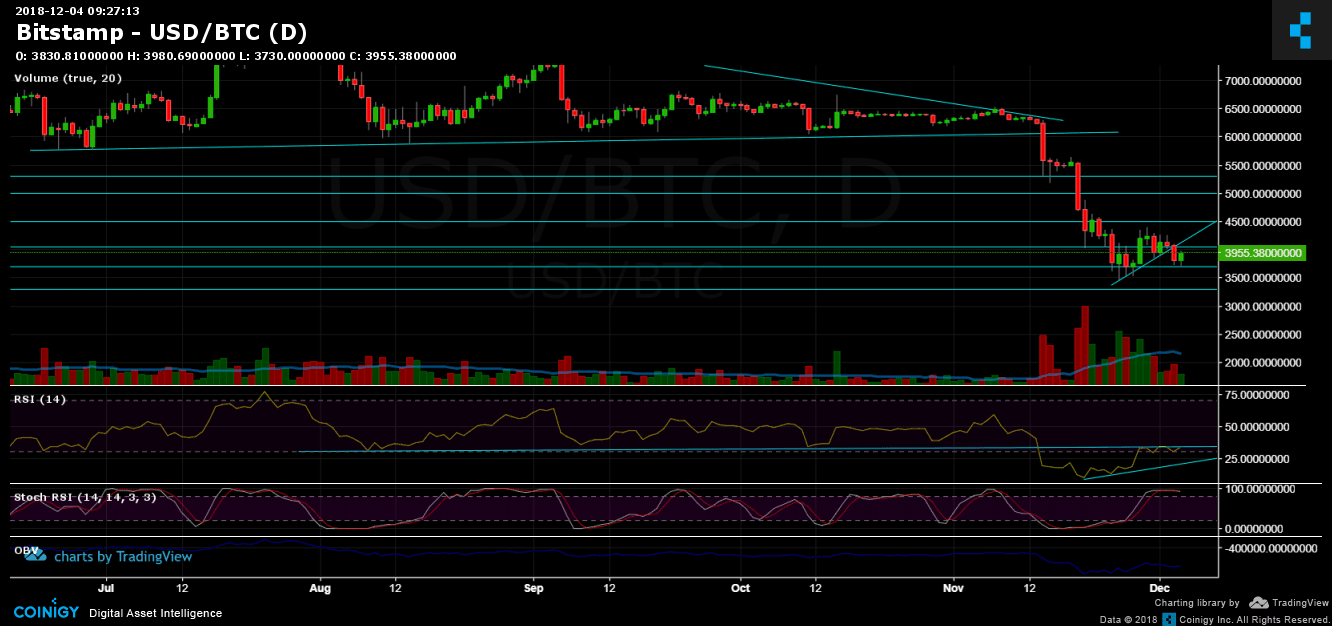
- The daily chart’s RSI indicator: The important indicator is testing the support turned resistance RSI line for the third time during the past week. Breaking the above line could signal a short to mid-term bullish movement while failing to do so is likely to send Bitcoin to find new annual lows.
- The daily chart’s Stochastic RSI oscillator is still about to cross at the overbought area.
- BitFinex’s open short positions have slightly decreased to 35.5K. We discussed the option of a short squeeze here.
BTC/USD BitStamp 1-Hour chart
BTC/USD BitStamp 1-Day chart
Cryptocurrency charts by TradingView. Technical analysis tools by Coinigy.
SPECIAL OFFER (Sponsored)
LIMITED OFFER 2024 for CryptoPotato readers at Bybit: Use this link to register and open a $500 BTC-USDT position on Bybit Exchange for free!
Disclaimer: Information found on CryptoPotato is those of writers quoted. It does not represent the opinions of CryptoPotato on whether to buy, sell, or hold any investments. You are advised to conduct your own research before making any investment decisions. Use provided information at your own risk. See Disclaimer for more information.