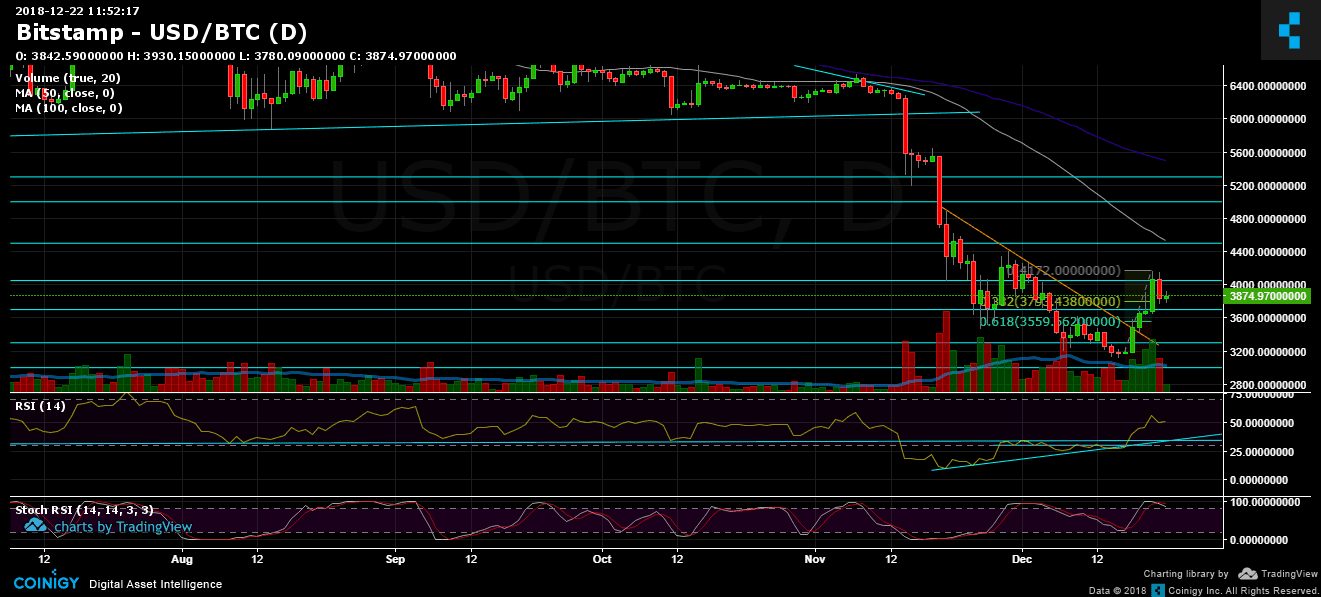
Since our previous BTC price analysis and as anticipated, Bitcoin had trouble breaking up the $4050 – $4100 resistance area.
Failing to break had led to a regression or correction and Bitcoin collapsed almost $400 to a daily low of $3770 (Bitstamp).
So far, this looks like a healthy correction following the 30% gain in three days. The correction had reached the 38.2% Fibonacci retracement level (marked on the attached daily chart) – around ~$3800.
Another reason for the correction might be the collapsing global markets. This December is so far the worst December since 1931. Wall Street fell 6-8% percent over the past week, following an interest rise.
Looking at the 1-day & 4-hour charts
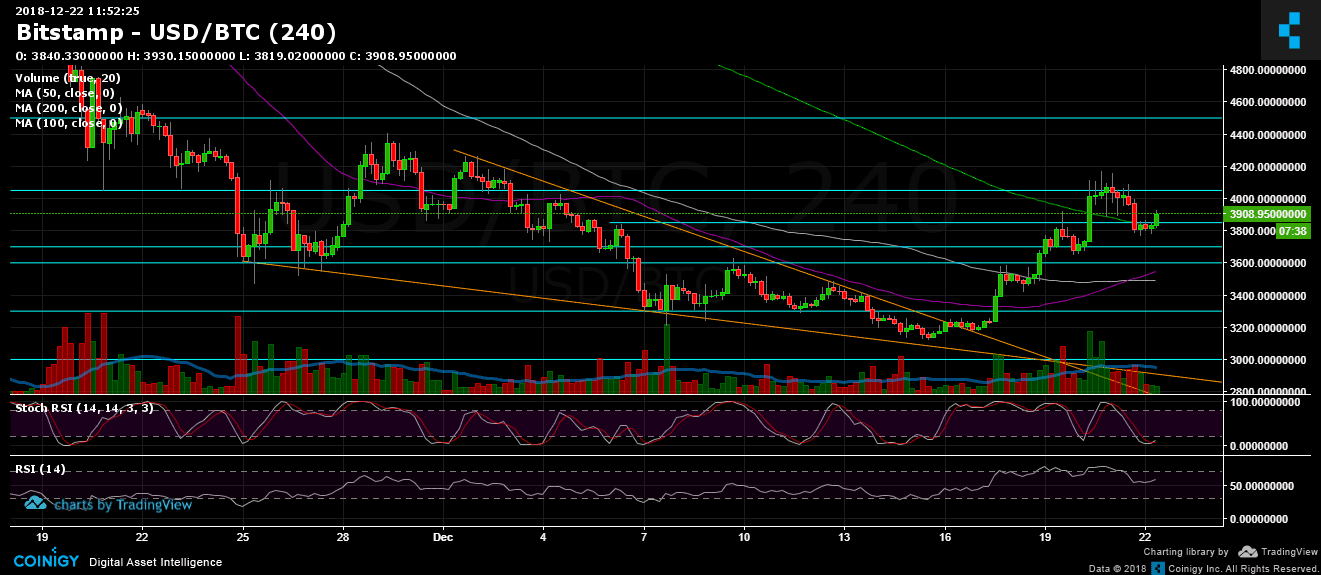
- Looking on the 4-hour chart, Bitcoin got supported on the 200 days moving average line (marked with light green). This MA line is critical, along with the $3850 support level.
- The correction is so far healthy. However, the daily chart’s Stochastic RSI oscillator has crossed over at the overbought level. This could trigger a deeper correction in the coming days.
- For the shorter-term, we might see Bitcoin getting closer to the $4000 again, as the 4-hour chart’s Stochastic RSI is about to cross over on the oversold area.
- The current area
- From the bear side, the support areas lie at $3770, $3700 and $3600.
- From the bull side, resistance lies at $4050 – $4100, $4200, and $4500 (along with the daily chart’s 50-days moving average line (white).
- The last level $4500, along with MA-50, is a key level for a possible change of the longer term bearish momentum.
- Trading volume: We see decent increasing volume green candles, while yesterday sellers’ candle was a shorter one. This is the first rule for a market controlled by buyers. Let’s see how it continues from here.
- BitFinex’s open short positions had decreased sharply to 34.6K BTC. Remember; when shorts are at their ATH expect a short squeeze. When shorts are at the bottom, expect a long squeeze.
BTC/USD BitStamp 4-Hour chart
BTC/USD BitStamp 1-Day chart
Cryptocurrency charts by TradingView. Technical analysis tools by Coinigy.
SPECIAL OFFER (Sponsored)
Binance Free $600 (CryptoPotato Exclusive): Use this link to register new account and receive $600 exclusive welcome offer on Binance (
full details).
LIMITED OFFER 2024 for CryptoPotato readers at Bybit: Use this link to register and open a $500 BTC-USDT position on Bybit Exchange for free!
Disclaimer: Information found on CryptoPotato is those of writers quoted. It does not represent the opinions of CryptoPotato on whether to buy, sell, or hold any investments. You are advised to conduct your own research before making any investment decisions. Use provided information at your own risk. See Disclaimer for more information.