Over the past day, Bitcoin had failed to break through the significant resistance area of $3500 – $3600. If an asset fails to break, it is likely to lose momentum. That’s what happened as Bitcoin marked $3350 as the daily low.
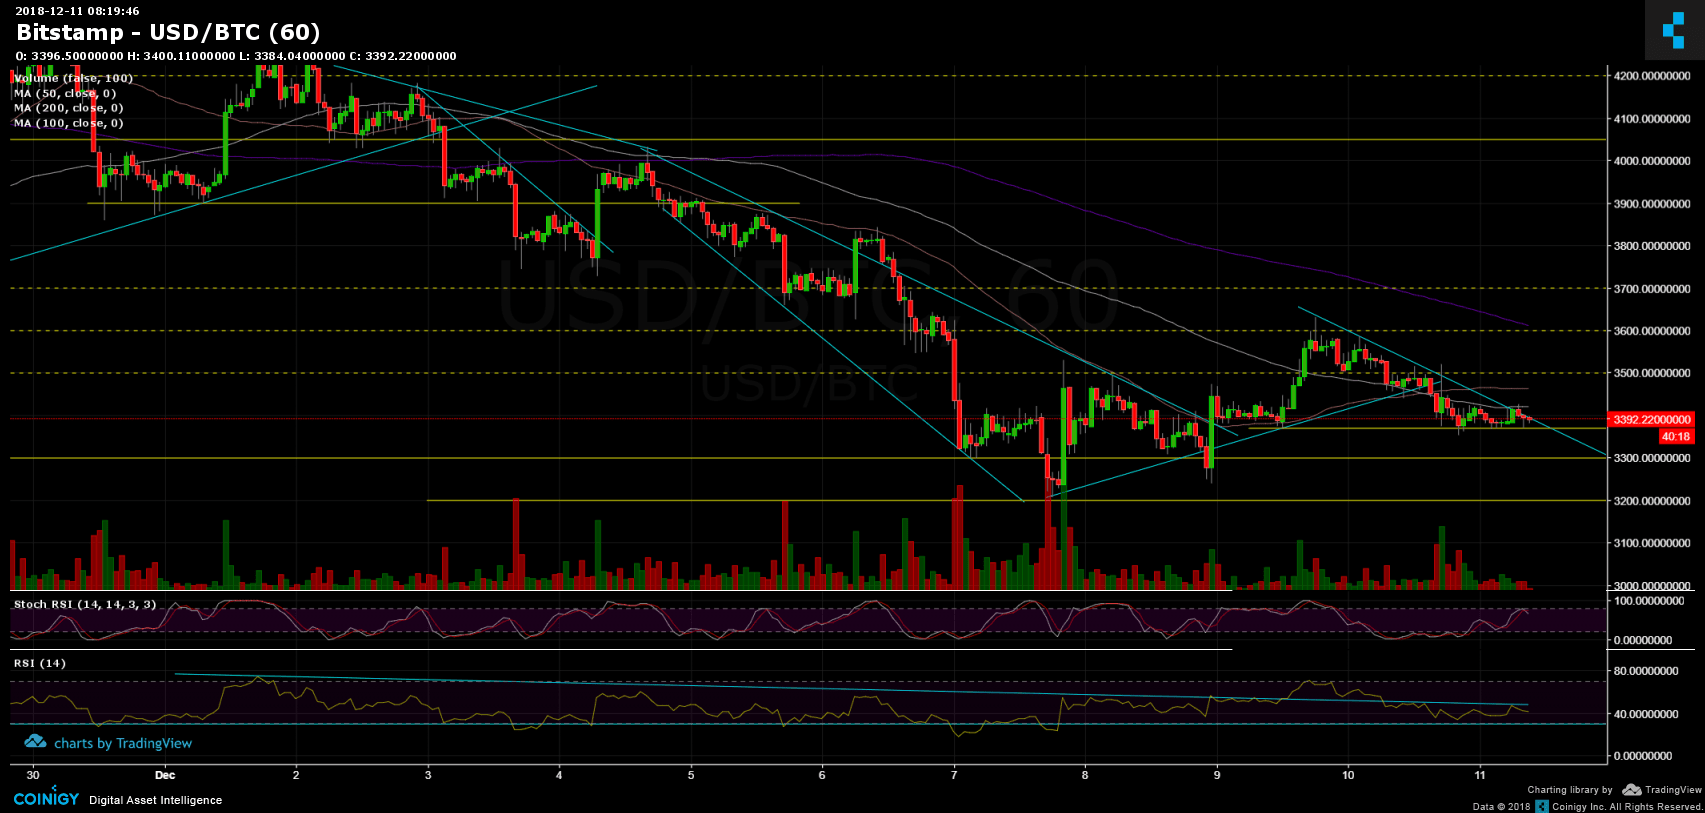
As of now, Bitcoin is consolidating over a tight range between $3370 and $3430 – just underneath the 100 days moving average line (marked in white on the 1-hour chart). This line was supporting Bitcoin yesterday, but now Bitcoin is testing it this time as a resistance.
Over the past two weeks, we talked lot about the importance of the RSI indicator – both in the daily and in the hourly chart. For me, as long as the RSI can’t break up the resistance (on the daily), the market would stay with no buying power.
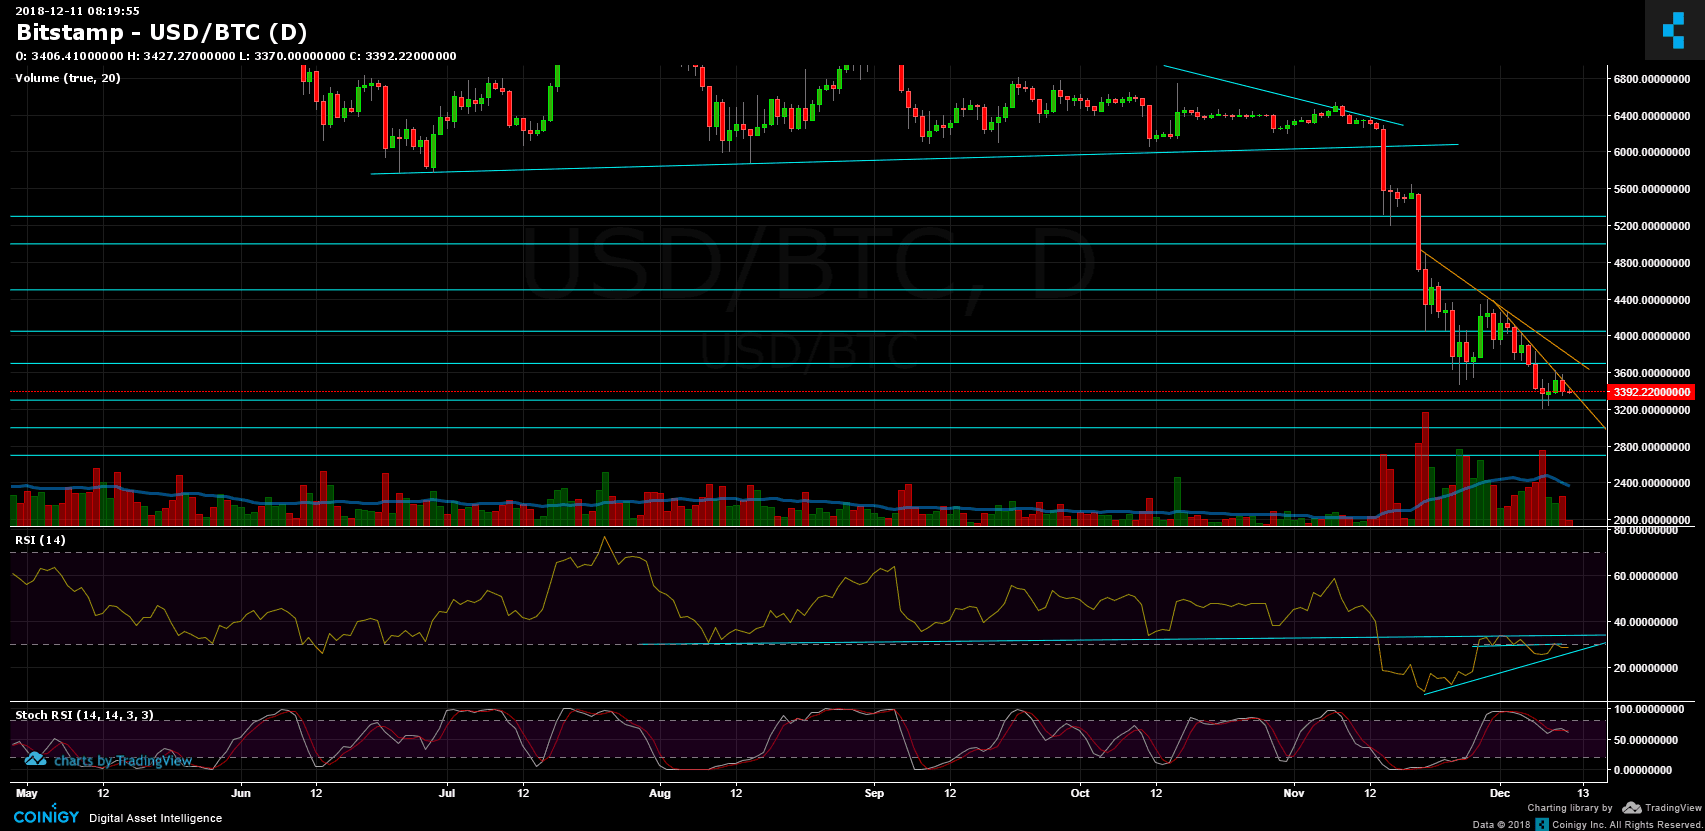
The above can also be told by looking at the trading volume on the daily candles’ chart. We are still seeing that the sellers’ candles are much higher than the green ones of the buyers’. No market can turn green without buying power.
Looking at the 1-day & 1-hour charts
- Talking about the RSI (short-term): in the hourly chart, we can see the descending trend-line and the bearish triangle that is forming. Bitcoin did attempt to break above the RSI triangle; however, it didn’t hold there much (it was tested once as support before breaking down back inside the triangle).
- Now, looking at the daily chart’s RSI: We’ve mentioned this yesterday – “the RSI found support and now encountering tough resistance.”, Unfortunate to the bulls, the RSI resistance didn’t break up, and as can be seen on the following chart it is facing down again. Unlike the hourly chart, the daily chart RSI pattern (mid-long term) is in a formation of a bullish triangle. The critical level is breaking up the 35 RSI level.
- Bitcoin is now underneath the 100 days MA support-turned resistance line (the white line), along with the descending trend-line.
- For the bulls, behind the 100 MA resistance, there is the $3500 level before reaching the $3600 – 3630 resistance area, where also lies the 200 days MA (the purple line).
- From the bear side – the closest support is nearby: $3350 – $3370. Below is the $3300 and $3200 level.
- As mentioned, the trading volume is in favor of the sellers.
- BitFinex’s open short positions had no change since yesterday, and currently stand around 36,700 BTC of open positions.
BTC/USD BitStamp 1-Hour chart
BTC/USD BitStamp 1-Day chart
Cryptocurrency charts by TradingView. Technical analysis tools by Coinigy.
SPECIAL OFFER (Sponsored)
Binance Free $600 (CryptoPotato Exclusive): Use this link to register new account and receive $600 exclusive welcome offer on Binance (
full details).
LIMITED OFFER 2024 for CryptoPotato readers at Bybit: Use this link to register and open a $500 BTC-USDT position on Bybit Exchange for free!
Disclaimer: Information found on CryptoPotato is those of writers quoted. It does not represent the opinions of CryptoPotato on whether to buy, sell, or hold any investments. You are advised to conduct your own research before making any investment decisions. Use provided information at your own risk. See Disclaimer for more information.