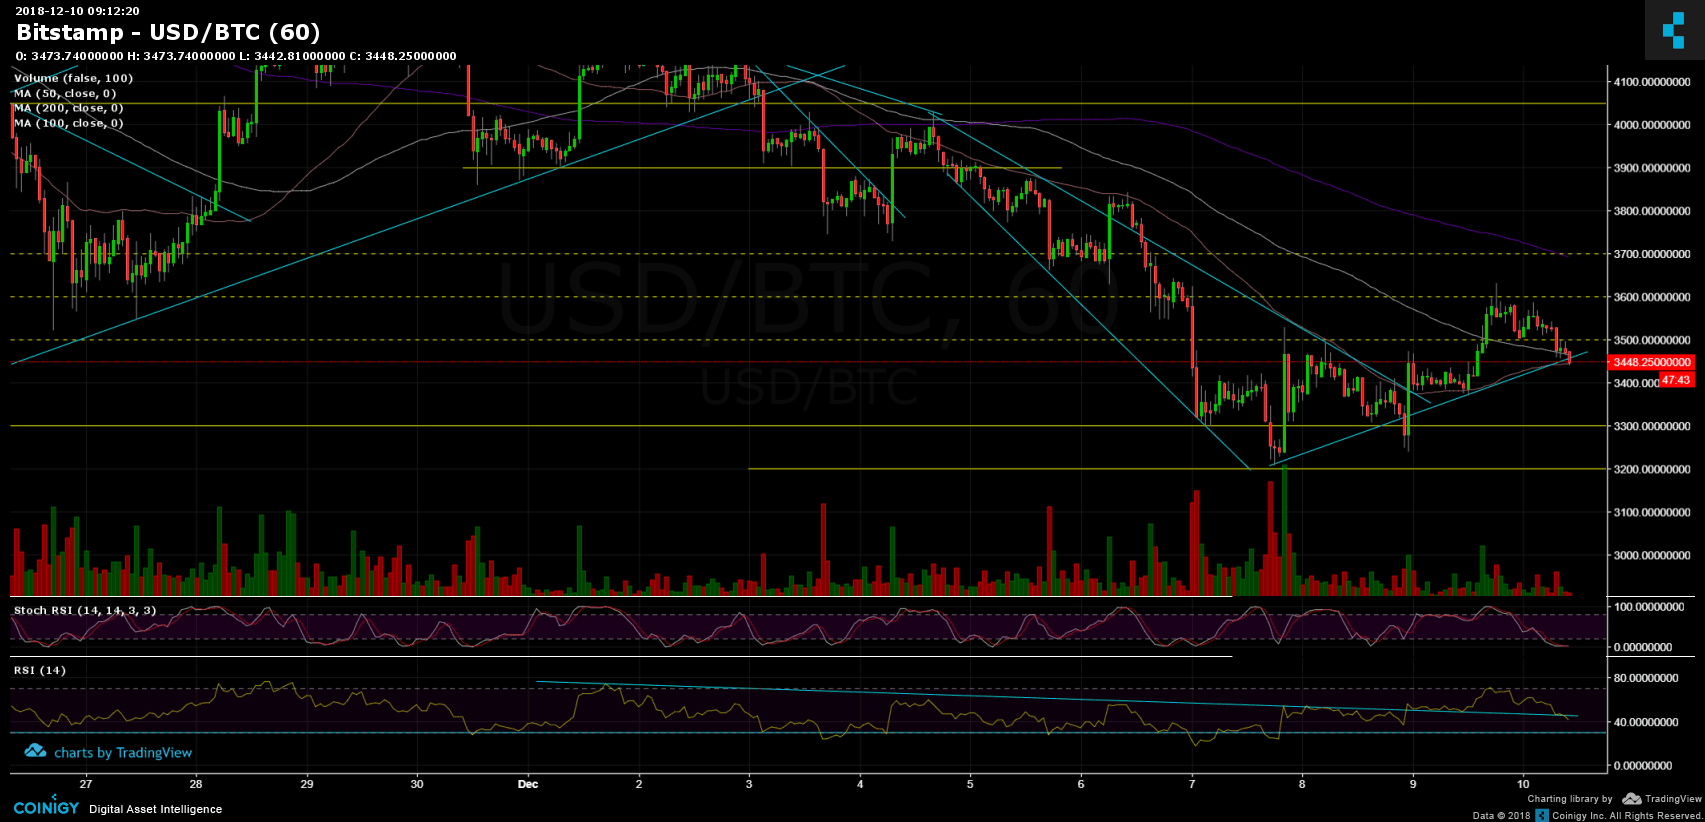
Since our previous price analysis, Bitcoin had enjoyed a second short squeeze, but this time the movement was weaker – around $200 gain. The most significant message is breaching out of the wedge pattern to the bull side (at $3380), along with breaking up the 50 days moving average resistance line (the pink line on the 1-hour chart). The breakout had led to a more substantial correction.
Like the one before, the short squeeze couldn’t hold up much time and regressed to re-test the moving average line along with the ascending trend-line.
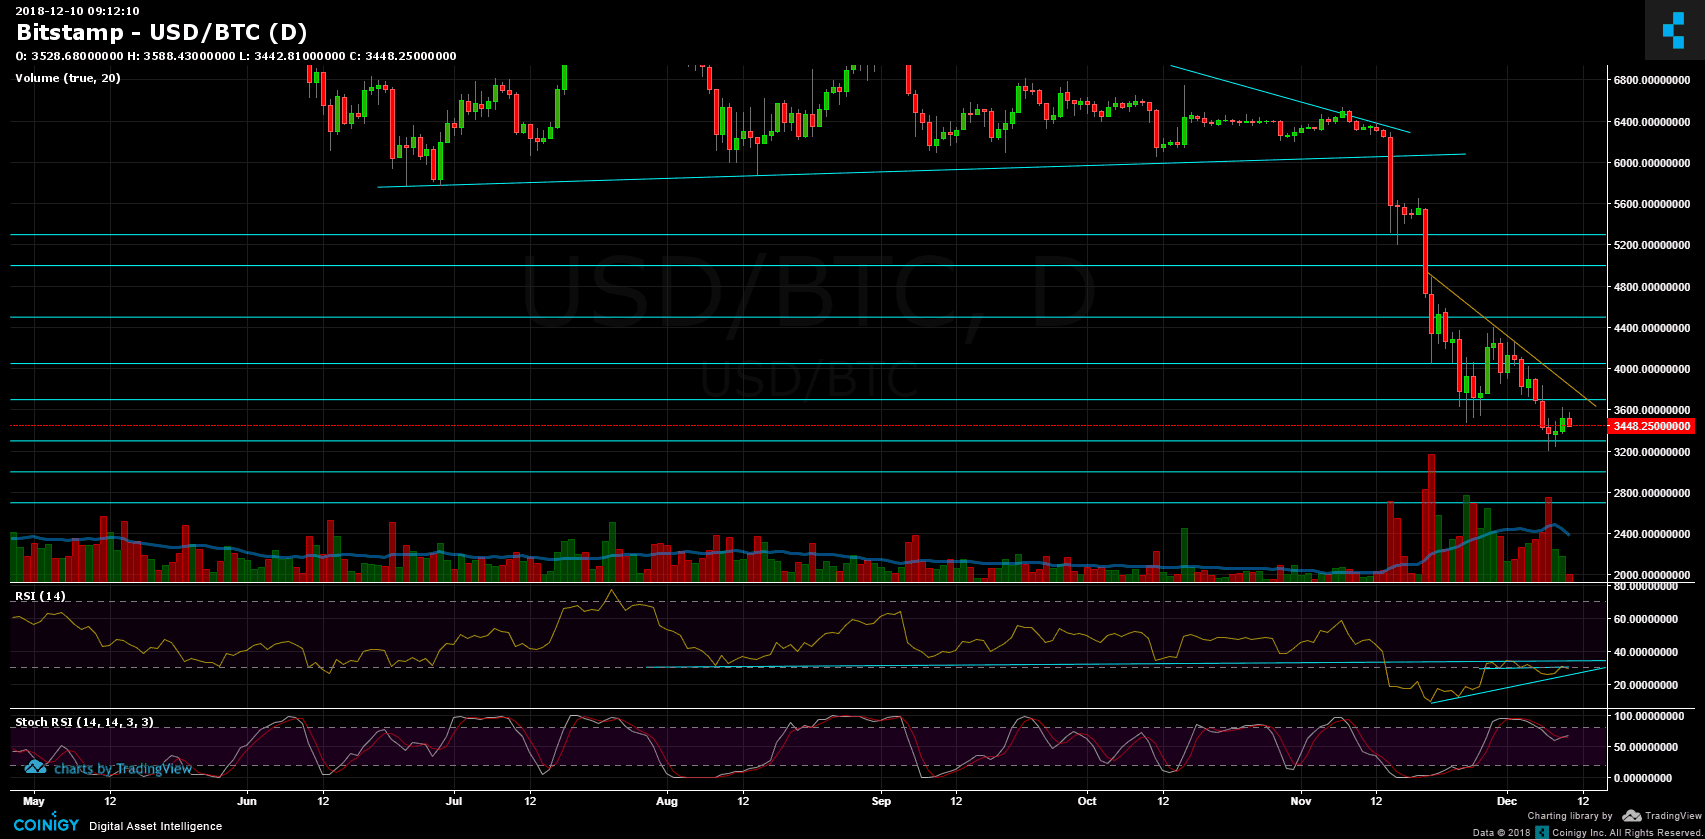
Yesterday’s night looked very bullish for Bitcoin: Topping $3630 (Bitstamp), breaching the 100 days moving averages (the white line on the chart): so far it seems like it is a correction only and not a reversal.
Looking at the 1-day & 1-hour charts
- Bitcoin is now on top of the 100 days MA support line (the white line), along with the ascending trend-line. For the short term, the important $3500 serves now as a resistance level for the short-term.
- For the bulls, behind $3500 lies the $3600 – 3630 resistance area, before getting to the 200 days MA (the purple line) resistance along with the $3700 resistance level.
- From the bear side – the closest support is the ascending line along with the two moving average lines – 50 and 100 days.
- The 1-Hour RSI is on a significant resistance. Might find support here. Also, Stochastic RSI oscillator is about to cross at its oversold area. As of now it didn’t cross yet, and the RSI line is at a crucial moment of decision.
- By looking at the daily chart RSI: As anticipated on our previous analysis, the RSI found support and now encountering tough resistance.
- The trading volume is in favor of the sellers: The green candles of the past two days were much smaller than the red ones of the days before. With no buyers, the last move up is only a correction to the bearish sentiment.
- BitFinex’s open short positions have decreased significantly for 4-days’ low, and currently stand around 36,700 BTC of open positions.
BTC/USD BitStamp 1-Hour chart
BTC/USD BitStamp 1-Day chart
Cryptocurrency charts by TradingView. Technical analysis tools by Coinigy.
SPECIAL OFFER (Sponsored)
Binance Free $600 (CryptoPotato Exclusive): Use this link to register new account and receive $600 exclusive welcome offer on Binance (
full details).
LIMITED OFFER 2024 for CryptoPotato readers at Bybit: Use this link to register and open a $500 BTC-USDT position on Bybit Exchange for free!
Disclaimer: Information found on CryptoPotato is those of writers quoted. It does not represent the opinions of CryptoPotato on whether to buy, sell, or hold any investments. You are advised to conduct your own research before making any investment decisions. Use provided information at your own risk. See Disclaimer for more information.