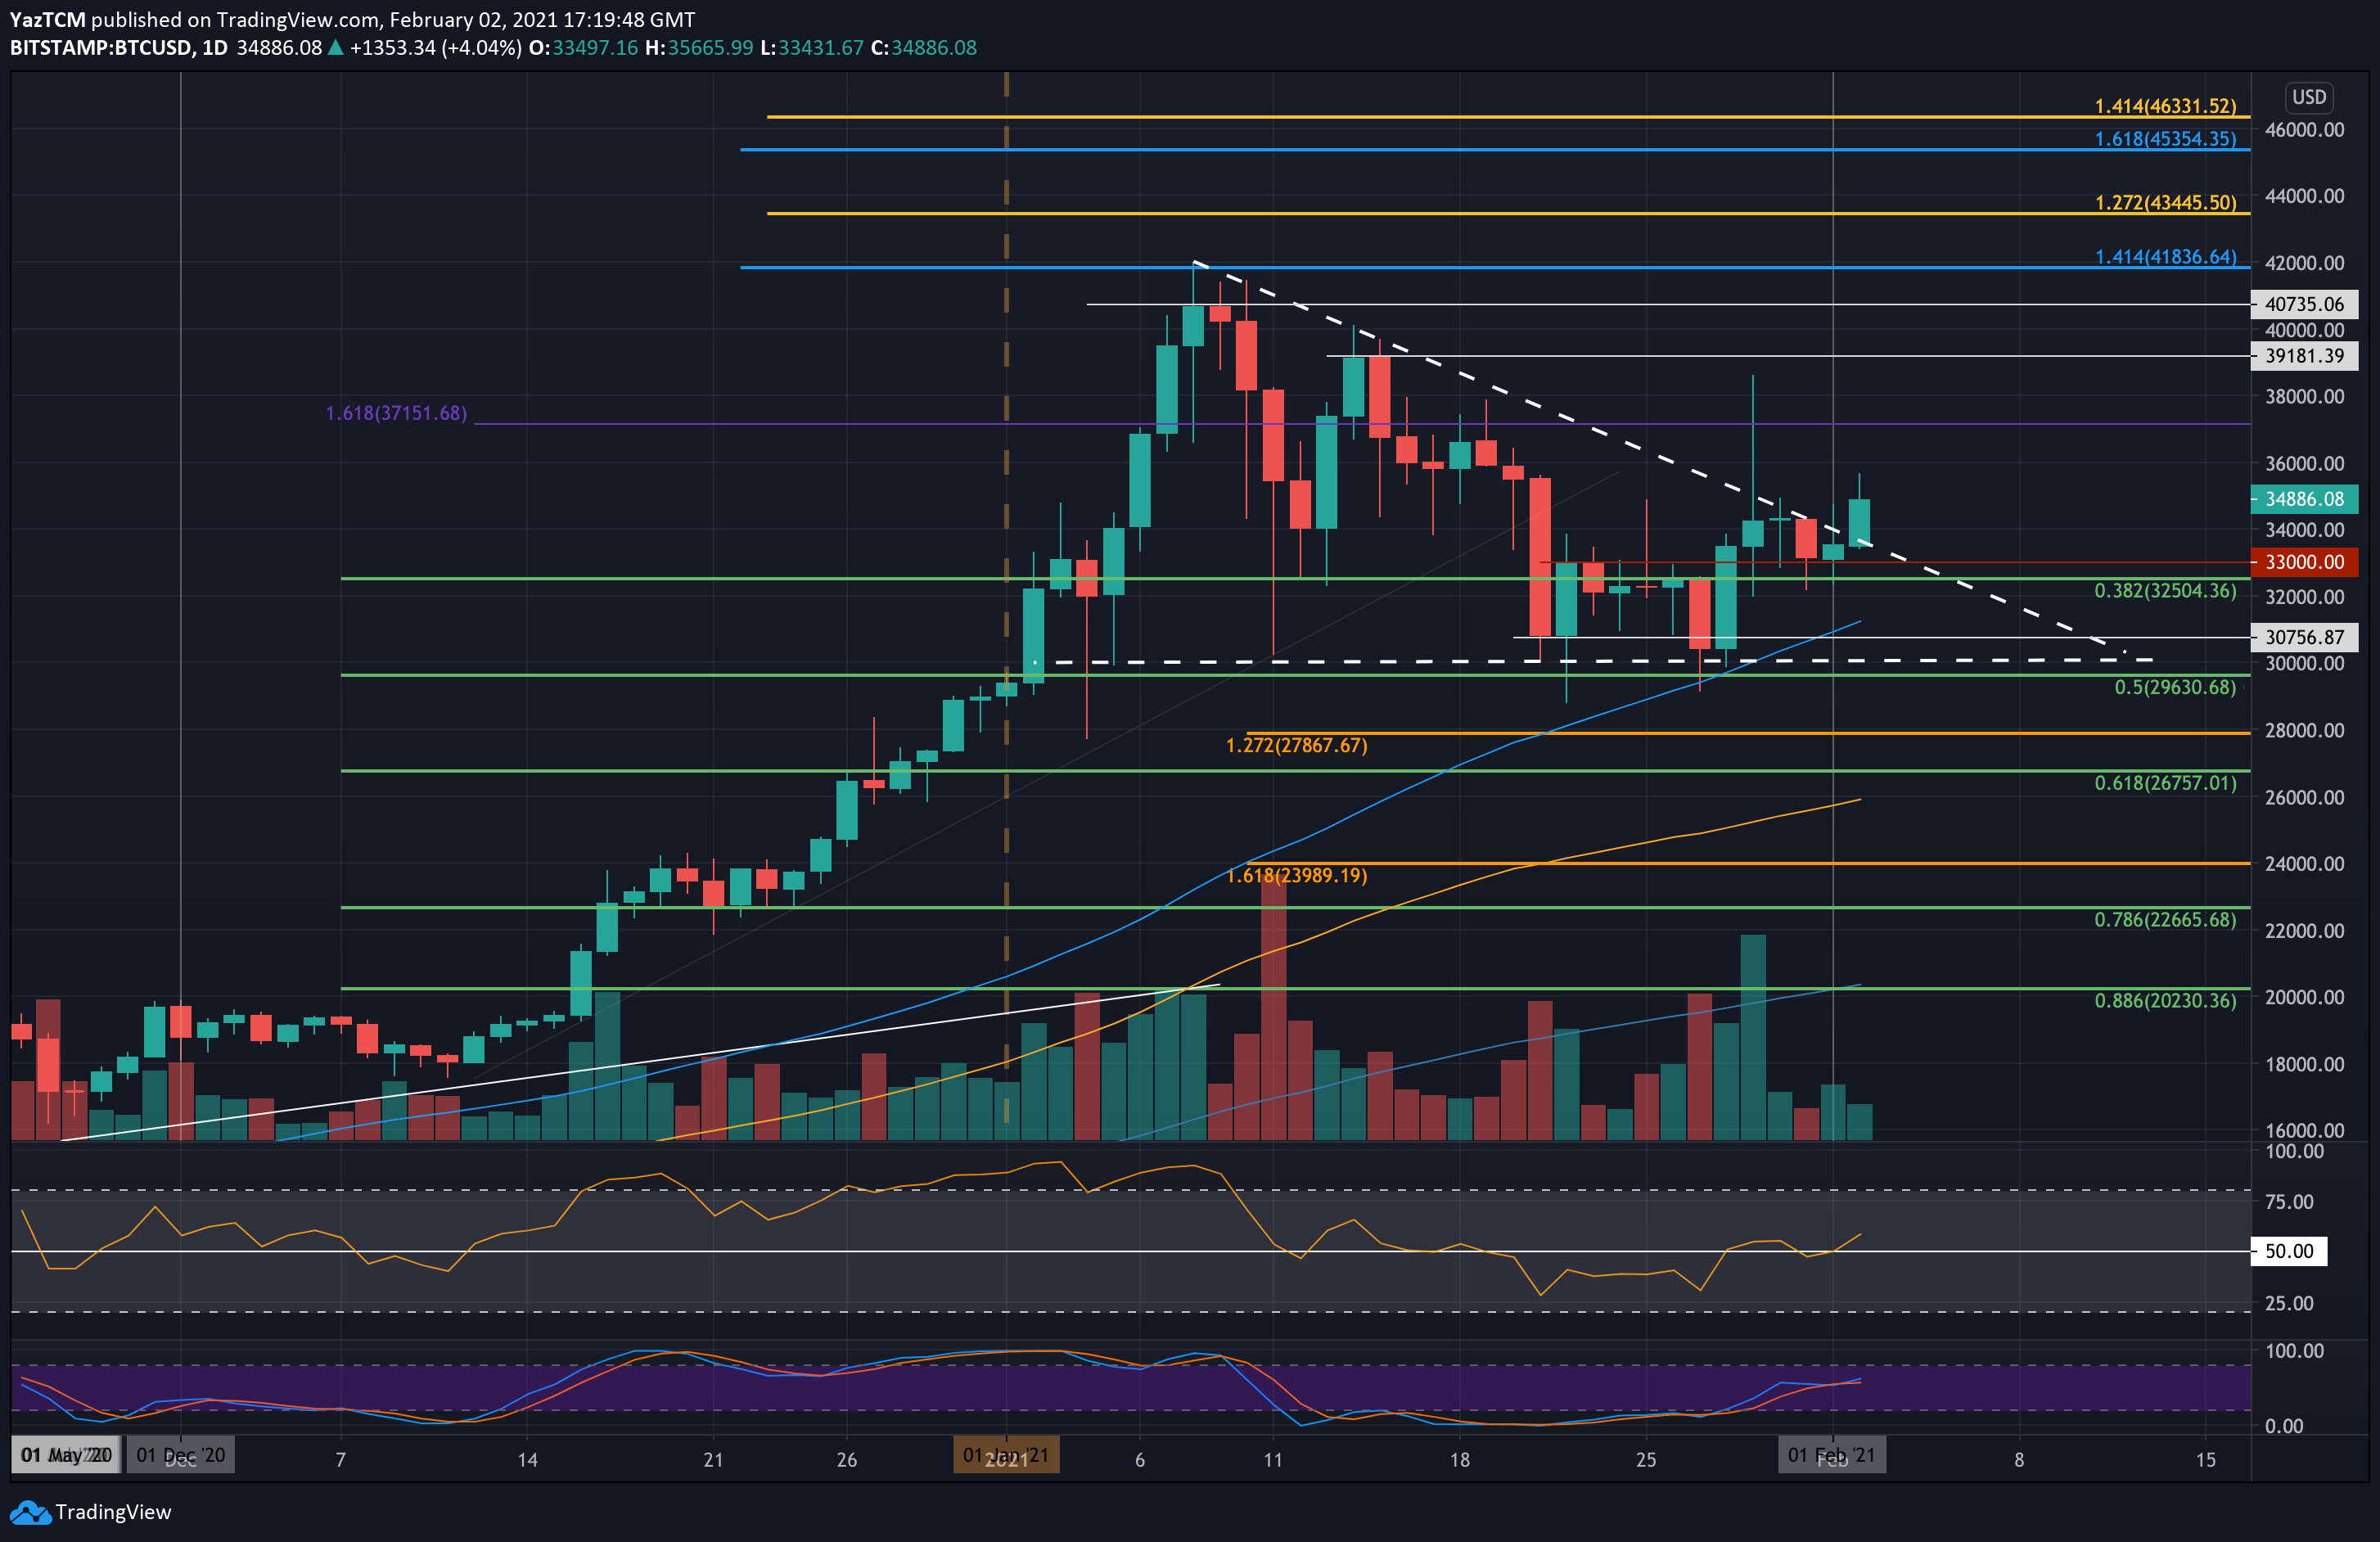
BTC/USD Daily Chart. Source: TradingView
Bitcoin increased by 4% today, gaining almost $2000, as of writing these lines. Bitcoin bounced from $33,000 to a daily high of $35,700. The primary cryptocurrency has been forming a descending triangle, as shown in the following daily chart. If today’s candle holds, Bitcoin might finally break out of the triangle.
As can be seen, last Friday was a major attempt to break above; however, this quickly turned into a false breakout. On that day, the cryptocurrency managed to spike beyond $38,000 following tweet by Elon Musk, but the sellers returned by the day’s end to push it back into the consolidation triangle.
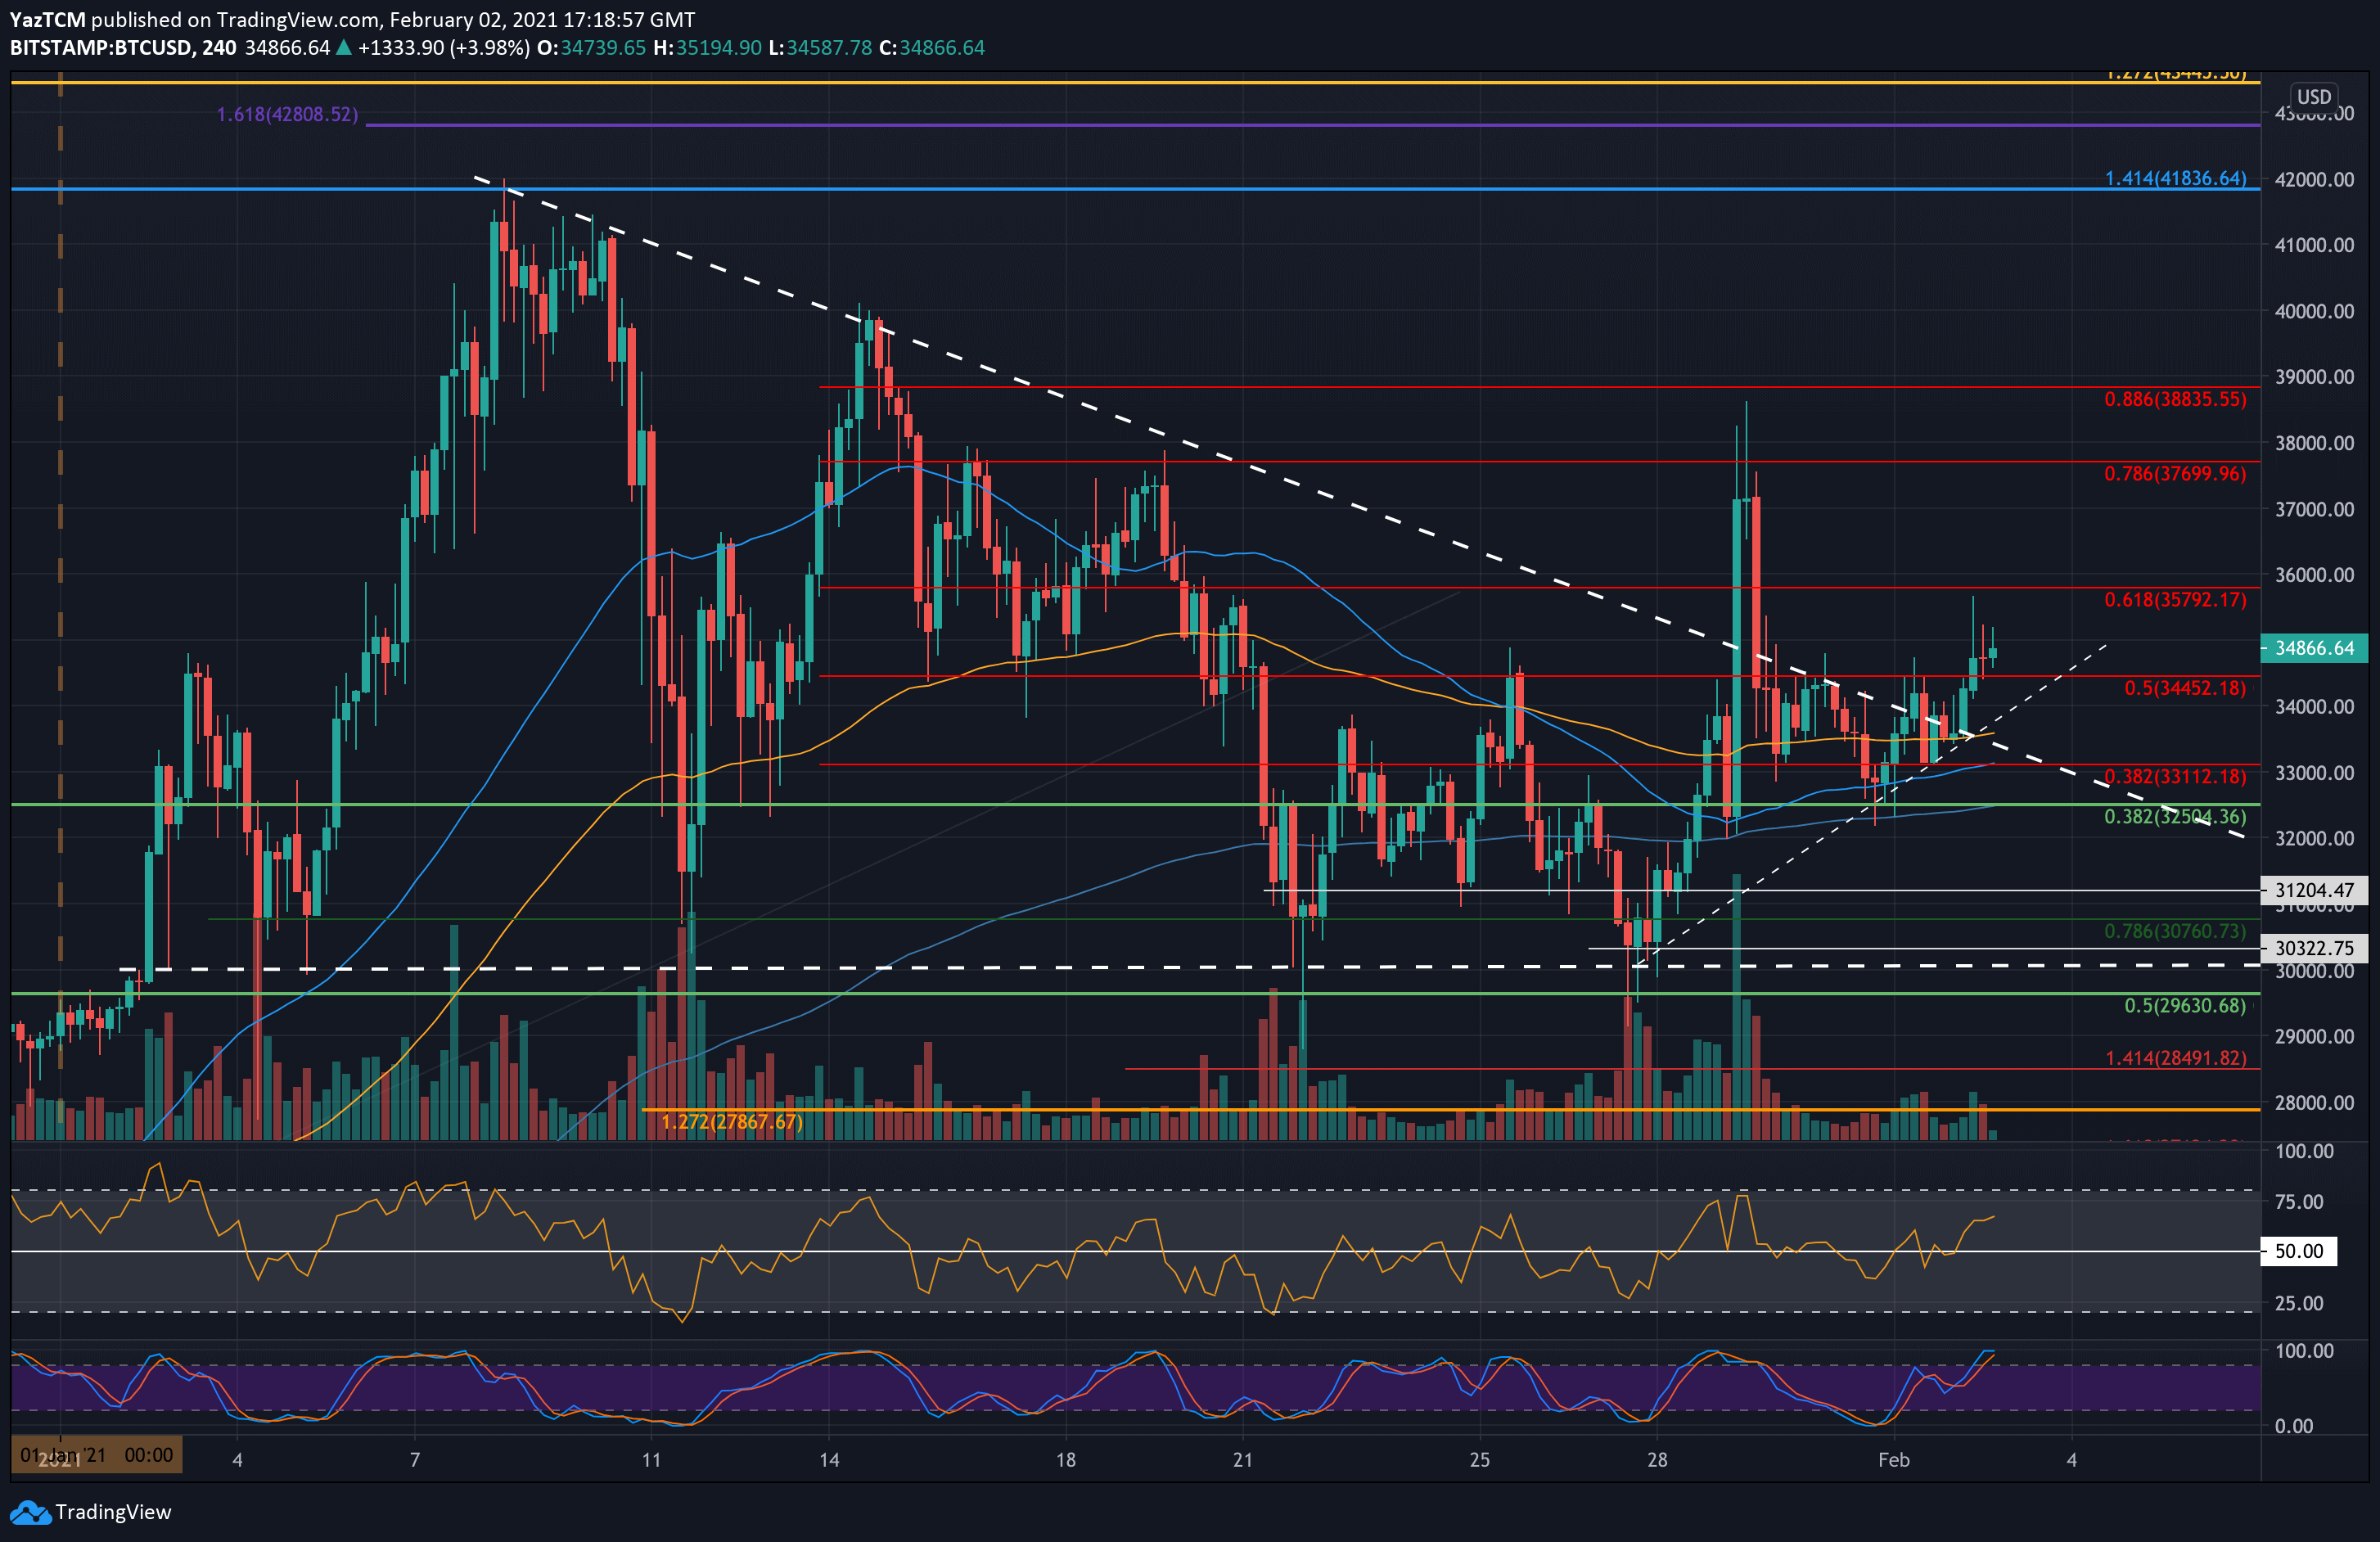
From there, Bitcoin started to trade below the upper angle of the triangle while maintaining support at $33,000 throughout the course of the past four days. It was also held by support at a short term ascending trend line, best seen on the 4-hour chart.
Today, followed the 4% price spike, Bitcoin broke the upper angle of the triangle. However, there are still a few more hours until the daily close, and so far, the trading volume had been minor.
Breaking above the triangle is the first step in Bitcoin’s path to a new all-time high, but this will be possible only if bullish volume comes.
Key Support Levels: $34,450, $34,000, $33,110, $32,500, $32,000.
Key Resistance Levels: $35,790, $37,000 – $37,150, $37,700, $38,620, $38,835.
Moving forward, the first level of resistance lies at $35,790 (bearish .618 Fib Retracement). This is followed by $37,000 – $37,151, $37,700 (bearish .786 Fib), $38,620 (Friday’s high according to Bitstamp), and $38,835 (bearish .886 Fib).
On the other side, the first support now lies at $34,450. This is followed by $34,000 (short term ascending trend line), $33,110 (50-MA), and $32,500 (.382 Fib Fib). Further support lies at $32,000 and $31,200.
The daily RSI is also supporting the bullish momentum; however, the volume is still missing.