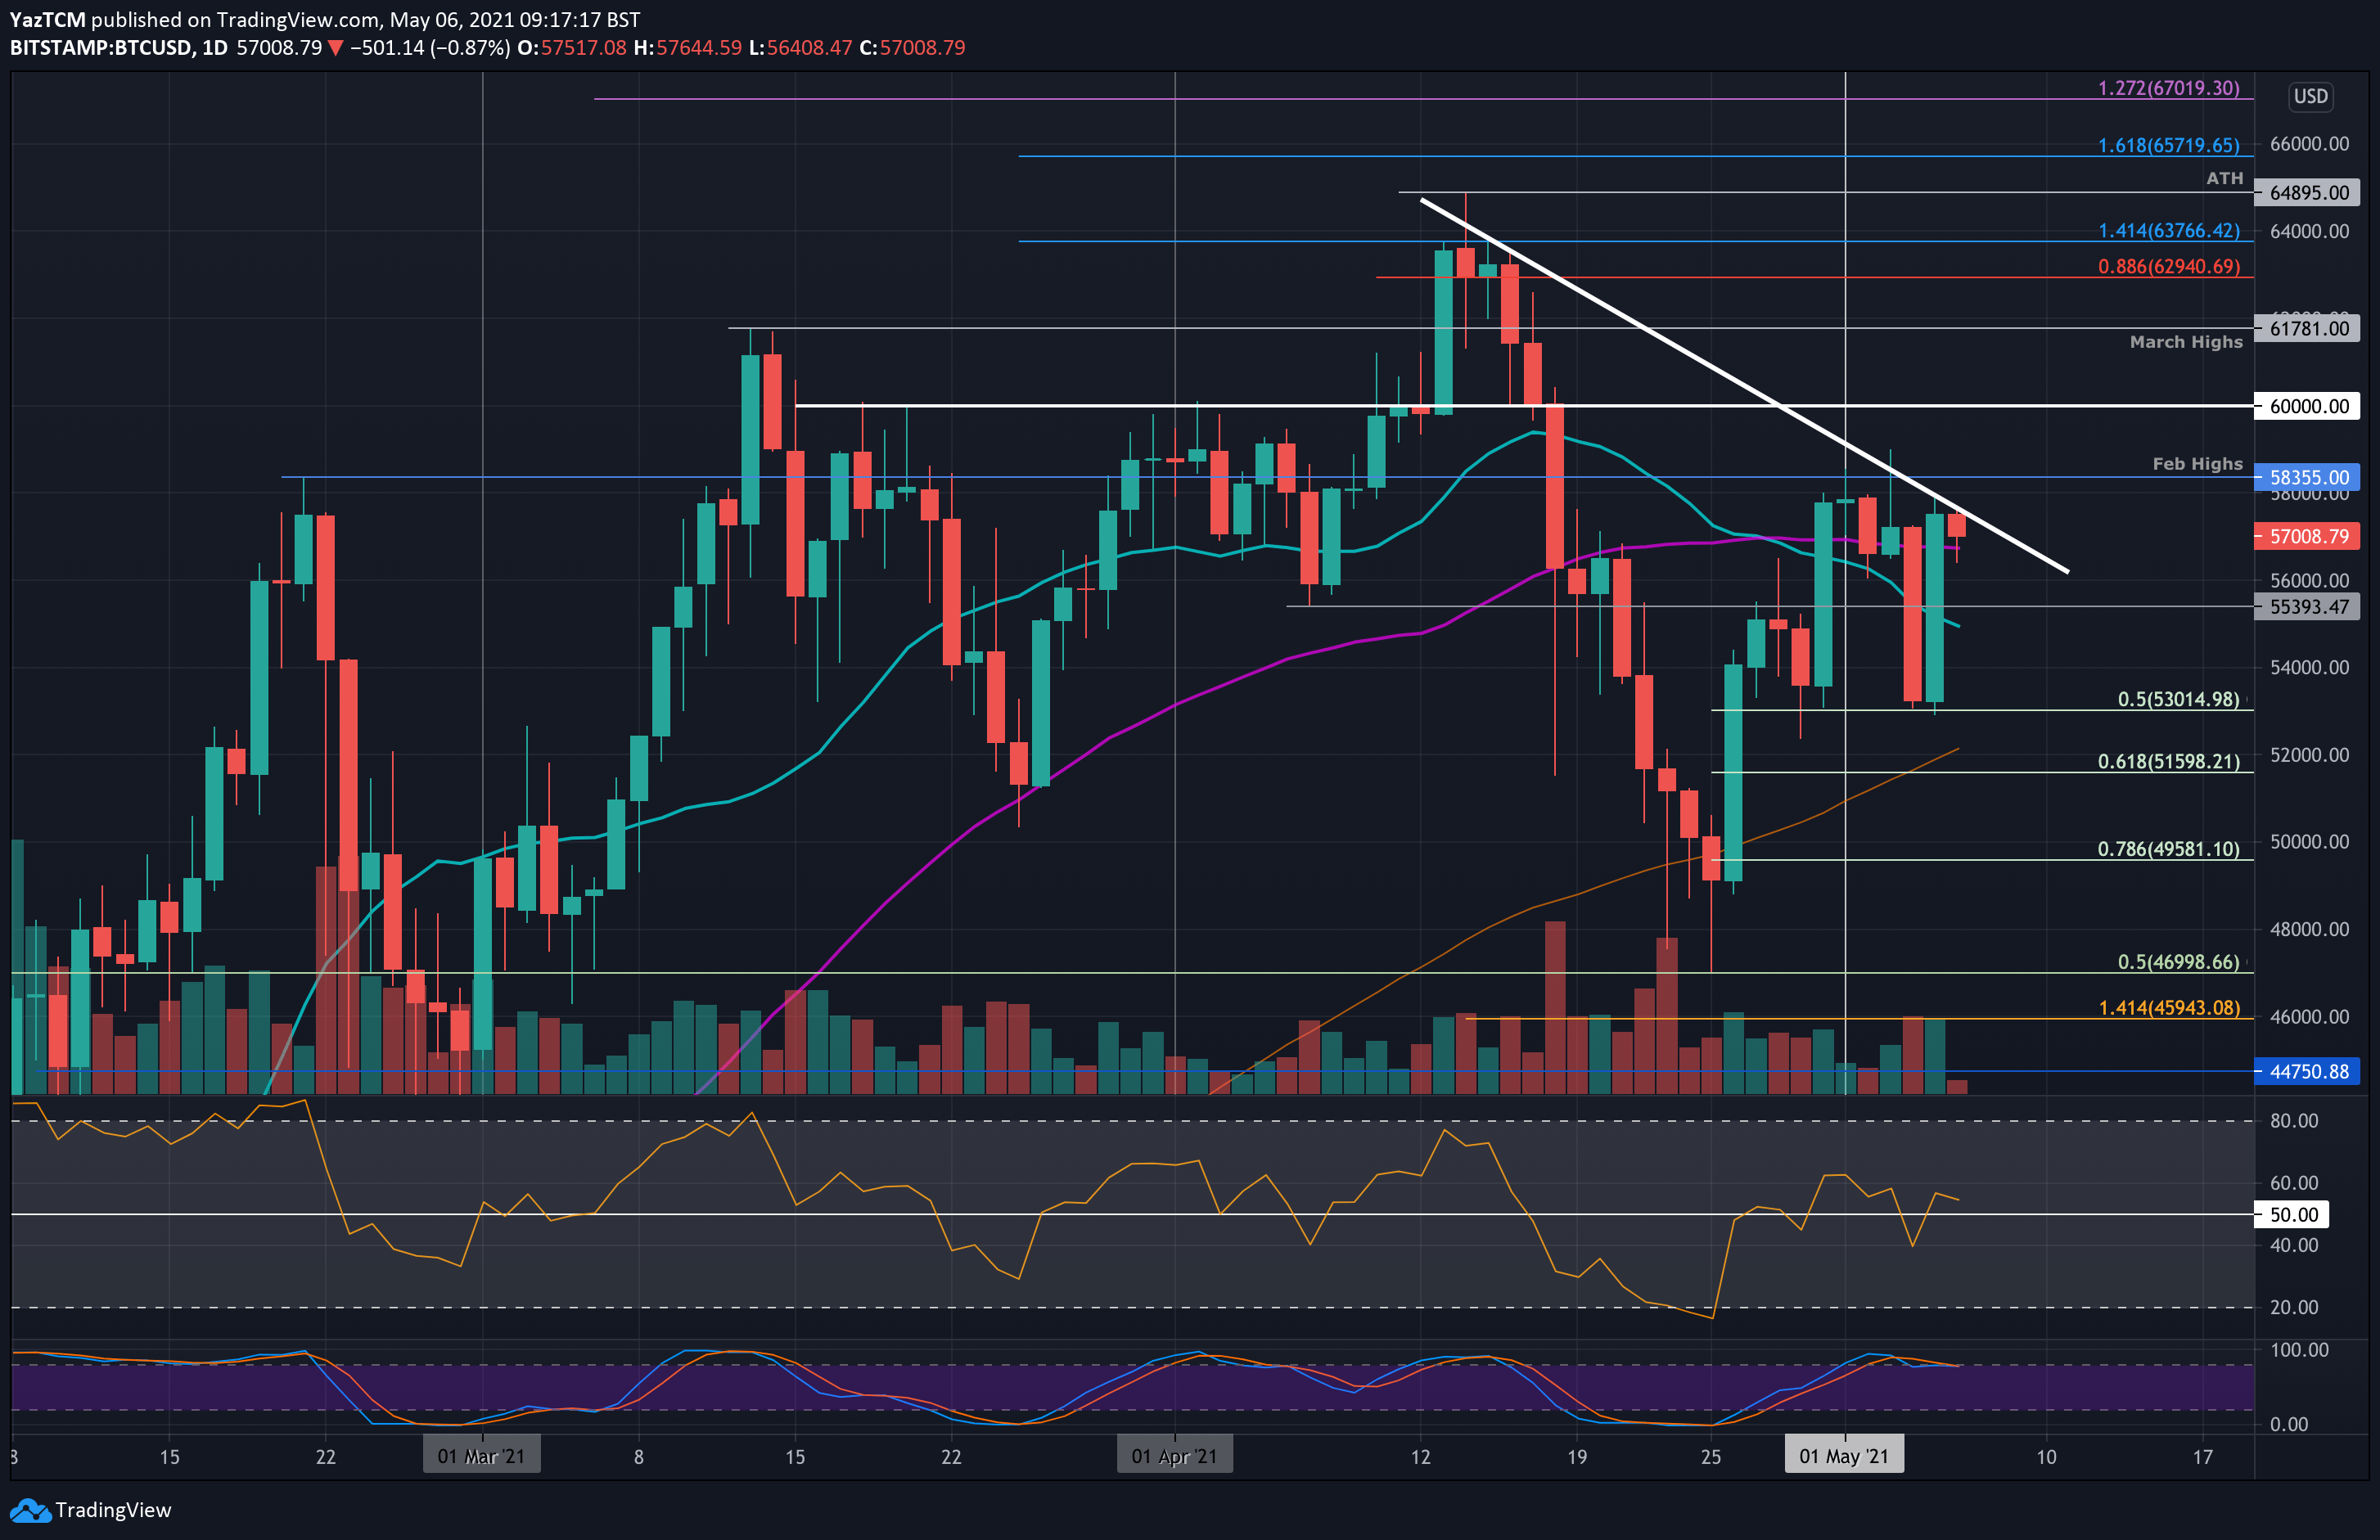
BTC/USD Daily Chart. Source: TradingView
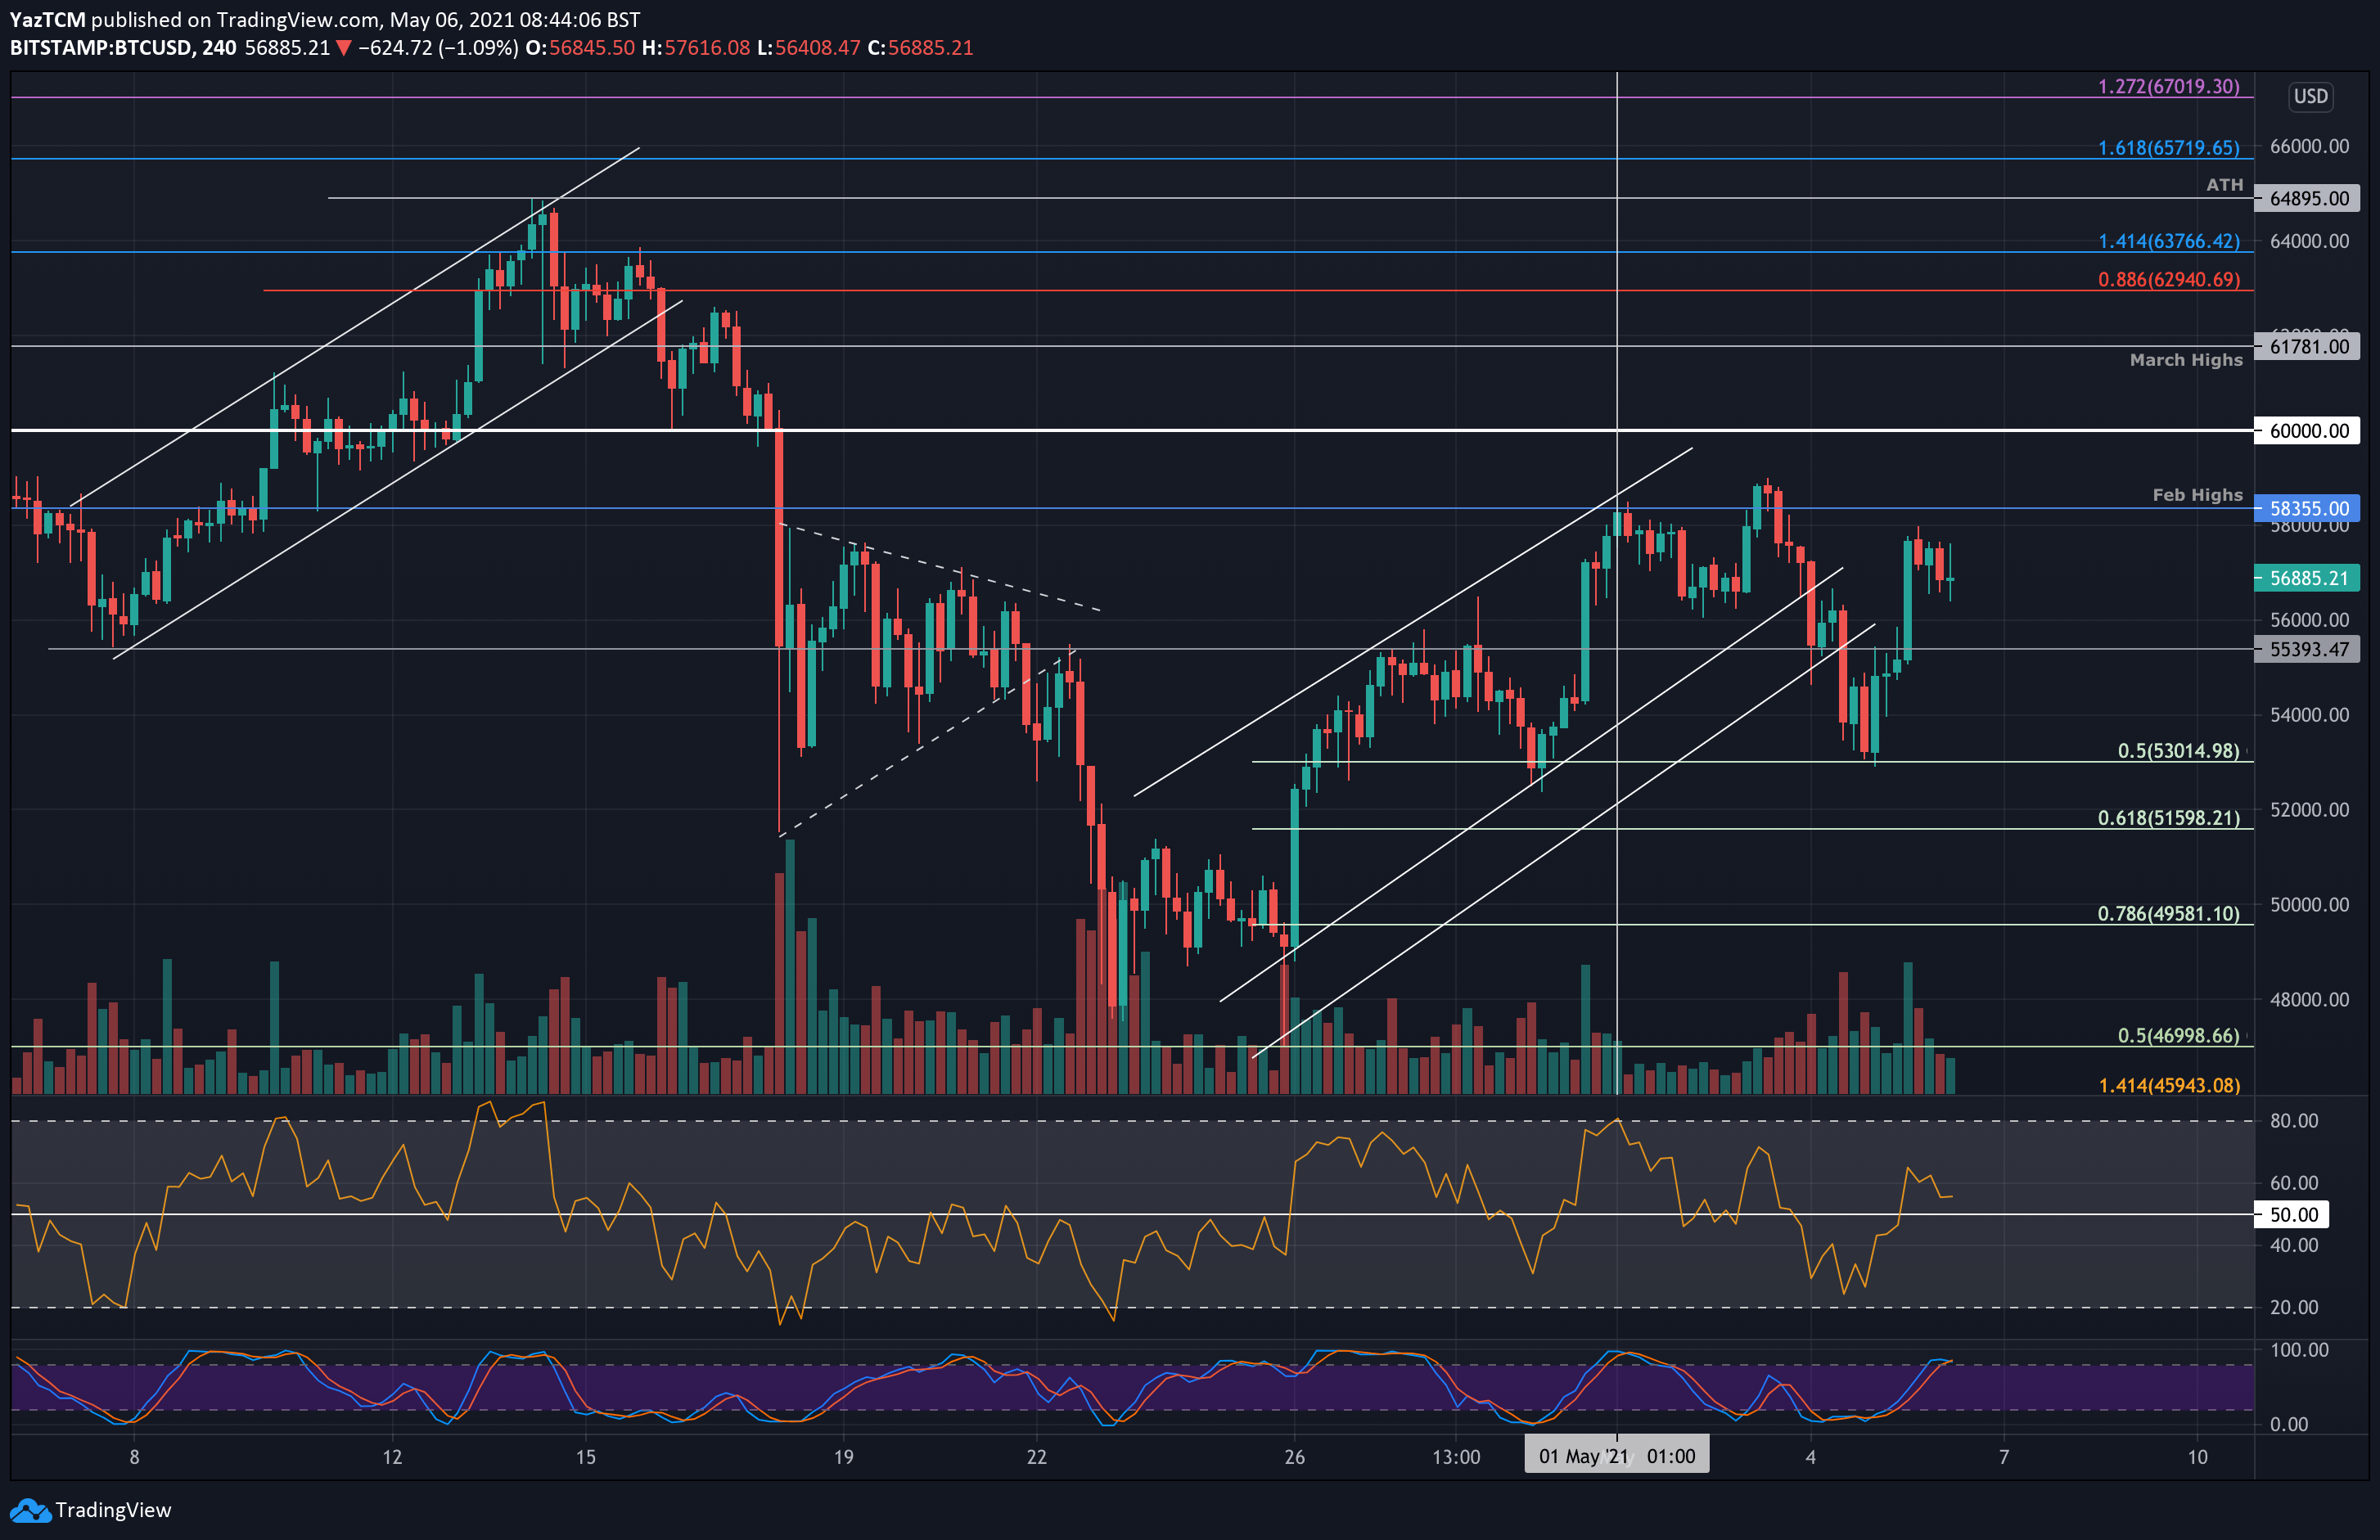
Bitcoin is up by a robust 4% today as it bounced from $53,000 to reach as high as $58,000 yesterday. It has since dropped slightly and is trading around $57,000.
Amazingly, over the past 2.5 months, bitcoin’s trading range is mainly between $50k and $60k. Yesterday’s high at $58k, together with the fact that BTC was unable to close a daily candle above it since mid-April, makes this the first major barrier for the primary cryptocurrency.
On Tuesday, bitcoin saw a sharp 7% price drop as it fell from $57,200 to reach as low as $53,000. It found support at a short-term .5 Fib Retracement, which allowed it to rebound to get as high as $58,000 yesterday.
The push toward $58,000 allowed bitcoin to break back above resistance at both the 20-days and reach the critical level where lies the 50-day moving average line. Over the past days, bitcoin was unable to get away from the MA-50 zone, which currently lies around the $56.8k area.
In addition to the above, bitcoin’s price also encountered resistance at a descending trend line that dates back to April’s all-time high levels and could not push above it. BTC must break this trend line if it would like to trade beyond $60,000 during May.
Key Support Levels: $56,750, $55,400, $54,950, $53,000, $52,000.
Key Resistance Levels: $58,000, $58,355, $60,000, $61,780, $62,940.
Looking ahead, the first support lies at $56,750 (50-days MA). This is followed by $55,400, $54,950 (20-day MA), $53,000 (.5 Fib), and $52,000 (100-day MA).
On the other side, the first resistance above the descending trend line lies at $58,000. This is closely followed by $58,355 (Feb 2021 Highs), $60,000, $61,780 (March 2021 Highs), and $62,940 (bearish .886 Fib Retracement).
The RSI is above the midline but is showing weak bullish momentum. To break back above $58,000, the RSI must start rising and make higher highs above 60 to indicate increasing bullish momentum in the market.