Two days ago, when everyone was bullish watching Bitcoin’s astonishing move breaking above the $9400 towards the $9800 in a matter of hours, we mentioned the importance of the $9800 level.
That level created another touch in the descending trend-line, which is marked yellow on both charts below. This was the ninth (!) attempt to break that tough resistance. Guess what? Nine attempts – zero success (aside from the fake-out on June 1st).
When you don’t score, the other team will. And when Bitcoin did not break, the way back down was just a matter of time.
Yes, we are back in the days when Bitcoin price and the markets go side by side. No decoupling at this moment.
Yesterday, Wall Street’s major indices crashed 2-3%, while Bitcoin crashed from the $9600 region, breaking down $9200, marking $9K as today’s low. Approximately $600 down in less than 24 hours.
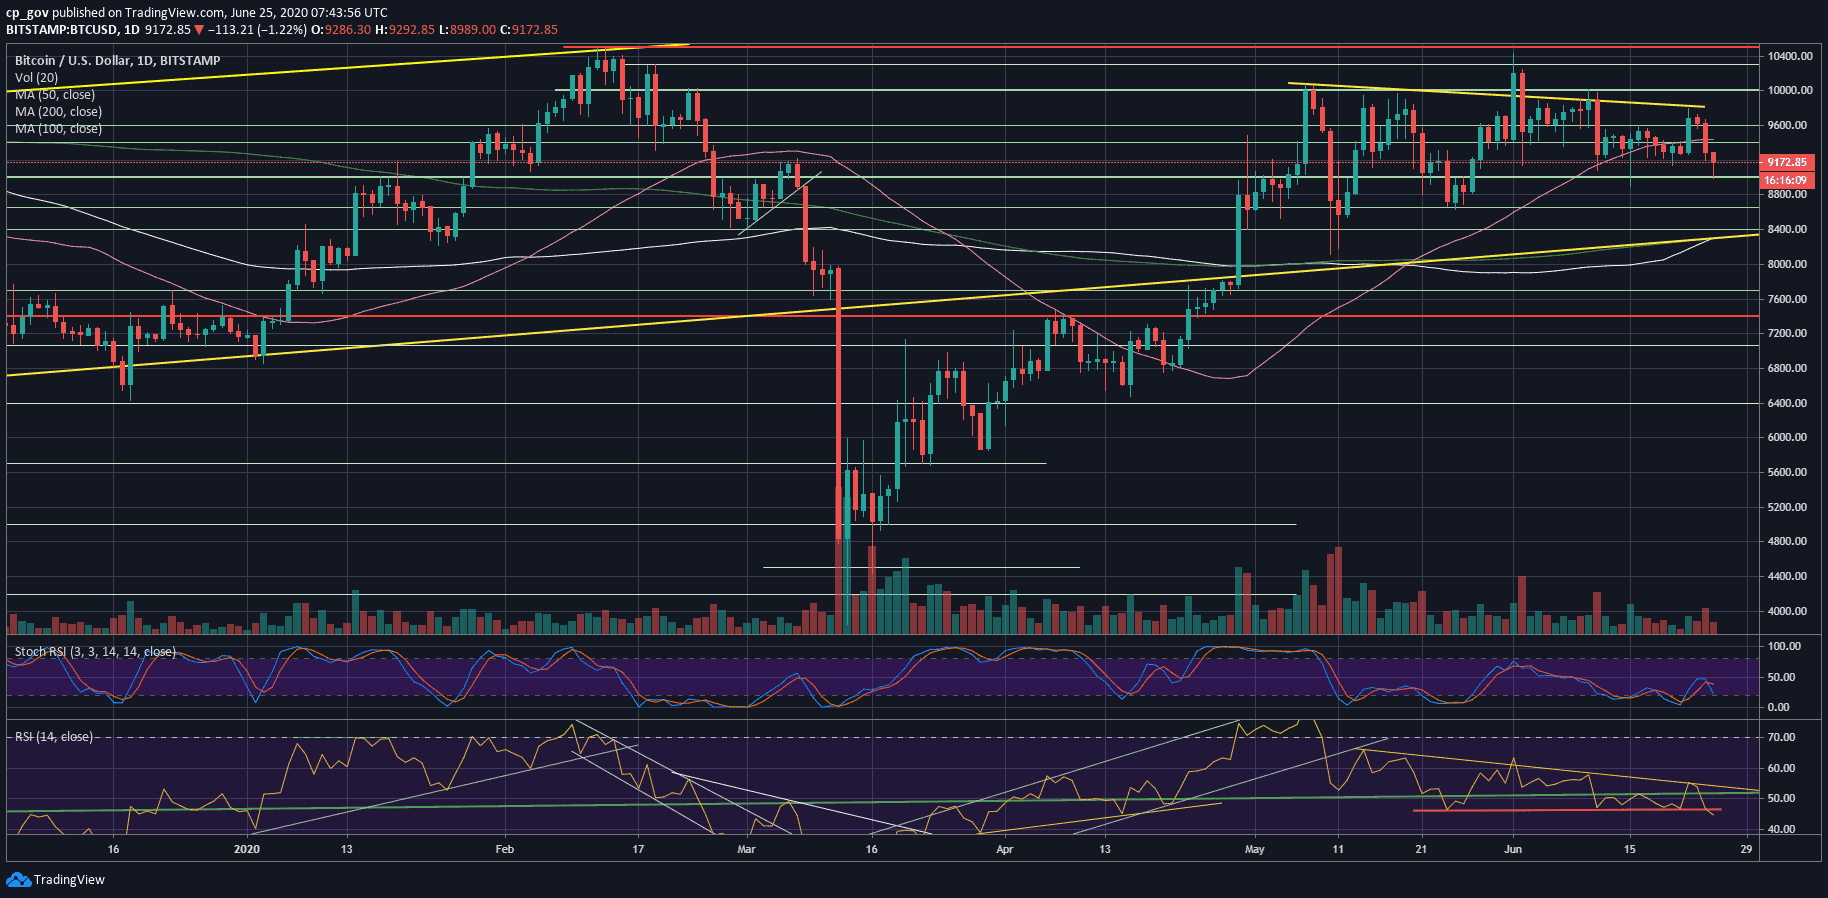
How bad is this collapse? Looking at the following daily chart, we can see a clear higher-low trajectory, which is textbook bullish.
The most recent low was $8900 on June 15. Bitcoin is getting remarkably close to that level once again. Breaking it, and the low $8K levels will likely come fast.
Looking at the indicators, the daily RSI is now at its lowest level since March 2020, breaking down the critical 50 level, and the red-defense line of 46.
Trading volume: Yesterday’s volume was the highest day since June 15. Yesterday’s bloody volume was higher than Monday’s surge. The sellers seem to be more serious, as of now. Overall, the total volume is declining continuously since the beginning of May.
As mentioned above, the critical level is the $8900 – $9000 region (along with the blue ascending trend-line on the 4-hour chart). A breakdown here and Bitcoin is likely to revisit good old support levels.
The next significant support from below is the May 25 low of $8650. Further below lies $8400 and $8250 – $8300 which contains both the 200 days moving average line (light green), the 100 days MA (white) and a long-term ascending trend-line (yellow).
From above, the first major support turned resistance level now lies at $9200. Further above is $9400 – $9450, which contains the 50-days MA (pink line). This is followed by $9600.
Total Market Cap: $261 billion
Bitcoin Market Cap: $169 billion
BTC Dominance Index: 64.4%
*Data by CoinGecko