What a recovery. Bitcoin is only a few steps away from a full recovery since the March 12 collapse, which took place only six weeks ago and saw Bitcoin plunging to $3600 (BitMEX).
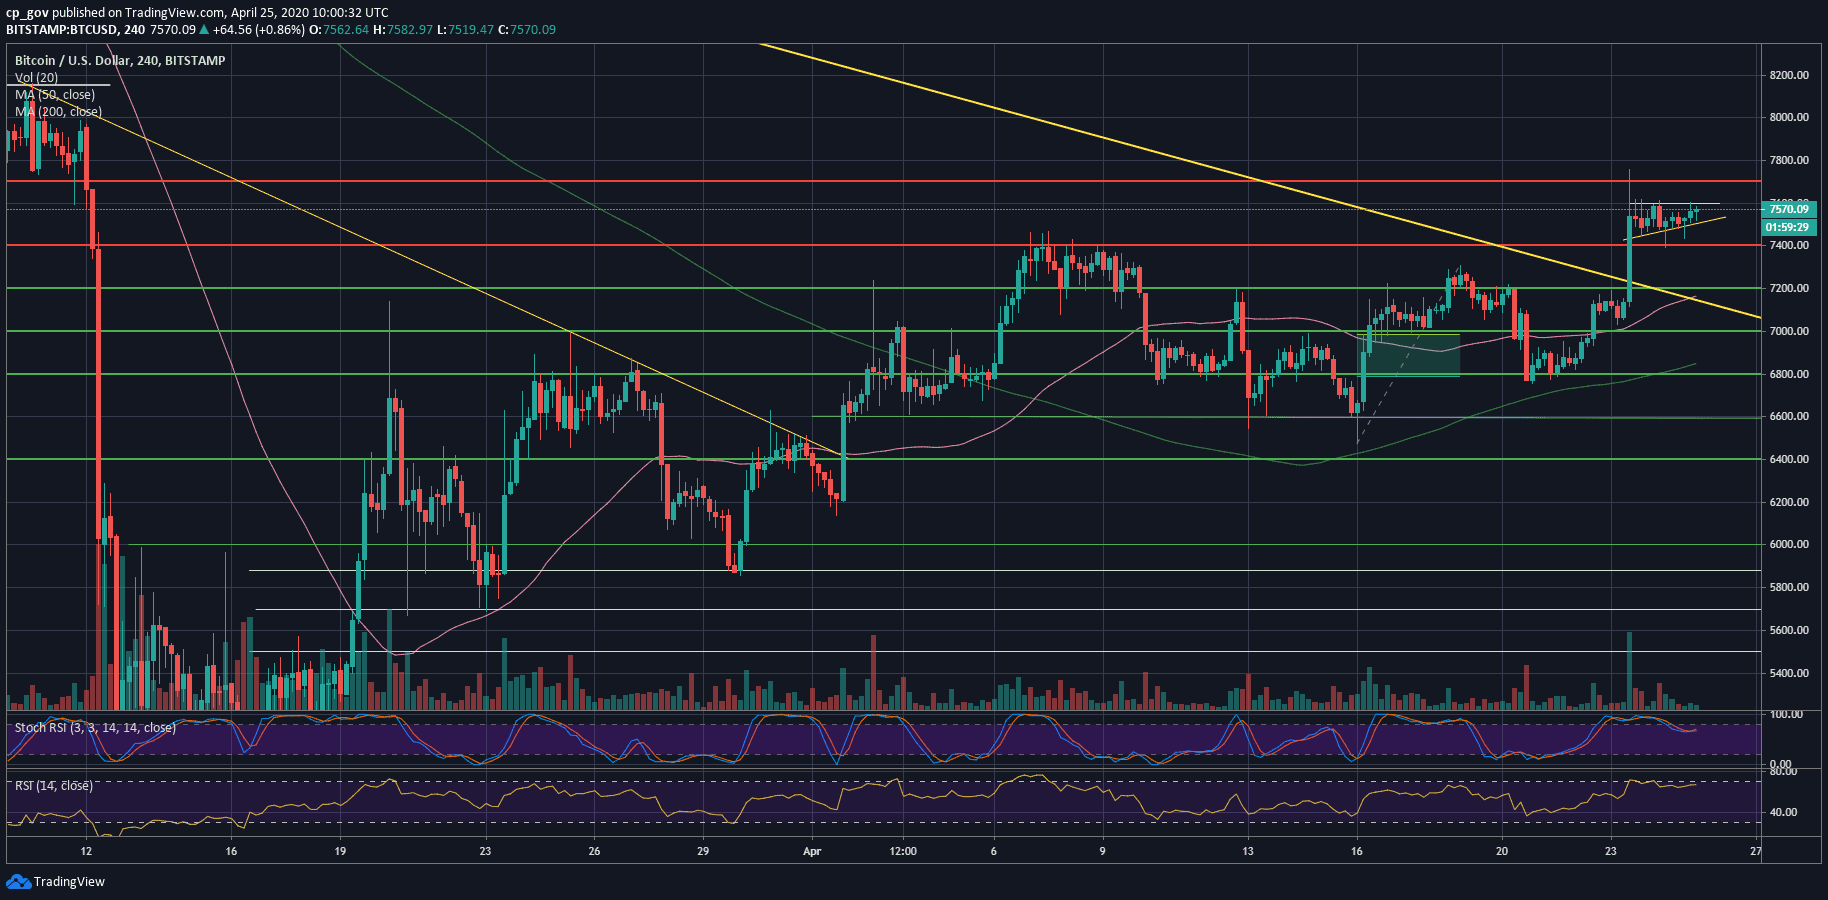
The primary cryptocurrency had recently broken above at $7230. On the following 4-hour chart you can notice the mid-term descending trend-line’s breakout.
Following the break, the 4-hour candle had wicked at $7750 (!), which was our highest mentioned target on our most recent price analysis.
Despite the wick, we can see that Bitcoin is forming a bullish triangle on the 4-hour chart. From above, the $7600 resistance, while below is the marked ascending trend-line.
Bullish triangles, just like their name, tend to break to the upside in most cases. In case of a bullish breakout, we can expect Bitcoin to quickly reach the target of $7750, which was the high from Thursday, and the highest level since the March 12 price crash.
From below, the most significant level to keep an eye on is $7400 – $7500, which is the level Bitcoin is trading at, as of writing these lines.
This is from our previous analysis: “The pattern will be invalidated in case Bitcoin breaks above $7300, together with the marked descending trend-line, and also confirms it as support.”
We must say that so far, Bitcoin does this exactly.
Total Market Cap: $218.5 billion
Bitcoin Market Cap: $139.1 billion
BTC Dominance Index: 63.7%
*Data by CoinGecko
– Support/Resistance levels: As mentioned above, Bitcoin is currently trading on top of the $7400 – $7500 resistance turned support area.
From above, the first level of resistance now lies at $7600 (the bullish triangle on the 4-hour chart). In case of a breakout, the next destination is likely to be $7750 (the monthly high).
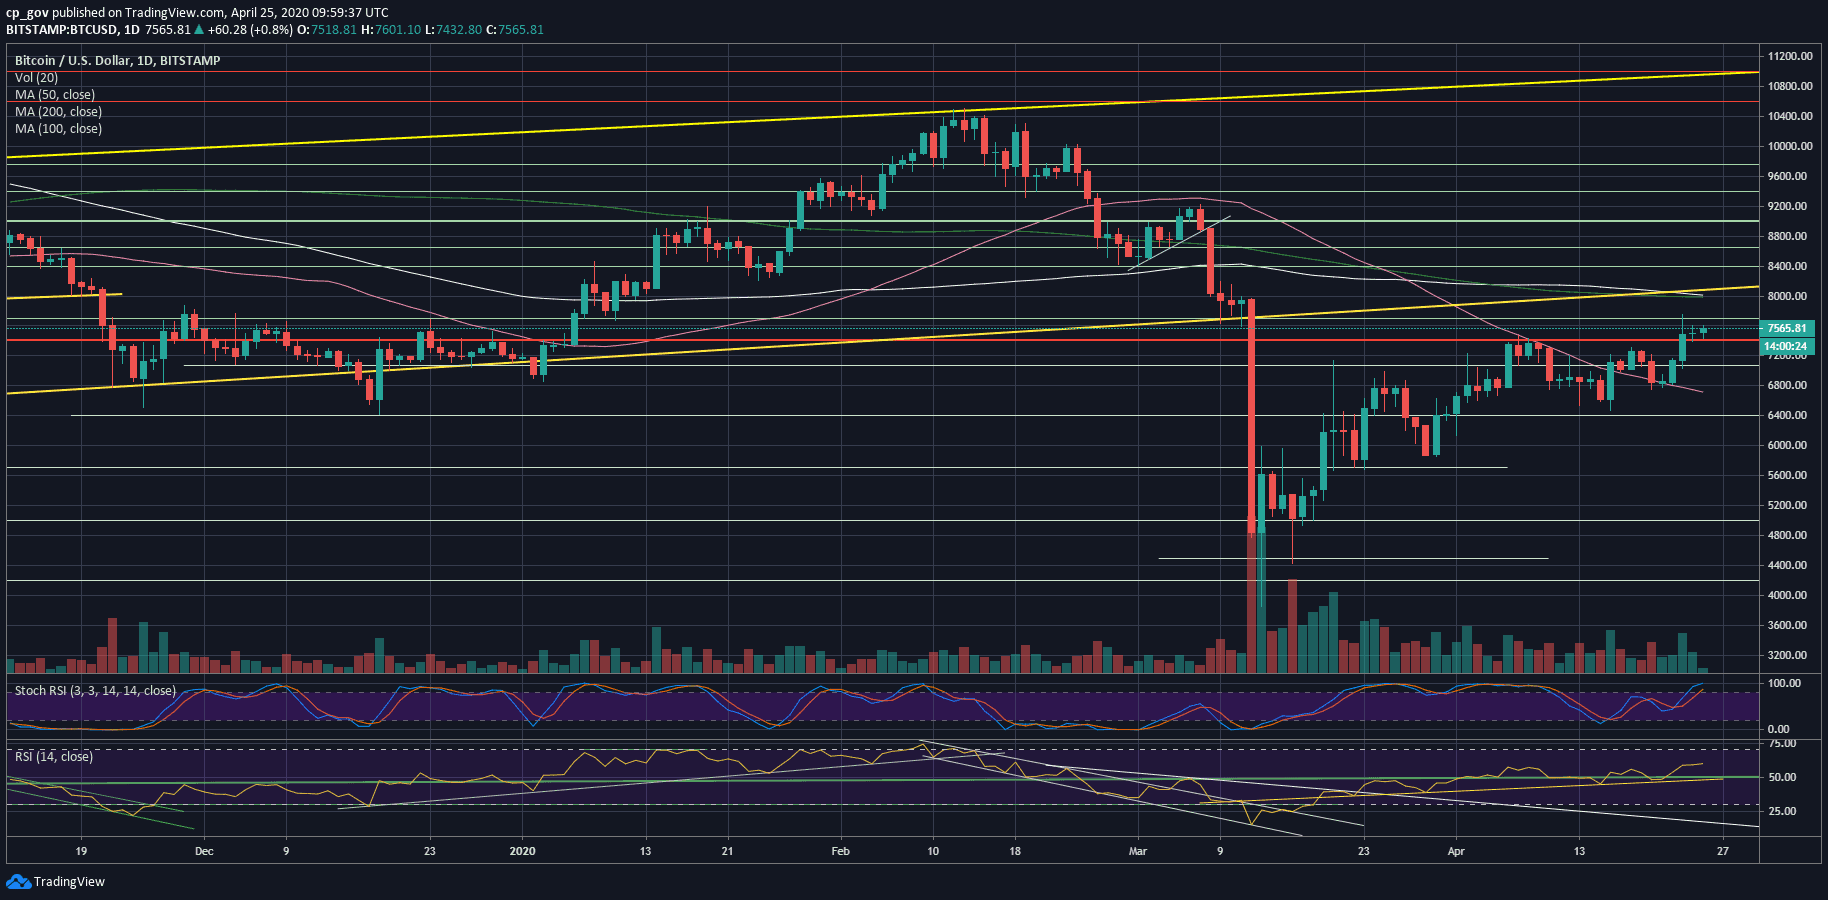
Further above lies the major resistance area of $8000, which includes the psychological benchmark level, a long-term ascending trend-line (started forming a year ago), and both the 100 and the 200 days moving average lines – marked white and light green respectively on the following daily chart. This level will also declare a full recovery since the March 12 collapse.
However, from below, in case the $7400 level breaks down, then we can expect slight support at $7300, followed by $7200. Further down lies $7000 and the 50-days moving average line (pink), which hovers around $6800.
– The RSI Indicator: Following the price breakout, the momentum indicator – the RSI, finally moved away from the indecisive level of 50 to the bullish region.
The indicator is currently facing the 60 levels. This is the highest level of the RSI since February 18 (Bitcoin above $10,000), which is quite optimistic and promising (as of now).
– Trading volume: Thursday’s volume candle was the weekly highest. However, we still miss the substantial volume levels that were reached during March.