BTC/USD chart via Tradingview
Bitcoin bulls have managed to regain some of the lost ground from the heavy 10% correction that took place between Friday and Saturday, November 6-7.
The crash coincided with BTC failing to break above the psychological $16,000 – a level not seen January 8, 2018 – and the heated 2020 US Presidential election drawing to a close.
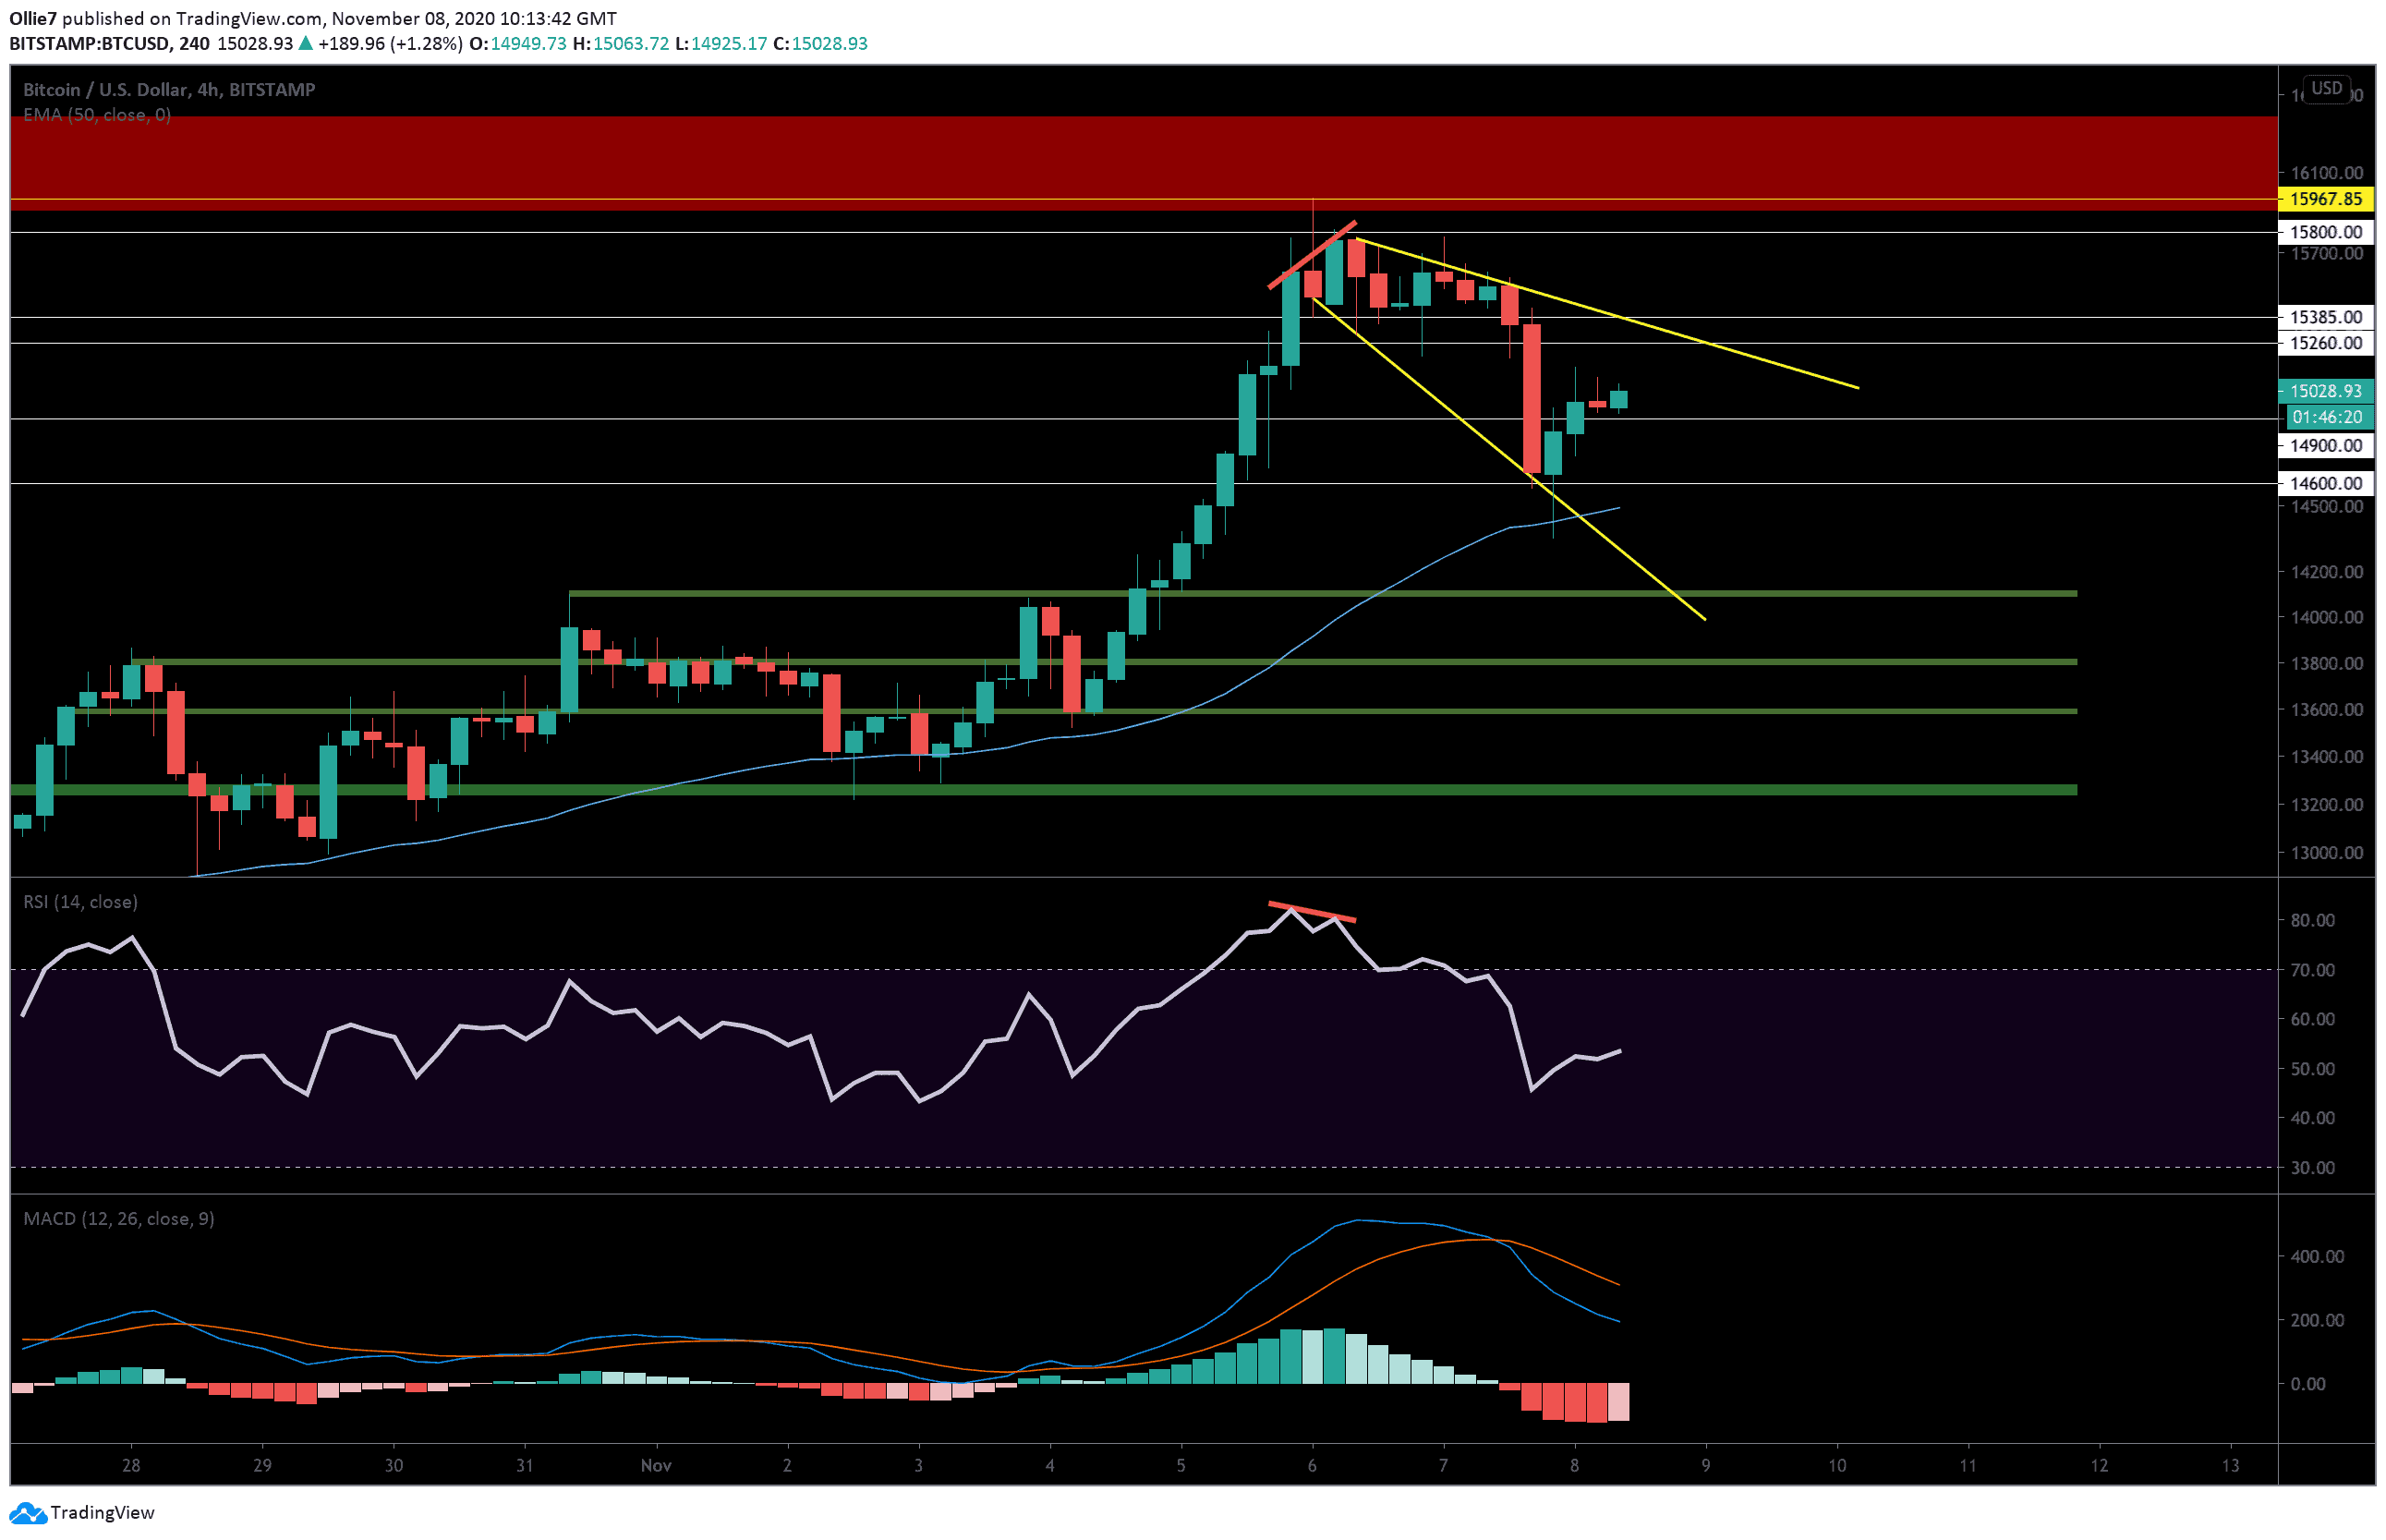
Looking at the following 4-hour chart, we can see that a very subtle divergence on the RSI (red lines) showed the surging uptrend was weakening and accurately foreshadowed Bitcoin’s bearish reversal.
On the global market capital chart, we can also see that investment entering the crypto market in the last 15 hours has flattened significantly and is ranging around $435 billion. This suggests there is still a great deal of uncertainty in the current market that could push prices sideways in the short-term.
On the 4-hour BTC/USD chart, it appears as though Bitcoin is now in a descending broadening wedge pattern between two sloping trend lines. To confirm this, however, we need to see a clear reaction at the resistance (yellow line) that sits roughly around the $15,300 area.
Other resistances standing in the immediate way of BTC’s progress right now include the order block level at $15,150 and the $15,385. If these levels are overcome, then we have the 4-hour close high at $15,750 and psychological $16,000 to contend with.
A second failed attempt to close above the $15,750 could result in a bearish double top and cause prices to depress again, so it’s important that momentum is strong leading up to the retest.
Looking south, we have a range of potential short-term supports that could help prop bitcoin’s price up against further decline, including the key daily level at $14,900, $14,600, and the 50 EMA (blue) at $14,495.
Should bears succeed in dominating these levels, then we have a major support zone between the $14,100 and $14,000 level (first green shaded area) which should receive a strong bullish reaction.
On the MACD indicator, we can see that volume has flipped bullish for the first time in the last 20 hours and the RSI is also climbing well. Overall, it seems that momentum is favoring bullish traders right now but it all hangs in the balance of whether they can hold on to the $15,000 level until the close.
Total market capital: $440 billion
Bitcoin market capital: $278 billion
Bitcoin dominance: 63.2%
*Data by Coingecko.