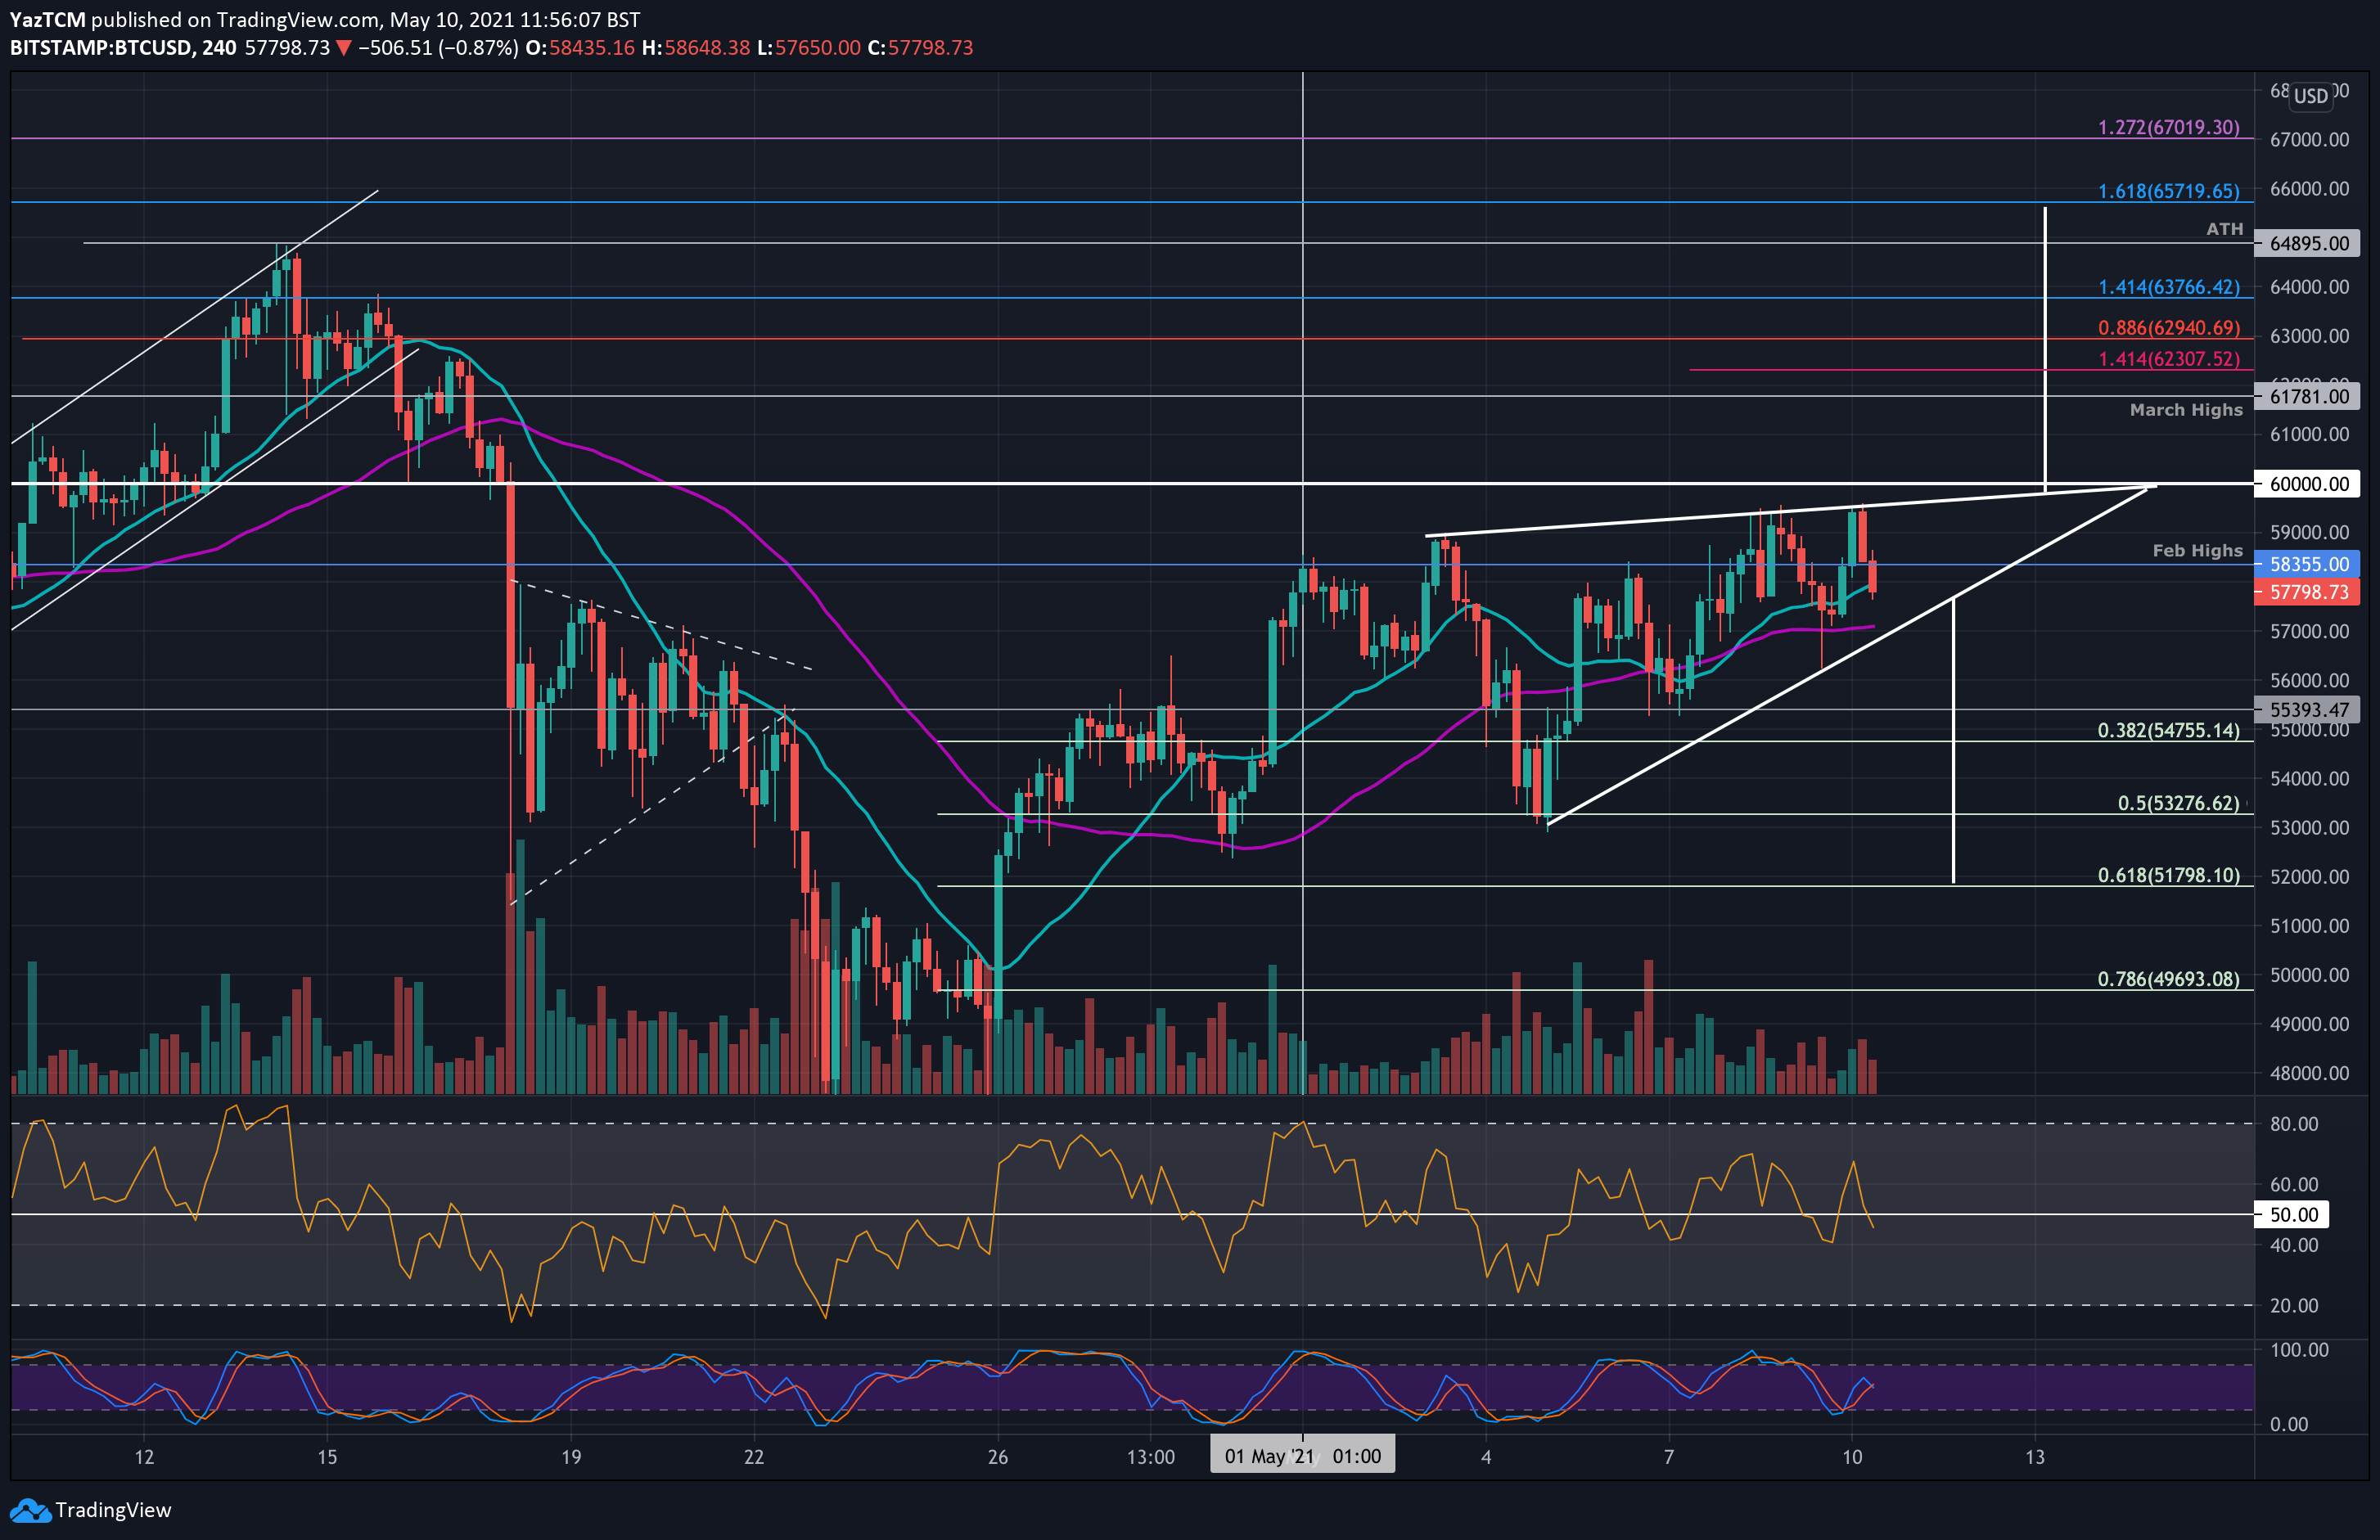
BTC/USD 4-Hour Chart. Source: TradingView
After reaching today’s high of $59,600 according to bitstamp, Bitcoin reversed back into the rising wedge it is currently trading inside as can be seen on the following 4-hour chart.
BTC performed well over the weekend as it broke above a descending trend line on Saturday, and climbed above the Feb 2021 highs of $58,355, however, yesterday’s daily close was below the significant resistance area.
As mentioned above, today’s current high is the upper boundary of an ascending wedge pattern – best seen on the short-term 4 hours chart below.
The current short-term wedge will need to be resolved in the next few days, however, a breakout toward the upside hands BTC a target price of the pole’s size, which will be around the current all-time high level of $65,720.
On the other hand, a breakout toward the downside would see BTC heading to $51,800 (.618 Fib and 20-days MA), before a possible retest of April’s lows around $46K – $47K.
Key Support Levels: $57,000, $56,765, $55,000 – $54,755, $54,000.
Key Resistance Levels: $58,355, $59,600 – $60,000, $51,780, $62,300, $62,960.
Looking ahead, if the bulls can climb back above the February highs at $58,355, the first resistance lies at the upper boundary of the wedge around today’s highs of $59,600. This is closely followed by the $60,000 milestone.
Beyond $60,000, added resistance lies at $61,781 (March previous all-time high), $62,300 (short term 1.414 Fib Extension), $62,960 (bearish .886 Fib), and $63,770 (1.414 Fib Extension).
On the other side, the first support lies at the lower boundary of the wedge at around $57,000. This is closely followed by the significant 50-day moving average line at around $56,765. Further down lies $55,000, $54,755 (.382 Fib), and $54,000.
The 4-Hour RSI is beneath the midline, and the daily RSI is producing hints of bearish divergence, which could be signaling a potential bearish price action in the next short-term.