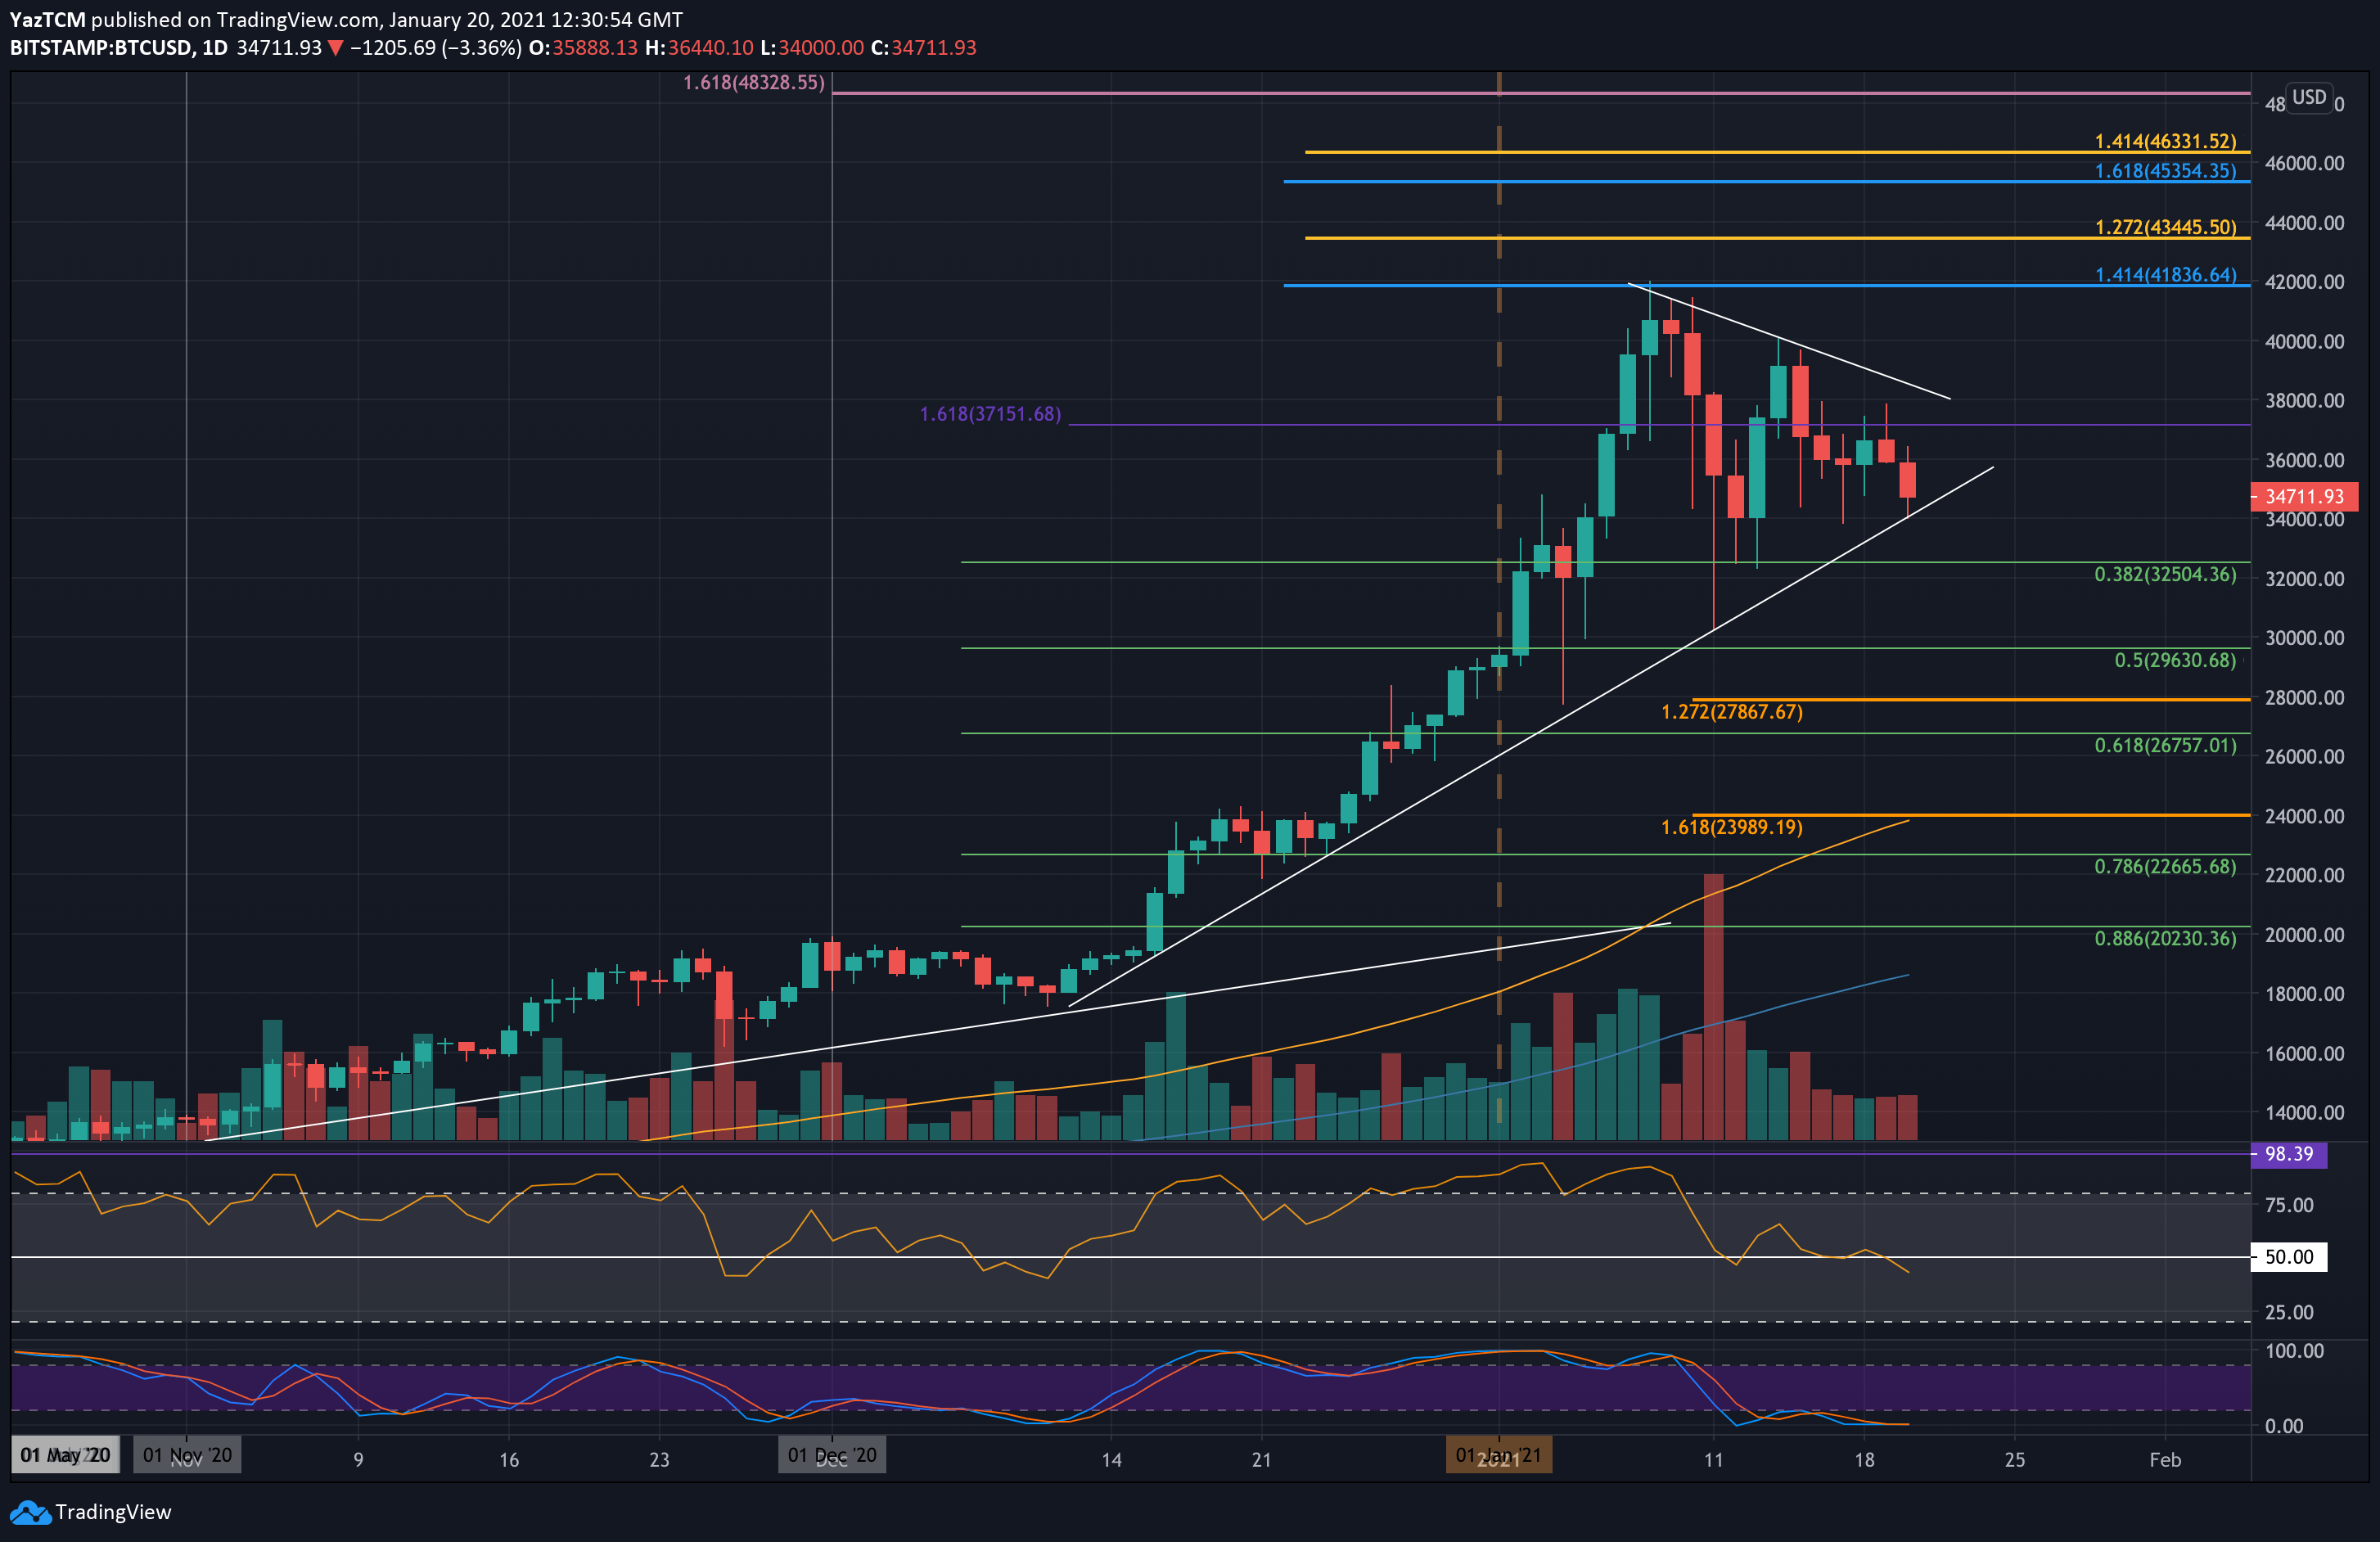
BTC/USD Daily Chart. Source: TradingView
Bitcoin saw a sharp 8% price plummet over the past 24 hours as it lost almost $4K from its value in just one day. As of writing these lines, Bitcoin found support around $34,000, which is also the lower boundary of the symmetrical triangle pattern we mentioned here yesterday.
BTC has been trading within this pattern since reaching the current ATH at $42,000 on January 8, 2020. Since then, we saw triangle consolidation for the past 12 days.
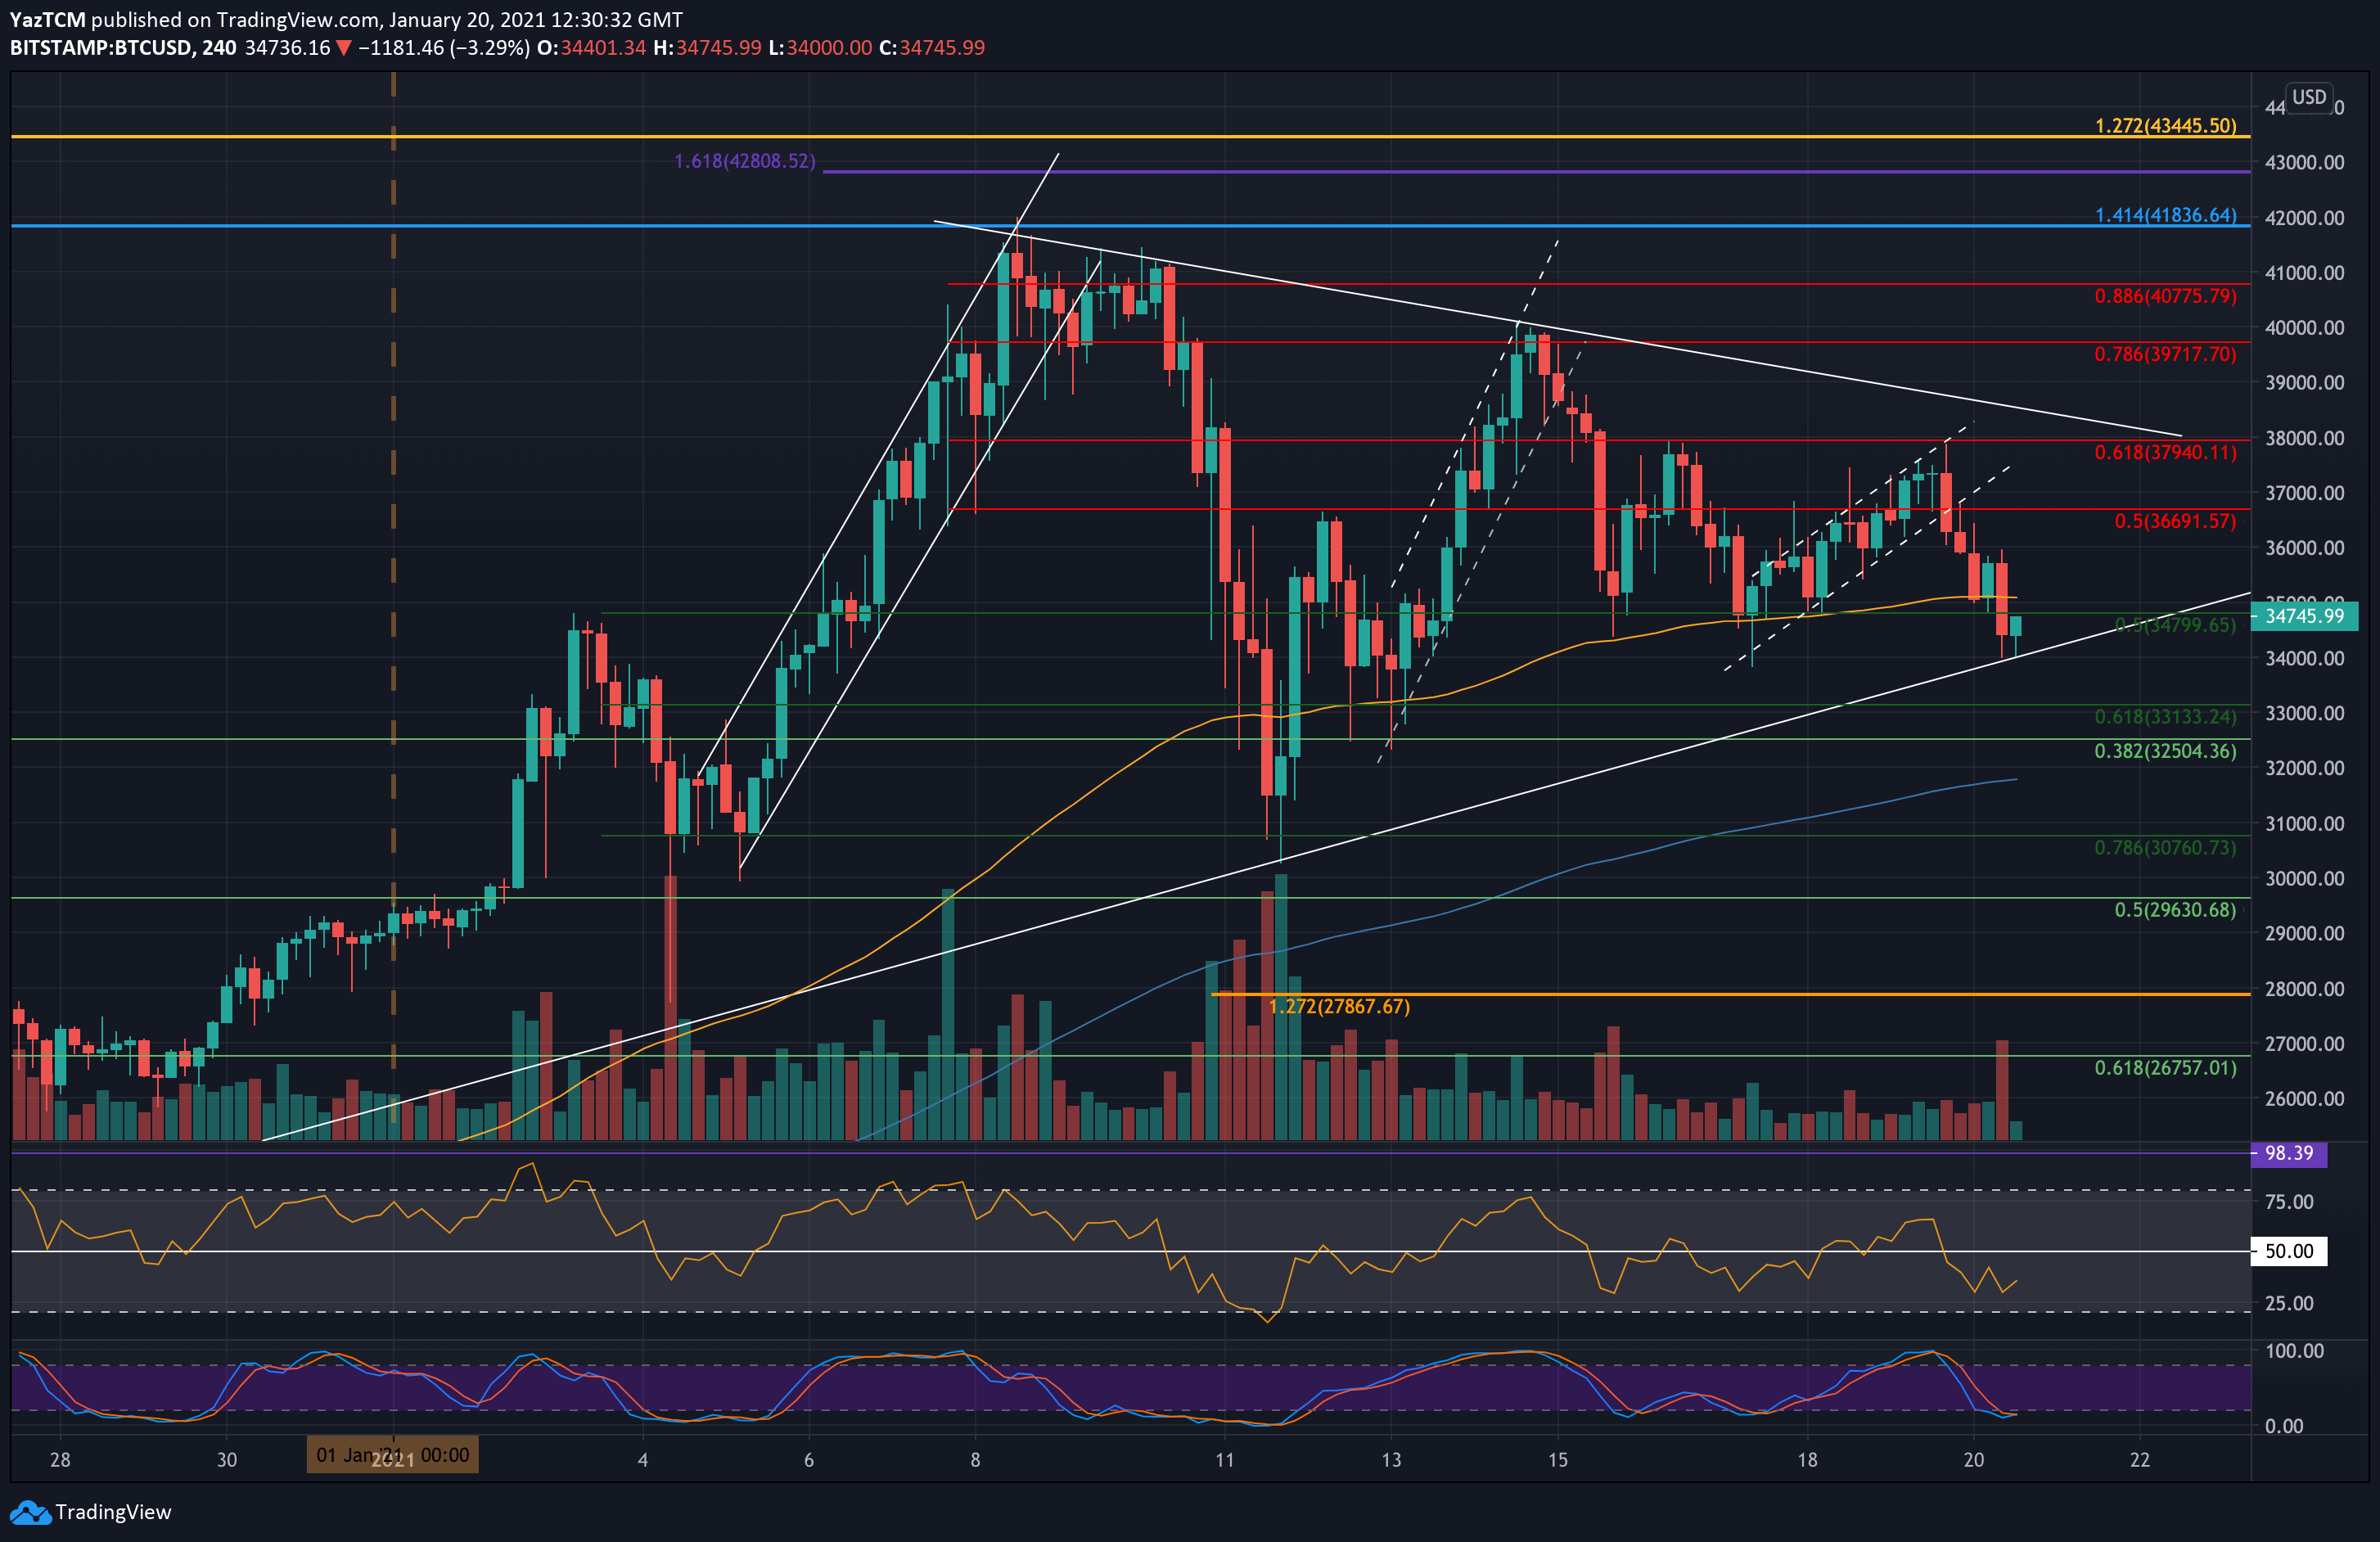
It tried to push higher at the start of the week after rebounding from support at $34,800 (short term .5 Fib Retracement) over the weekend. BTC managed to reach as high as $37,940 yesterday, which marked another ‘touch’ at the triangle upper angle but could not overcome the resistance provided by a bearish .618 Fib Retracement level.
As a result, Bitcoin reversed, and over the past hours, it had broken beneath a short-term rising price channel and retested the lower angle of the triangle at $34,000. The latter is today’s current low, according to Bitstamp.
As mentioned here yesterday, a breakout from the triangle boundaries is likely to occur during the next hours or few days. This is likely to initiate a major move in the breakout’s direction. As of now, it seems like the bears are closer to the finish line.
Key Support Levels: $34,000, $33,133, $32,500 – $32,000, $30,760, $30,000.
Key Resistance Levels: $34,800, $36,000, $36,690, $37,940, $38,300.
Looking ahead, if the market falls beneath the triangle lower angle’s support at $34,000, the first level of support beneath lies at $33,133 (short term .618 Fib). This is followed by $32,500 (.382 Fib), $32,000, and $30,760 (short term .786 Fib), shortly before reaching $30,000 which is last week’s low.
On the other side, the first level of resistance lies at $34,800 (previous support, and the price that BTC is currently trading). This is followed by $36,000, $36,690 (bearish .5 Fib), $37,940 (bearish .618 Fib, yesterday’s high), and the upper border of the triangle around $38,300.
The RSI is showing a troublesome signal after it falls beneath the midline, indicating that the bears have taken control of the market momentum, as of now.