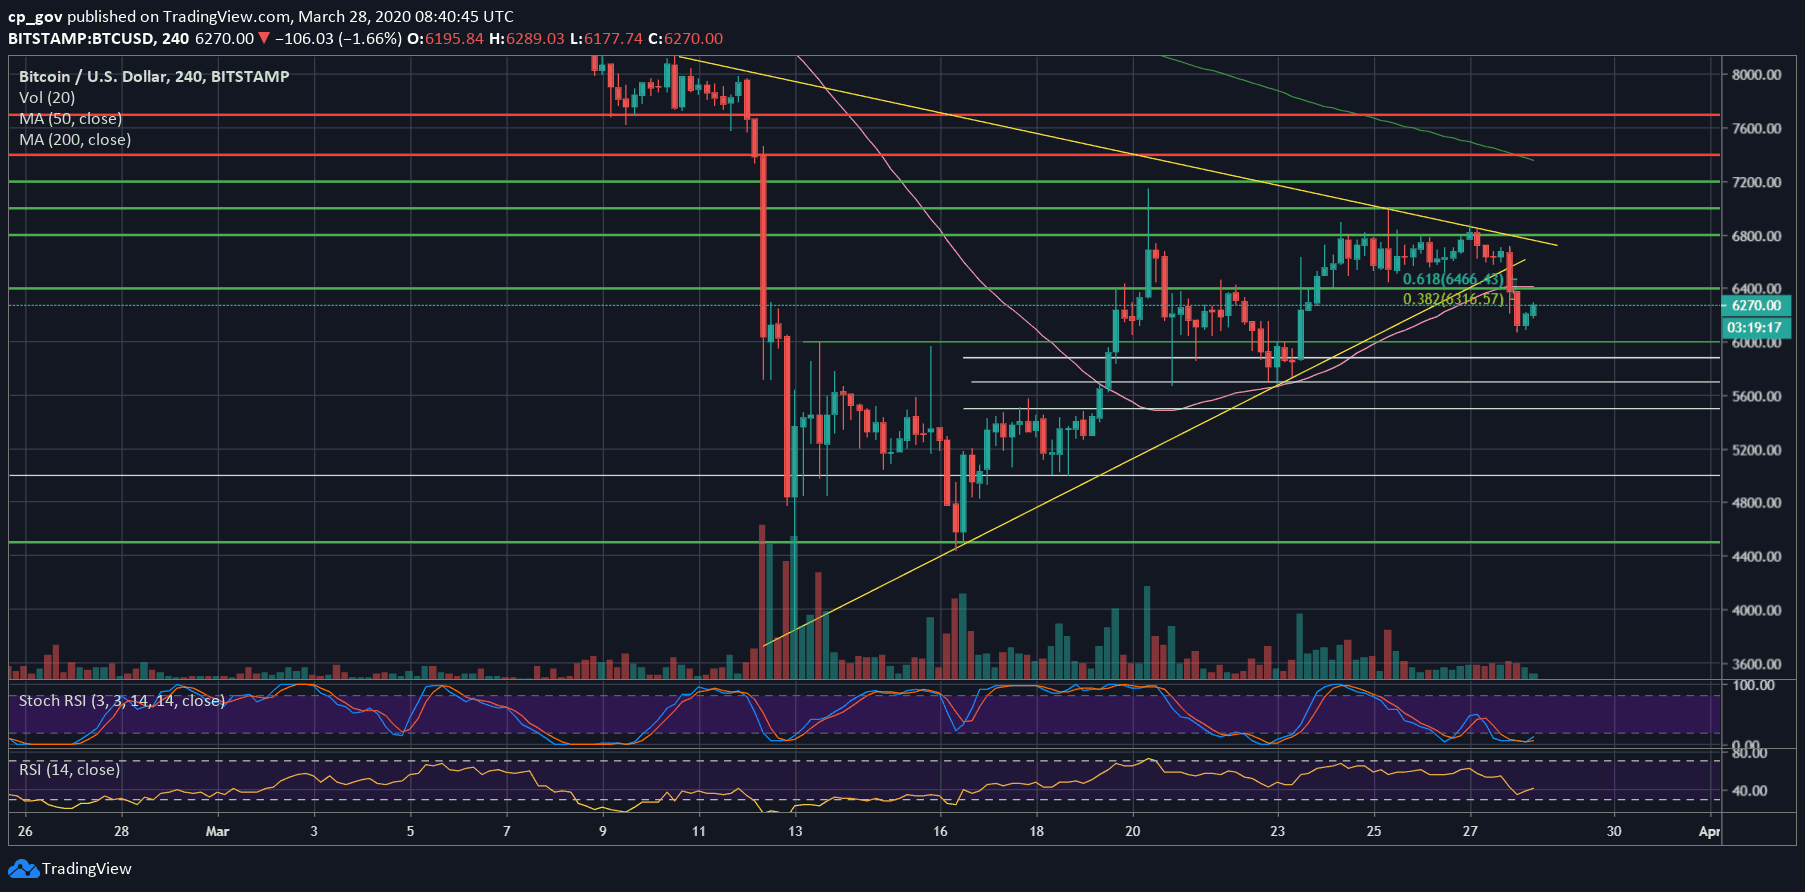
After three days of dull price action inside a $200 range ($6600 – $6800), Bitcoin saw a huge plunge back to the $6000 area, more than 10% were lost in a matter of hours.
If you followed us here, we mentioned reasons why Bitcoin was looking more bearish than bullish, and we also stated that once a breakdown takes place, it will hurt.
These reasons include the double-top bearish formation, the symmetrical triangle on the 4-hour chart, the declining trading volume, and most importantly, the daily RSI indicator. Even the analysis title was “Double Top Could Send BTC Below $6000 Very Soon.”
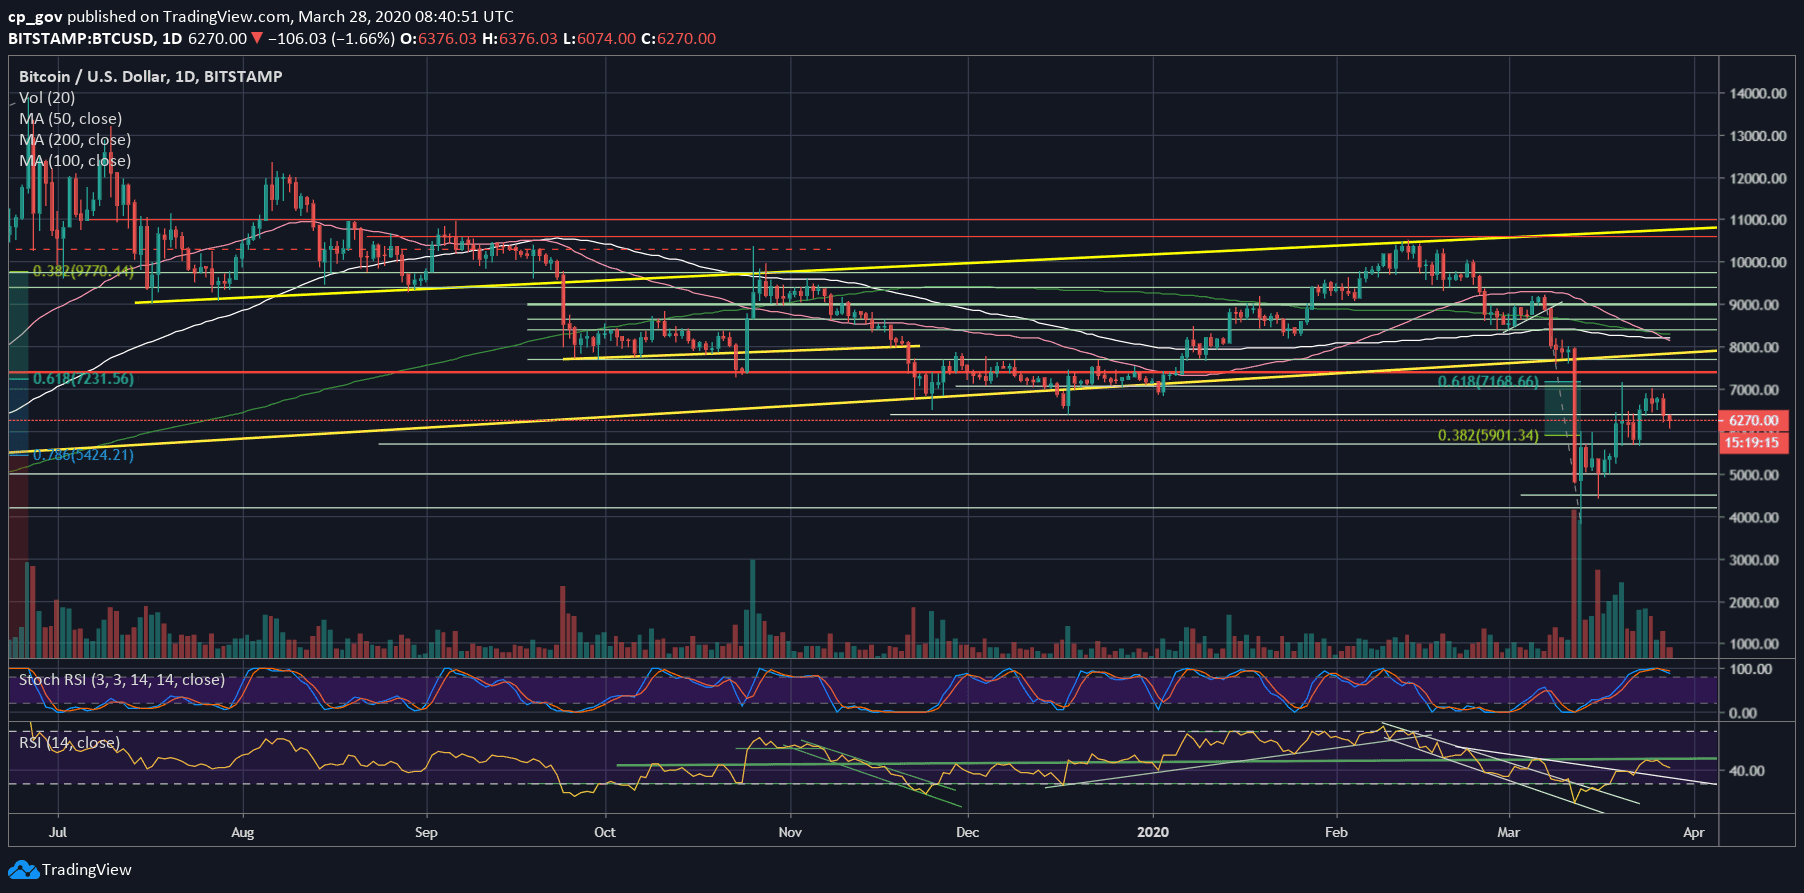
Looking on the charts, Bitcoin bottomed at $6074 (Bitstamp), as of now. Since then, we see a slight recovery; however, this might not last for long.
Bitcoin is going through its first global financial crisis these days, following the COVID-19 outbreak. Bitcoin was born as a lesson after the 2008 Sub-Prime financial crisis.
So far, Bitcoin disappoints its supporters, while it was correlating with the global markets.
However, we saw a change here, and over the past days, while NASDAQ soared 5% on Thursday and plunged 4% on the day after, Bitcoin was standing still around the $6,600 area. If the idea of Bitcoin is here to stay, then Bitcoin must be an asset class on its own.
Total Market Cap: $174 billion
Bitcoin Market Cap: $114 billion
BTC Dominance Index: 65.2%
*Data by CoinGecko
– Support/Resistance levels: Following the breakdown, Bitcoin found support around the $6K benchmark. In case Bitcoin doesn’t hold the latter, we can expect the next support level to be $5900, followed by $5700, $5500, and $5200 – $5300.
From above, Bitcoin would face the $6300 – $6400 old support turned resistance as the first target level. The level includes the 4-hour MA-50 (pink line, currently around $6400). Further above lies the $6600 area, followed by the “ceiling” of the past week around $6800.
– The RSI Indicator: After reaching and trying for days to breach the significant level of 50, Bitcoin got rejected, and now the momentum indicator is facing down.
As mentioned here, the Stochastic RSI oscillator had made a crossover around the overbought territory, which indicates a short-term bearish correction.
– Trading volume: After two weeks of declining volume, since the March 12 price plunge, finally, we received the huge move we expected.