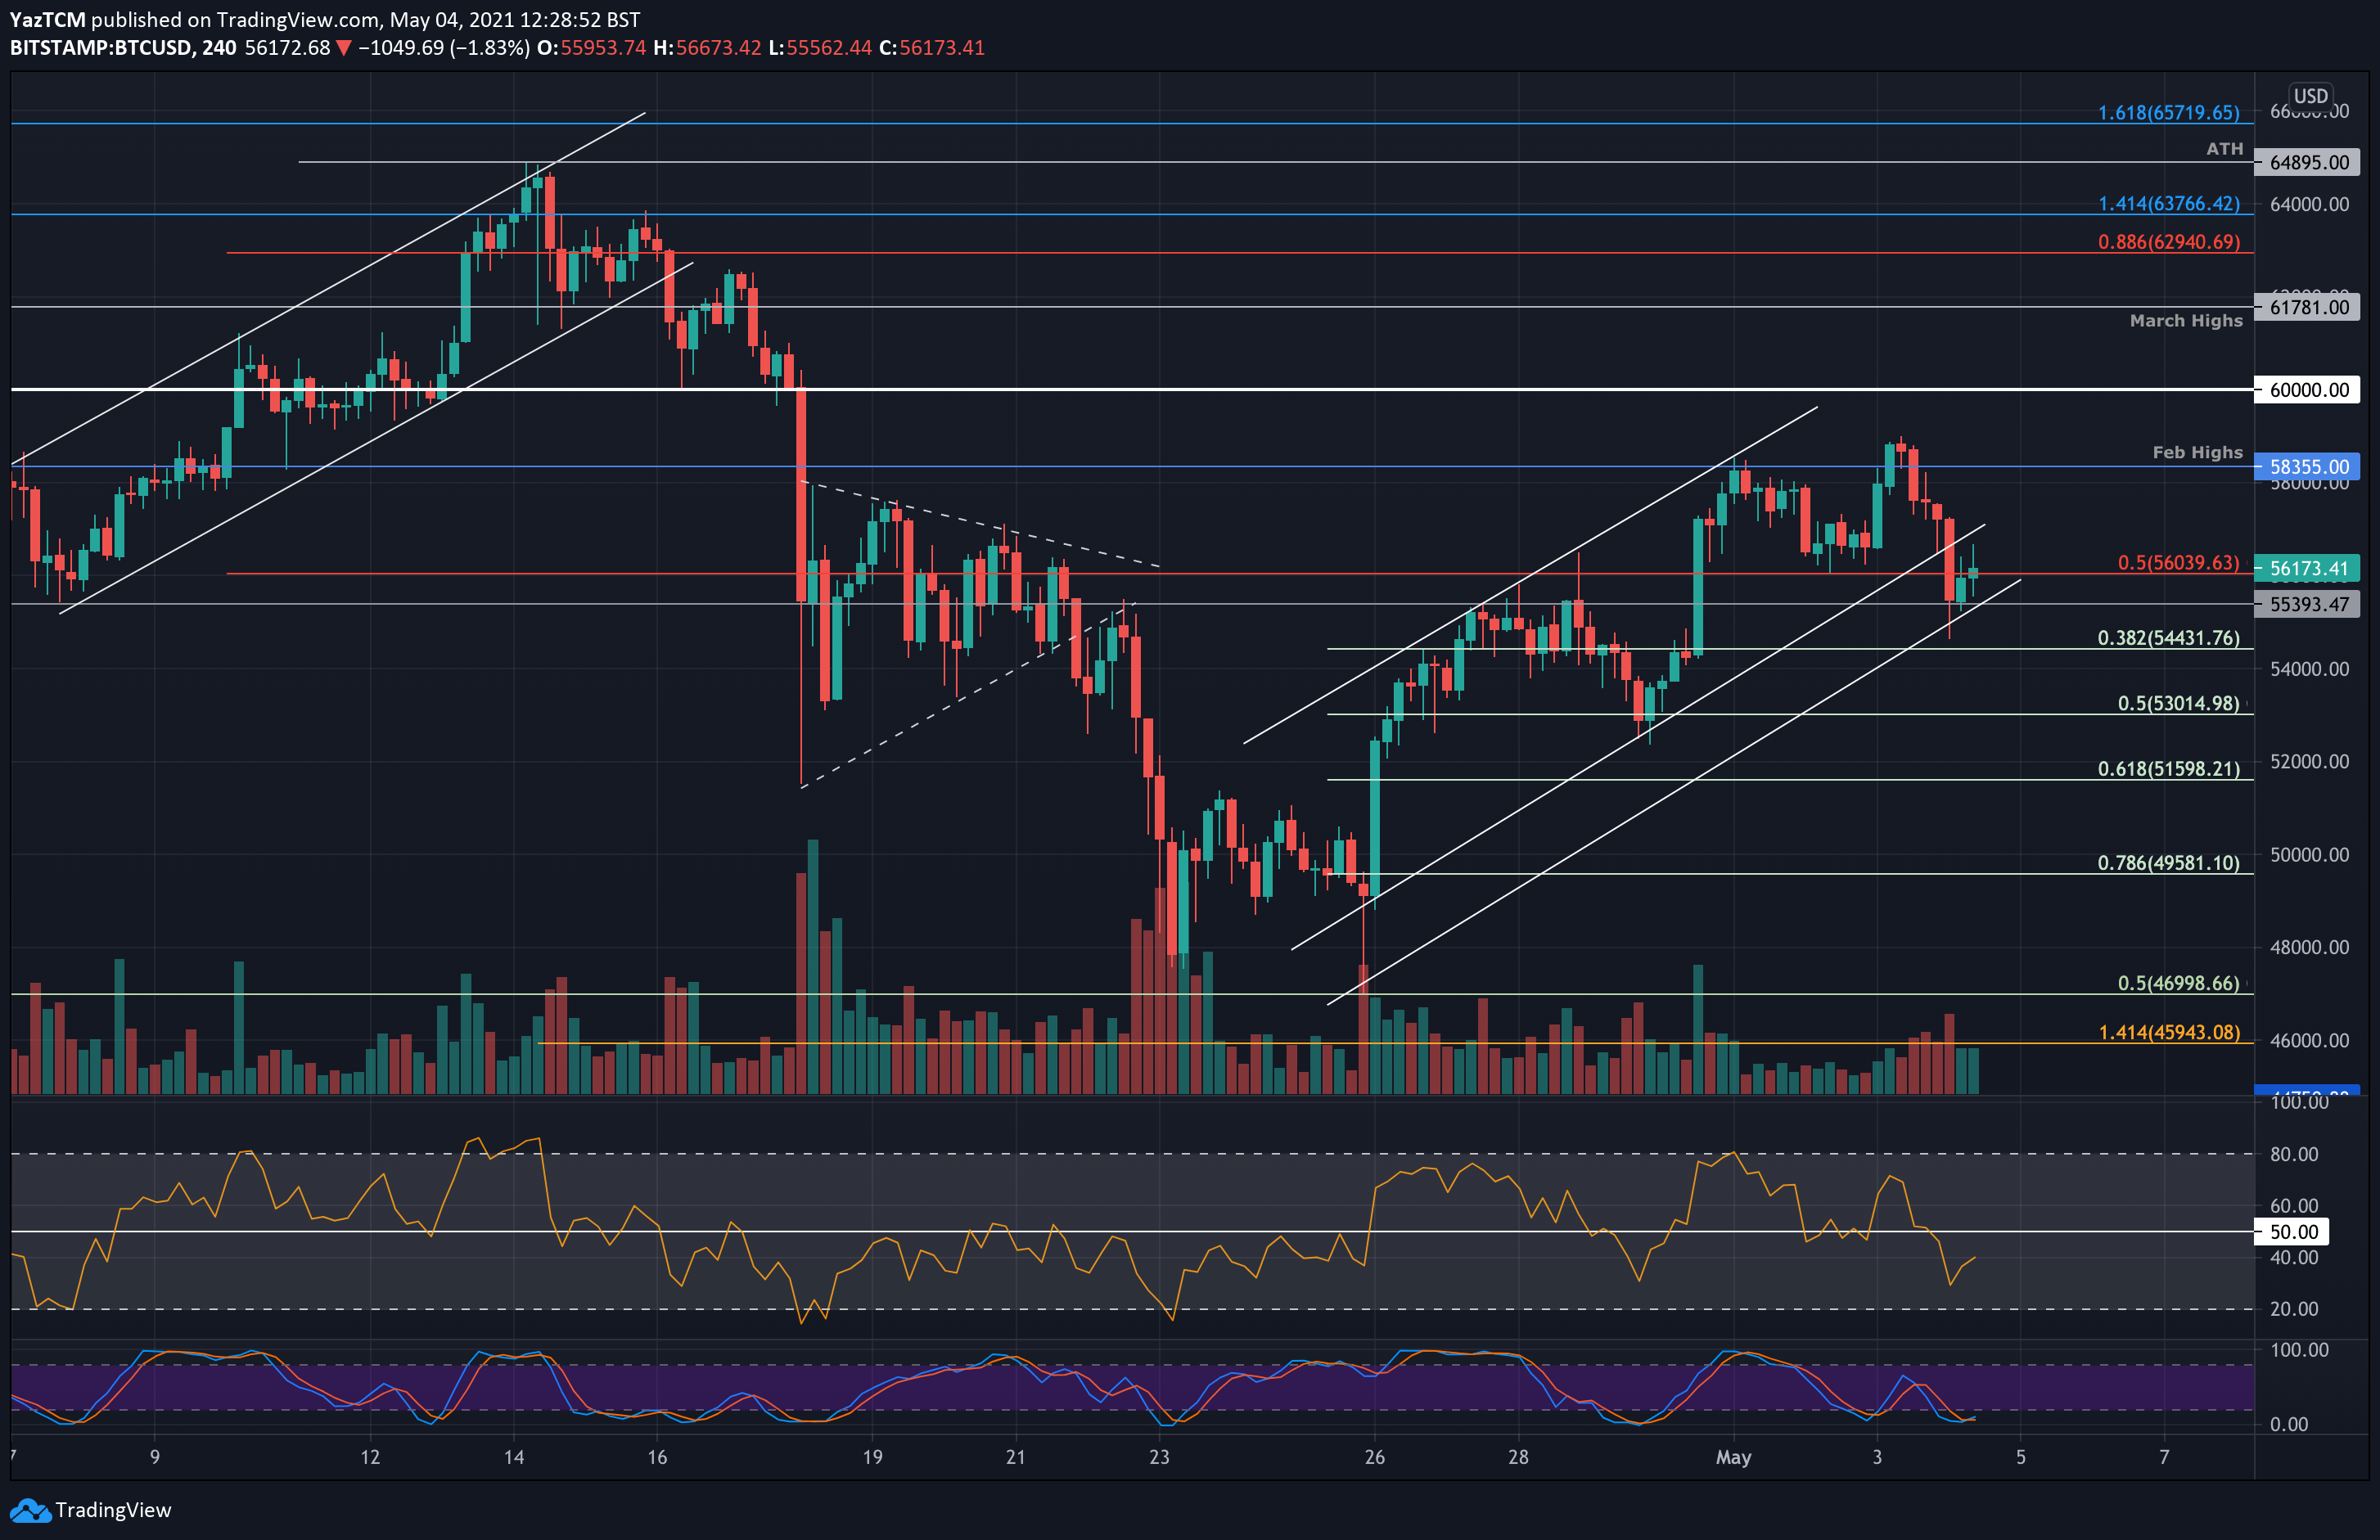
BTC/USD 4-Hour Chart. Source: TradingView
Today, bitcoin dropped by a sharp 4.8% and reached as low as $54,650. However, the cryptocurrency is back trading at around $56,000 as it found solid support at the 20-day MA which allowed it to rebound.
A quick recap: Bitcoin’s price decreased to as low as $47,000 (.5 Fib) over the past two weeks but it has since recovered a lot of the losses. As can be seen on the short-term charts, BTC was trading inside an ascending price channel over the week as it reached the February 2021 highs at $58,355 by the beginning of May. Yesterday, the price reached $59,000 but the momentum started to fade and bitcoin headed lower.
Today, the sharp 4.6% price drop caused bitcoin to fall through the lower boundary of the ascending price channel. It continued beneath $56,000 until finding support at $55,400, which stalled the decline. There is also a parallel trend line to the ascending price channel and the 20-day MA here that bolstered the support.
Key Support Levels: $55,400, $54,050, $53,000, $51,600, $50,000.
Key Resistance Levels: $56,835, $58,355, $59,000, $60,000, $61,780.
Looking ahead, the first support lies at $55,400 (the parallel trend line). This is followed by $54,430 (.382 Fib), $53,000 (.5 Fib), and $51,600 (.618 Fib & 100-days MA).
On the other side, the first resistance lies at $56,835 (50-days MA). This is followed by $58,355 (Feb 2021 Highs), $59,000, $60,000, and $61,780 (March 2021 Highs).
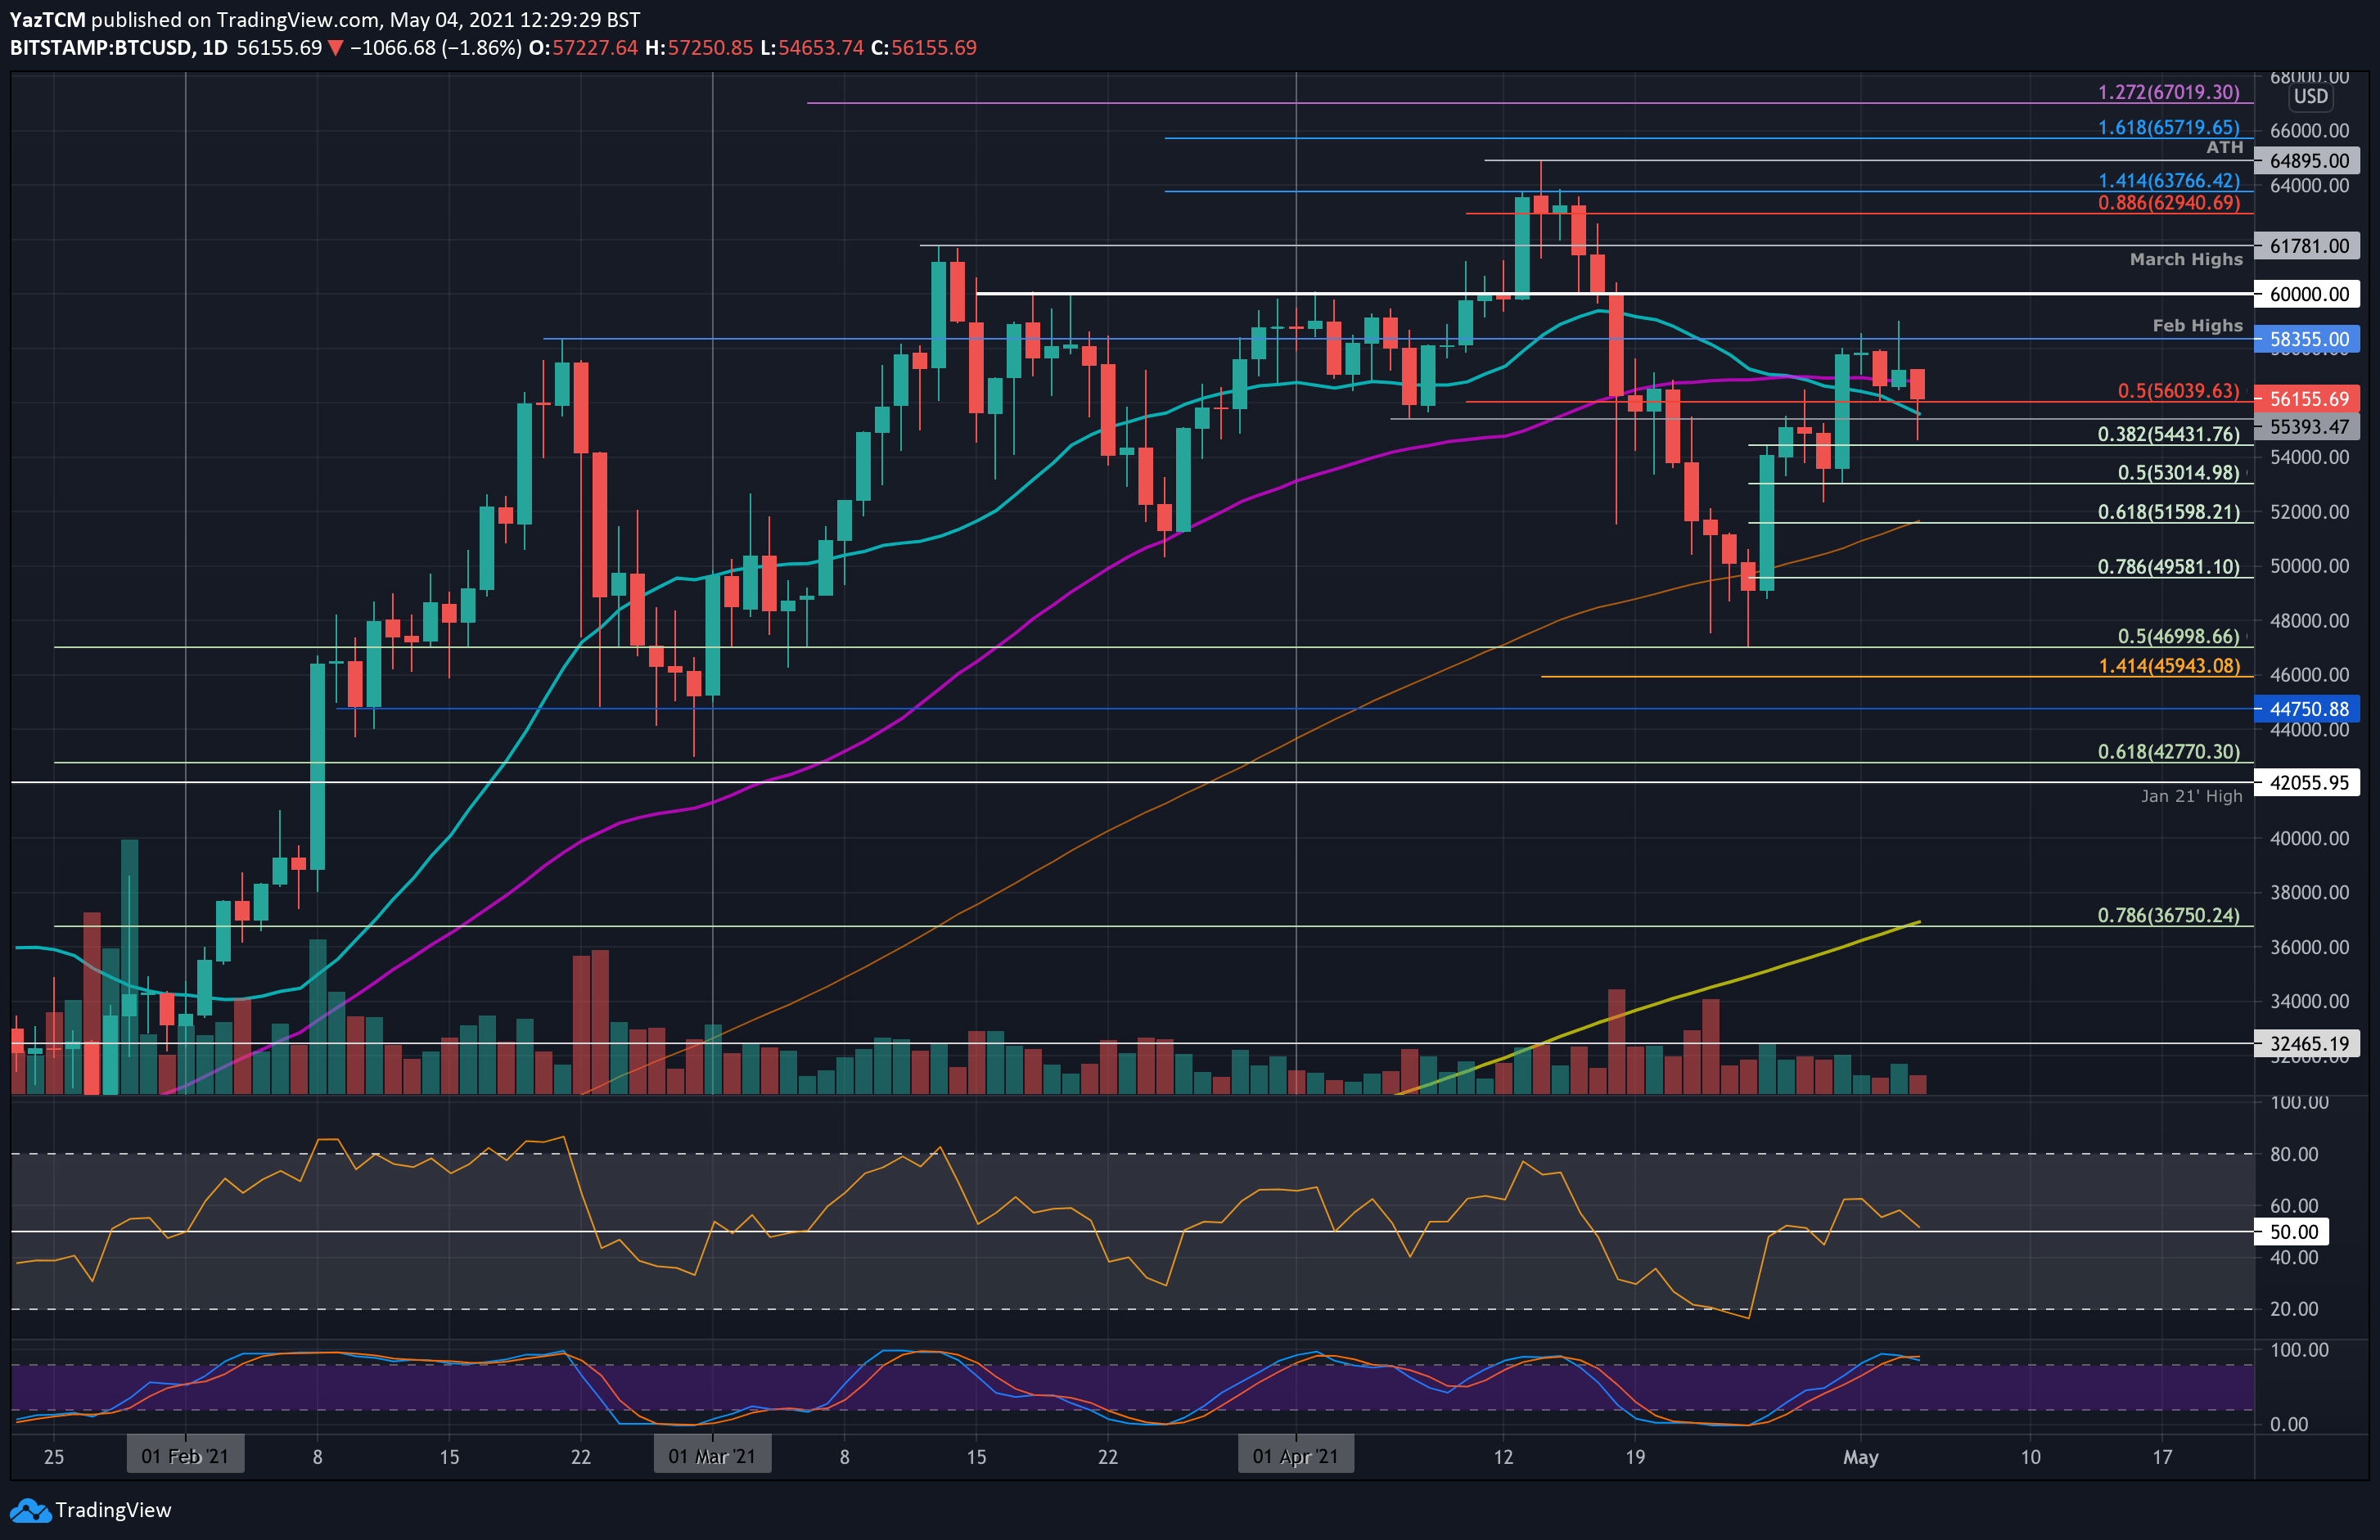
The technical indicators do not look very promising. The 20-day MA crossed beneath the 50-day MA toward the end of April for the first time since October 2020. This could be the first signal that the long-term bullish momentum is starting to reverse.
Additionally, the RSI has now returned back to the midline as the market reaches a point of indecision. A break beneath the 50 level will see the bearish momentum increasing and is likely to push bitcoin back toward $50,000.