There has been a lot of price action surrounding Bitcoin in the past few days. After the massive decline from the $12,000 area to $9,614 (on Bitstamp), a bullish move has transpired, and what a move. In less than a day, Bitcoin gained almost $2,000 in value to retest crucial support-turned-resistance.
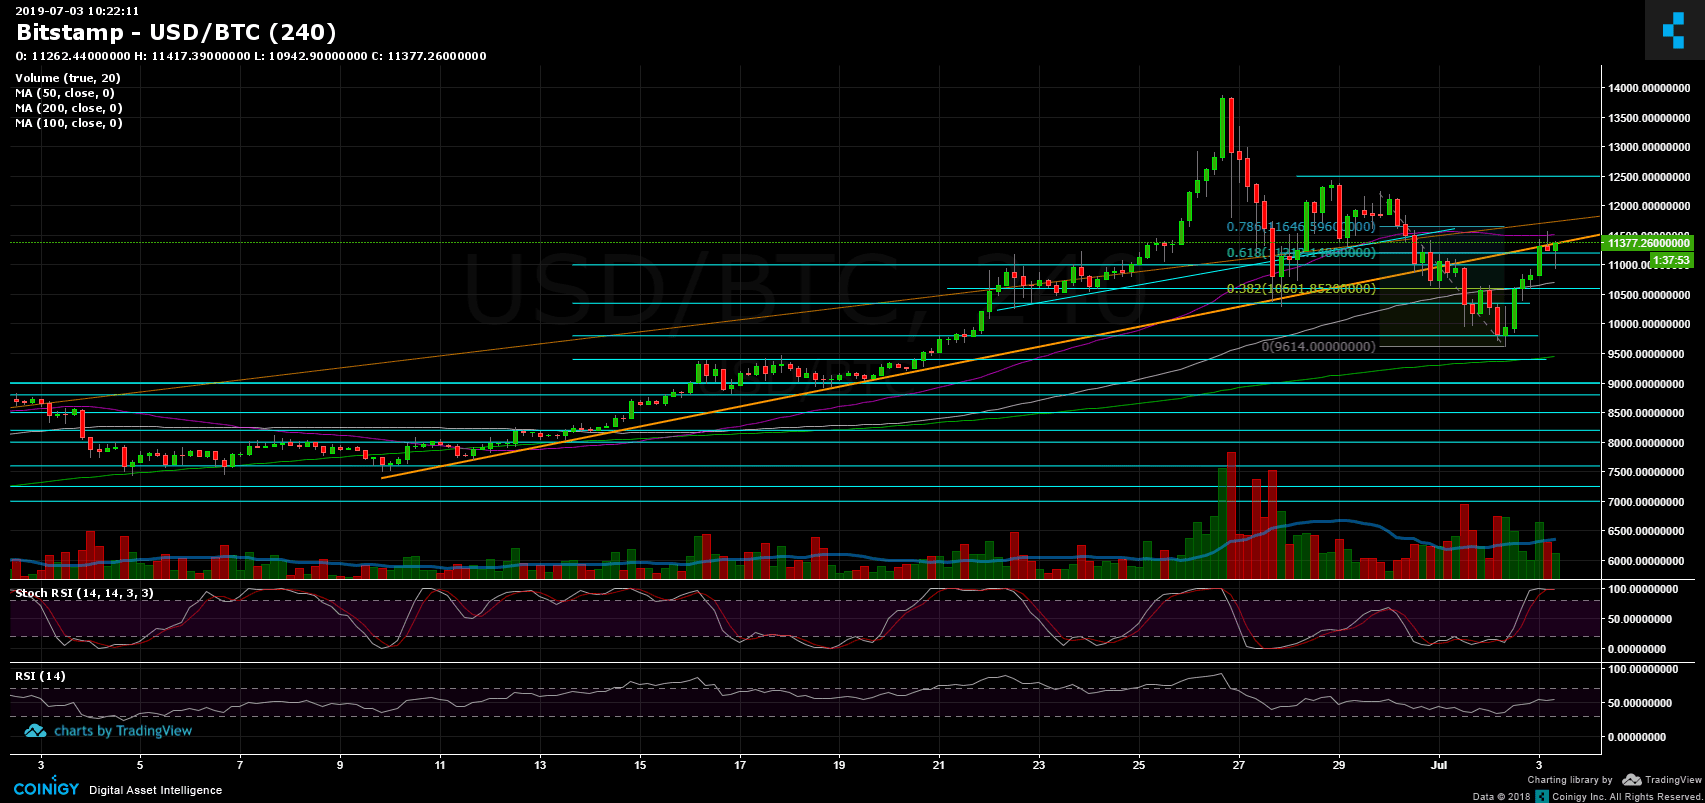
What was truly impressive was the strength of the market. Any Bitcoin under $10,000 was bought very quickly. However, as can be seen on the 4-hour chart, Bitcoin has reached a crucial resistance area at the mid-term ascending trend-line (marked in orange). This is the first test of the cryptocurrency in its way back up.
Total Market Cap: $322 billion
Bitcoin Market Cap: $200 billion
BTC Dominance Index: 62.1% (Yesterday, we pointed out the BTC dominance index support level at 60%. This was another sign of a possible bullish move.)
*Data by CoinGecko
Support/Resistance: Bitcoin is now facing two critical resistance levels: $11,200 and $11,500. There is also the ascending trend-line resistance and the 61.8% Fib retracement level. If it were to break above them, the price would be likely to reach the resistance area from a week ago at $12,000 – $12,200. Further above lies $12,500 before the 2019 high of $13,500 – $13,880.
From below, the nearest support lies at $11,000 before the $10,800 support level. Further below are $10,600, $10,300 and $9,800. Then lies the low from yesterday, $9600. As was said here yesterday, and only in my opinion, a return to the $9,400 area would be considered a healthy correction to the recent parabolic move which saw the price of Bitcoin reach $13,880.
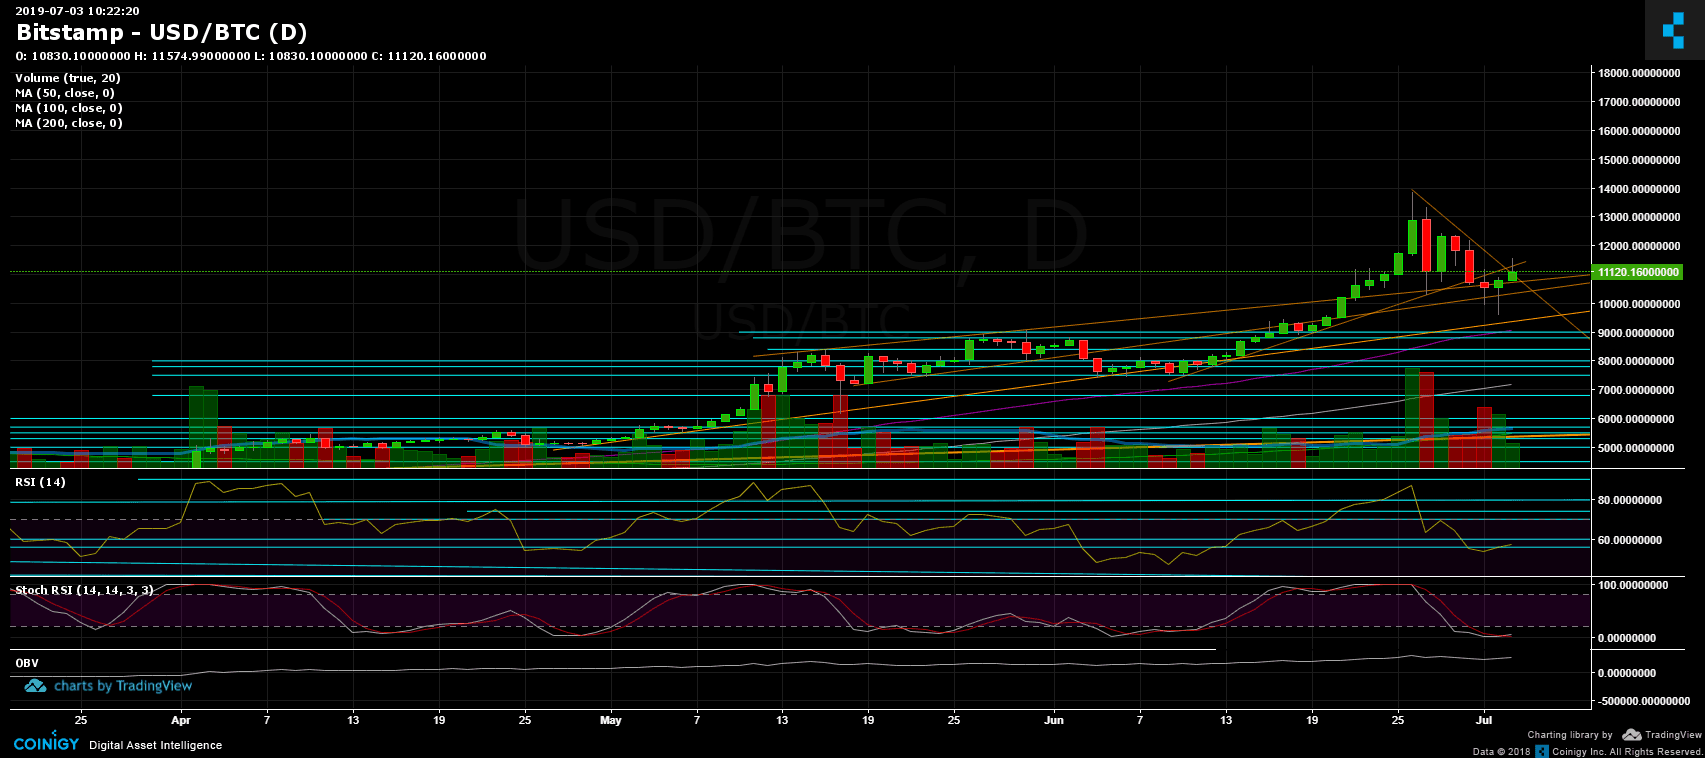
Daily chart’s RSI: The RSI found support at the 50 level and is hovering in bullish territory. Following yesterday’s analysis, the Stochastic RSI oscillator made the anticipated crossover to the bullish side and is about to enter bullish territory.
Trading Volume: Yesterday’s daily candle along with the volume are definitely strong signs for the bulls. However, the volume levels are still far from last week’s peak.
Bitfinex open short positions: Following the odd drop in shorts, the amount of open positions is now 9.5K BTC, which is another 6% daily drop. This is not far (9.2K) from the 2-year low of 9.2K (from January 2018).