In just a little more than two days, Bitcoin had enough time to lose $1100 in its way down to $8000, and since then we see BTC climbing healthy and slowly back up.
To sum up the events so far, Bitcoin held the $8000 support along with the 61.8% Fibonacci retracement level, and after recently breaking up the $8500 level, the coin is getting very close to another test of the $8800 resistance.
Since May 8, when Bitcoin said goodbye to the $6000 area, it had gone through high levels of volatility, and it doesn’t seem to calm down in the next days.
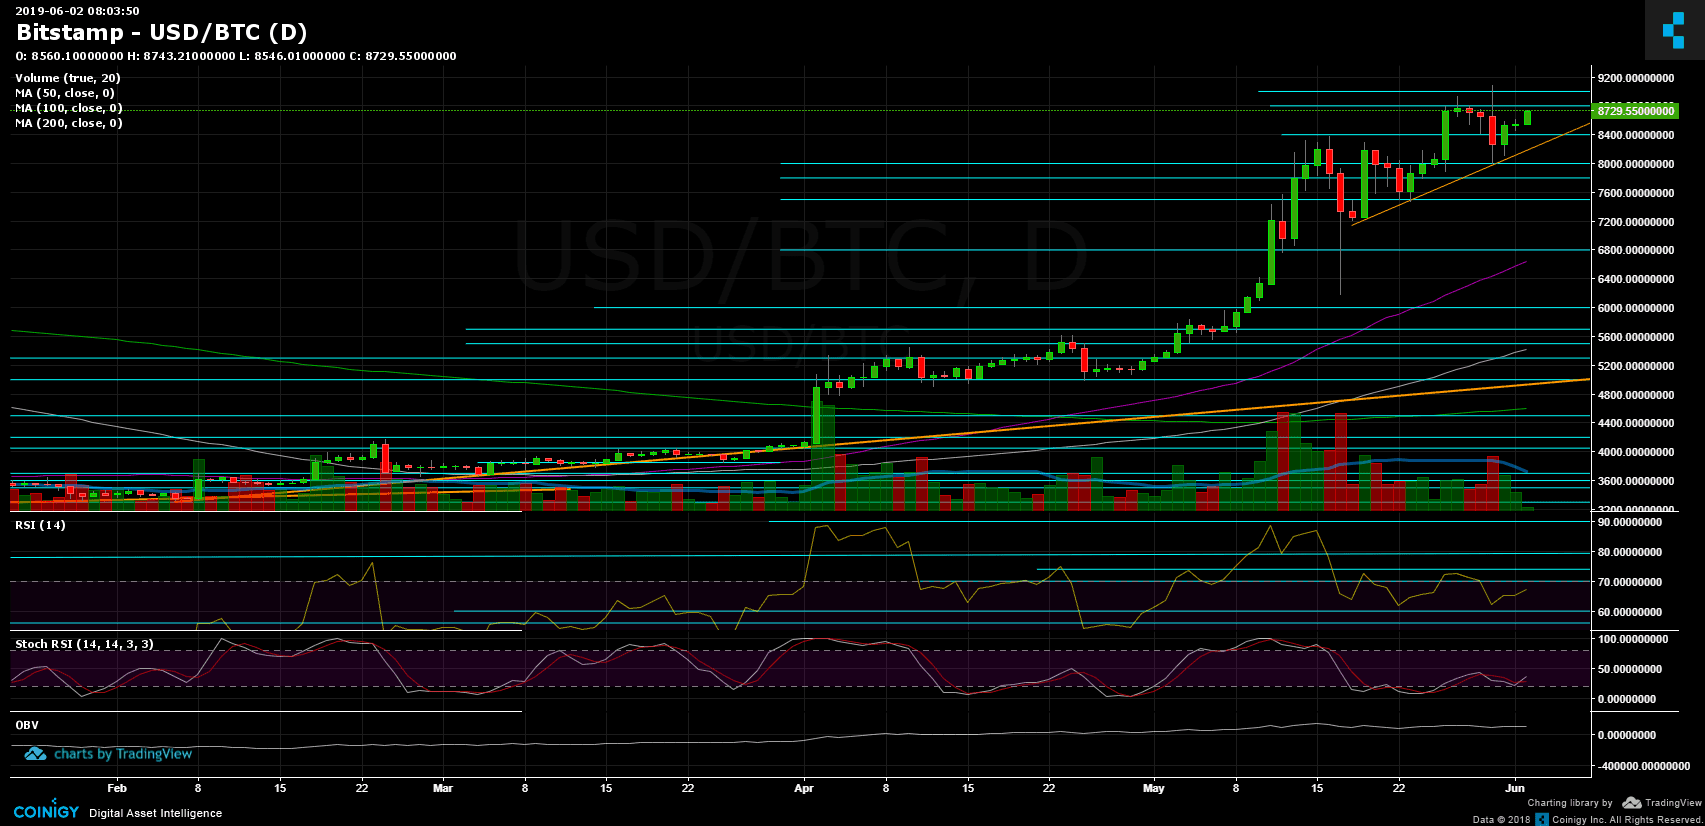
In our recent analysis, we had pointed out the negative divergence in the BTC daily chart’s RSI. The last found support at the 60 levels, and as of now, hovering around 67-68. However, to invalidate the mentioned divergence, we would like to see the RSI above the 73 area (the last week’s high).
Regarding the weekly Stochastic RSI, which had recently crossed over pointing down, so following the recent gains, the oscillator is back above in the bullish territory. The correction will wait for now
Total Market Cap: $273.6 Billion
Bitcoin Market Cap: $152.8 Billion
BTC Dominance: 55.9%
– Support/Resistance:
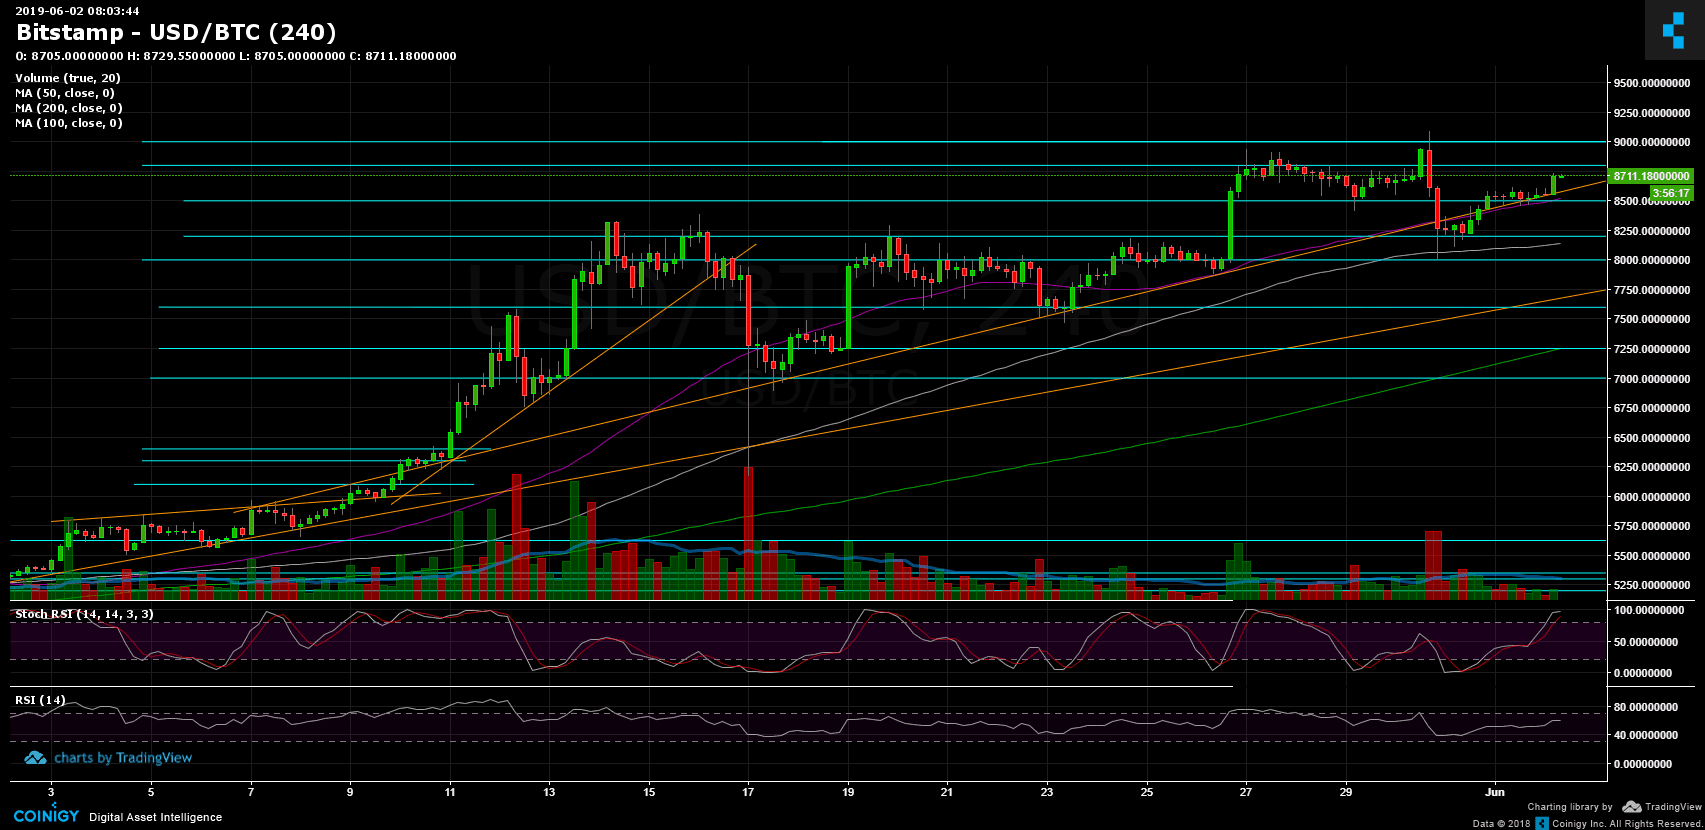
After breaking up the $8500 area, Bitcoin is now facing the $8800 – $9000 resistance area. Higher above lies the $9200 – $9300 zone, before reaching the $9700 – $9800 area which was the highest of May 2018, and that is the last barrier before BTC reaches $10,000.
From below, the closest level of support is the $8500 level, along with the mid-term ascending trend-line (marked in orange on the 4-hour chart). Further below is $8400 before the next significant support lies at $8200. Further below lies $8000, $7800 and $7600. The last is the past week’s low along with the 4-hour MA-100 and the mid-term ascending trend-line (shown on the 4-hour chart). Further below is $7250 and $7000.
– Trading Volume: The recent gain was followed by lower than average levels of volume. This could be due to the weekend, but keep in mind that the recent rise of the past week was followed by a lower amount of volume (a low number of buyers).
– Daily chart’s RSI: Discussed above.
– BitFinex open short positions: Since our recent price analysis, there hasn’t been much change, whereas the open short positions number stands around 20.7 K BTC positions.