Over the past three days, despite that most of the traders are off on vacation, we could see a nonsense trading around the $7200 BTC mark.
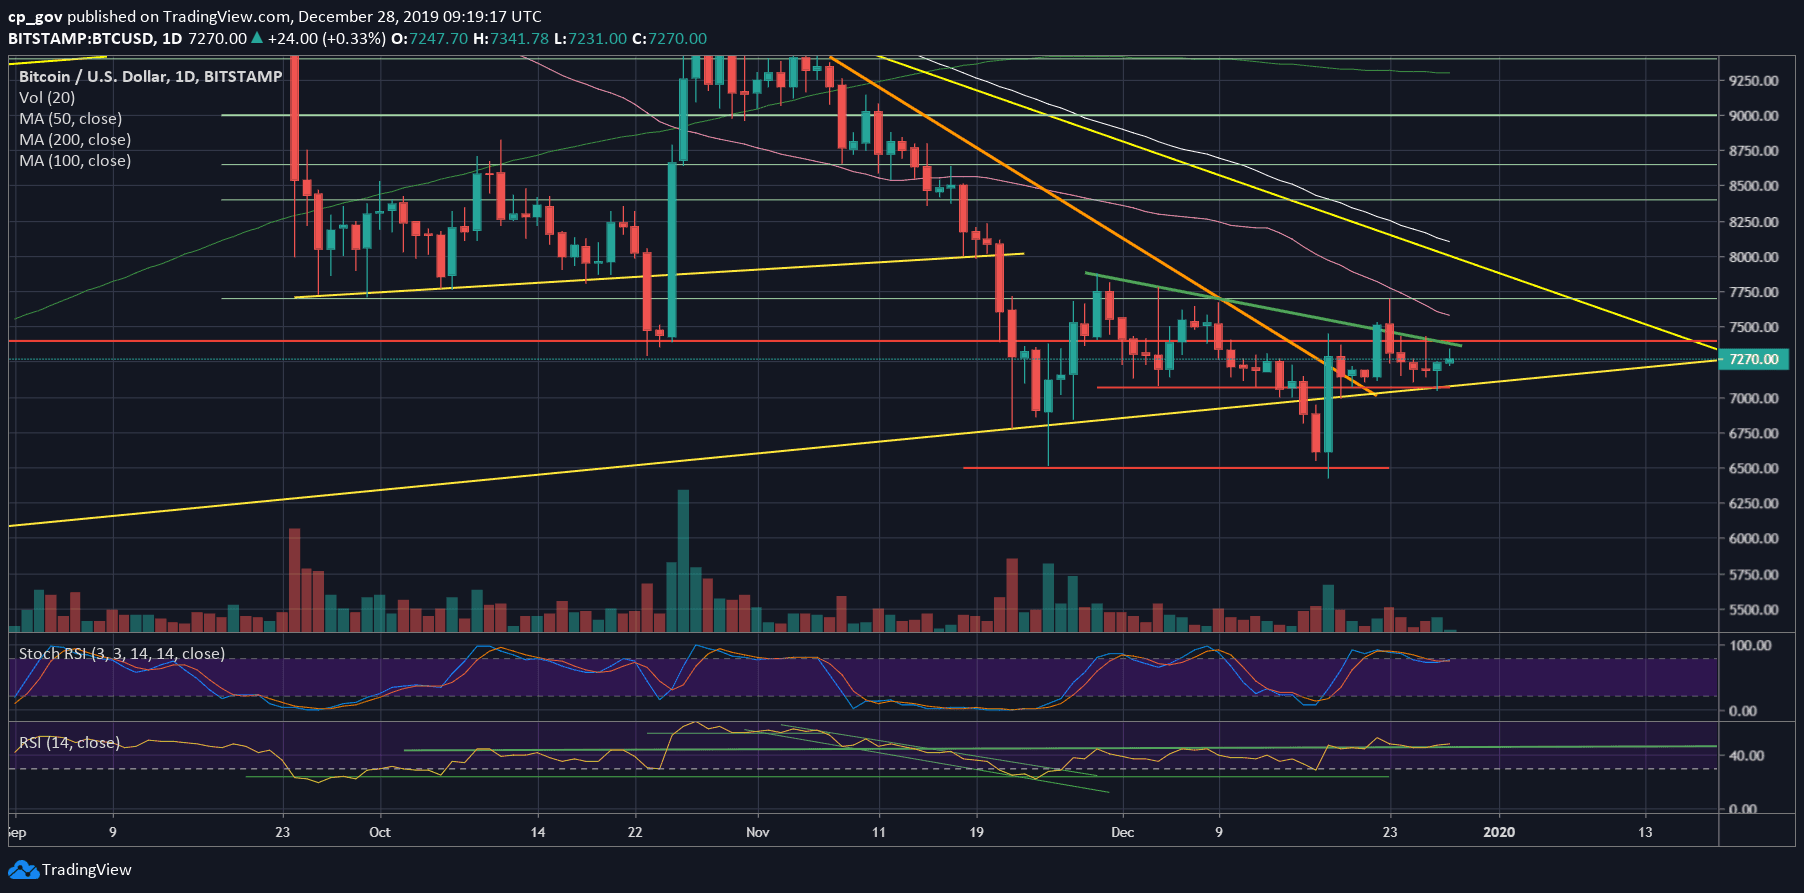
The following daily chart tells the short-term story: throughout the month of December, Bitcoin can’t get over the green resistance line – including the latest tryout two days ago at $7430.
From below, despite one fake-out which got quickly corrected, the yellow ascending trend-line is supporting Bitcoin since April 2019. The last attempt of the line took place just yesterday (~$7070), together with a horizontal support line (marked red on the following daily chart).
Two possible scenarios for the coming week, as I see it from here: The bearish one – Bitcoin continues to build up another bearish triangle, which will break together with the $7000 support.
The other short-term prediction is a breakout of the green resistance line, and a retest of the long-term yellow descending trend-line around $7700 – $7800. This could also turn into a massive inverse head and shoulders in case of a bullish breakout.
Final days of 2019: December’s candle will close in three days, in case the price of Bitcoin will be above $7560, then the monthly candle will close green. That would make two consecutive green candles on the monthly. This would turn into a Hammer candle, which is the first step for a bullish price reversal.
Total Market Cap: $193.5 billion
Bitcoin Market Cap: $132.7 billion
BTC Dominance Index: 68.6%
*Data by CoinGecko
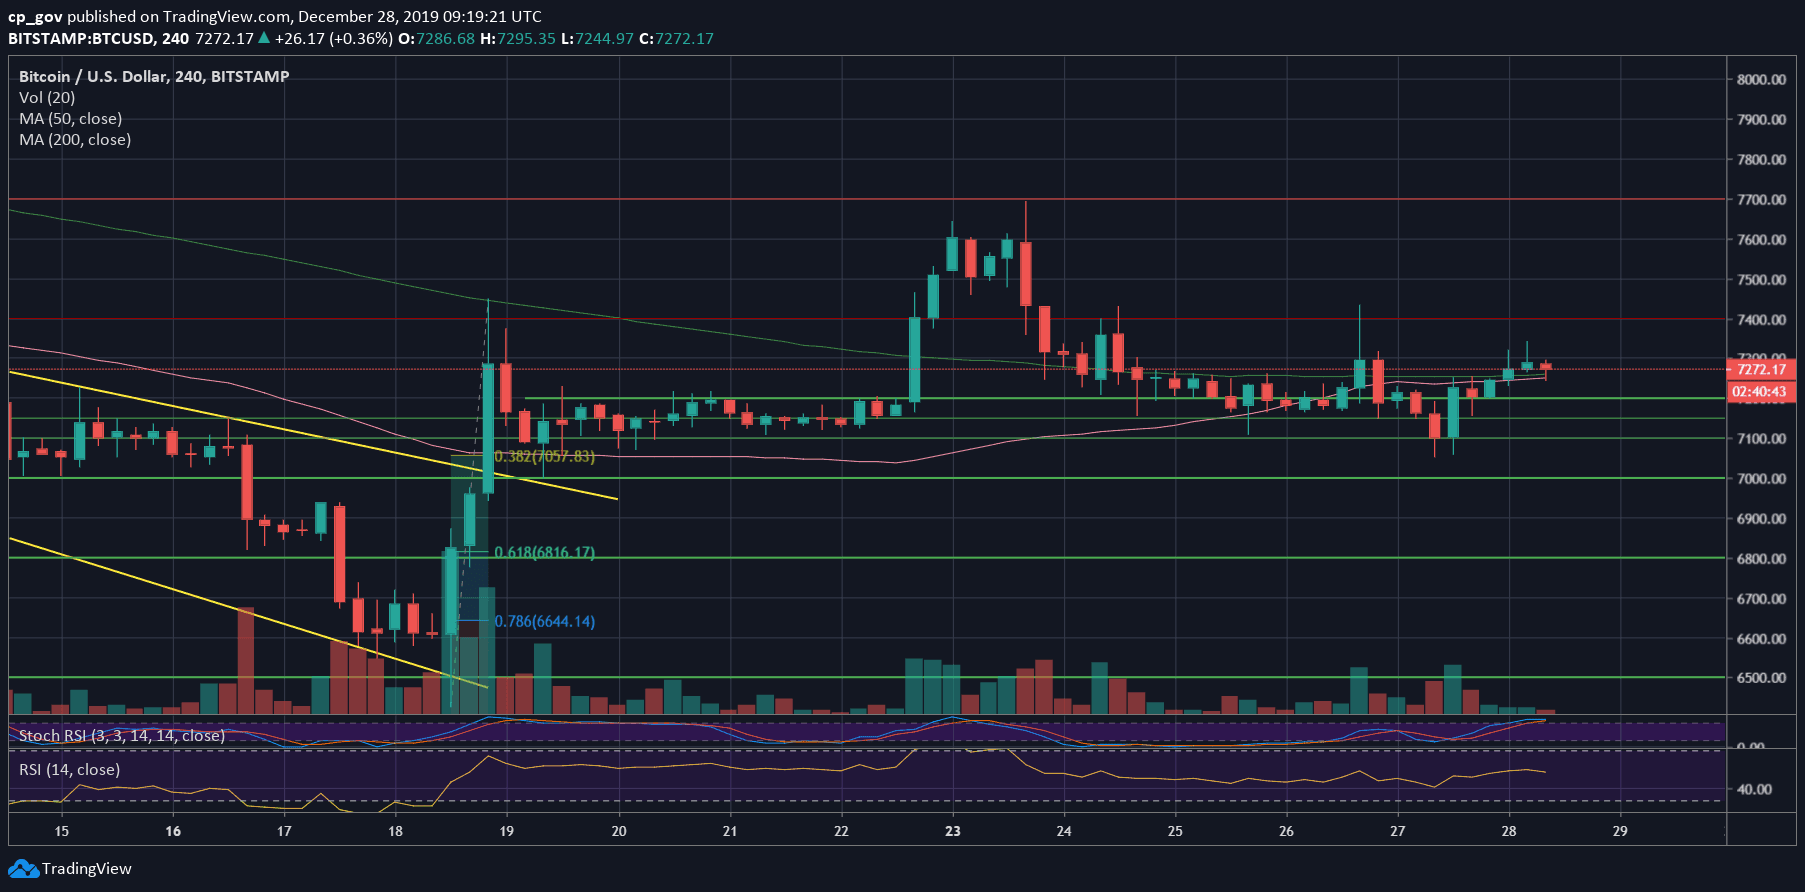
– Support/Resistance: Looking at the 4-hour chart, there is a bullish sign that might come in the form of a Golden Cross – The MA-50 (pink line) is about to cross above the MA-200 (light green). Don’t get too excited about this Golden Cross, it’s only the 4-hour time-frame.
Despite the above, Bitcoin might overcome the $7300 – $7400 significant resistance, which includes the mentioned descending green trend-line from the daily chart.
The next resistance level is the 50-days moving average line (currently lies around $7570), before reaching the $7700 price level.
From below, the first level of support is the $7200, followed by the mid-term ascending trend-line (yellow on the daily chart), along with the horizontal support of $7000 – $7070.
– The RSI Indicator: There is a slight bullish divergence on the RSI; however, nothing is significant as the indicator still trading around the 44-45 confluence level.
– Trading volume: The recent days’ volume levels are far from the monthly highs. This can be explained because of the weekend and Holidays. Be aware that the market is easy to manipulate due to the low volume.