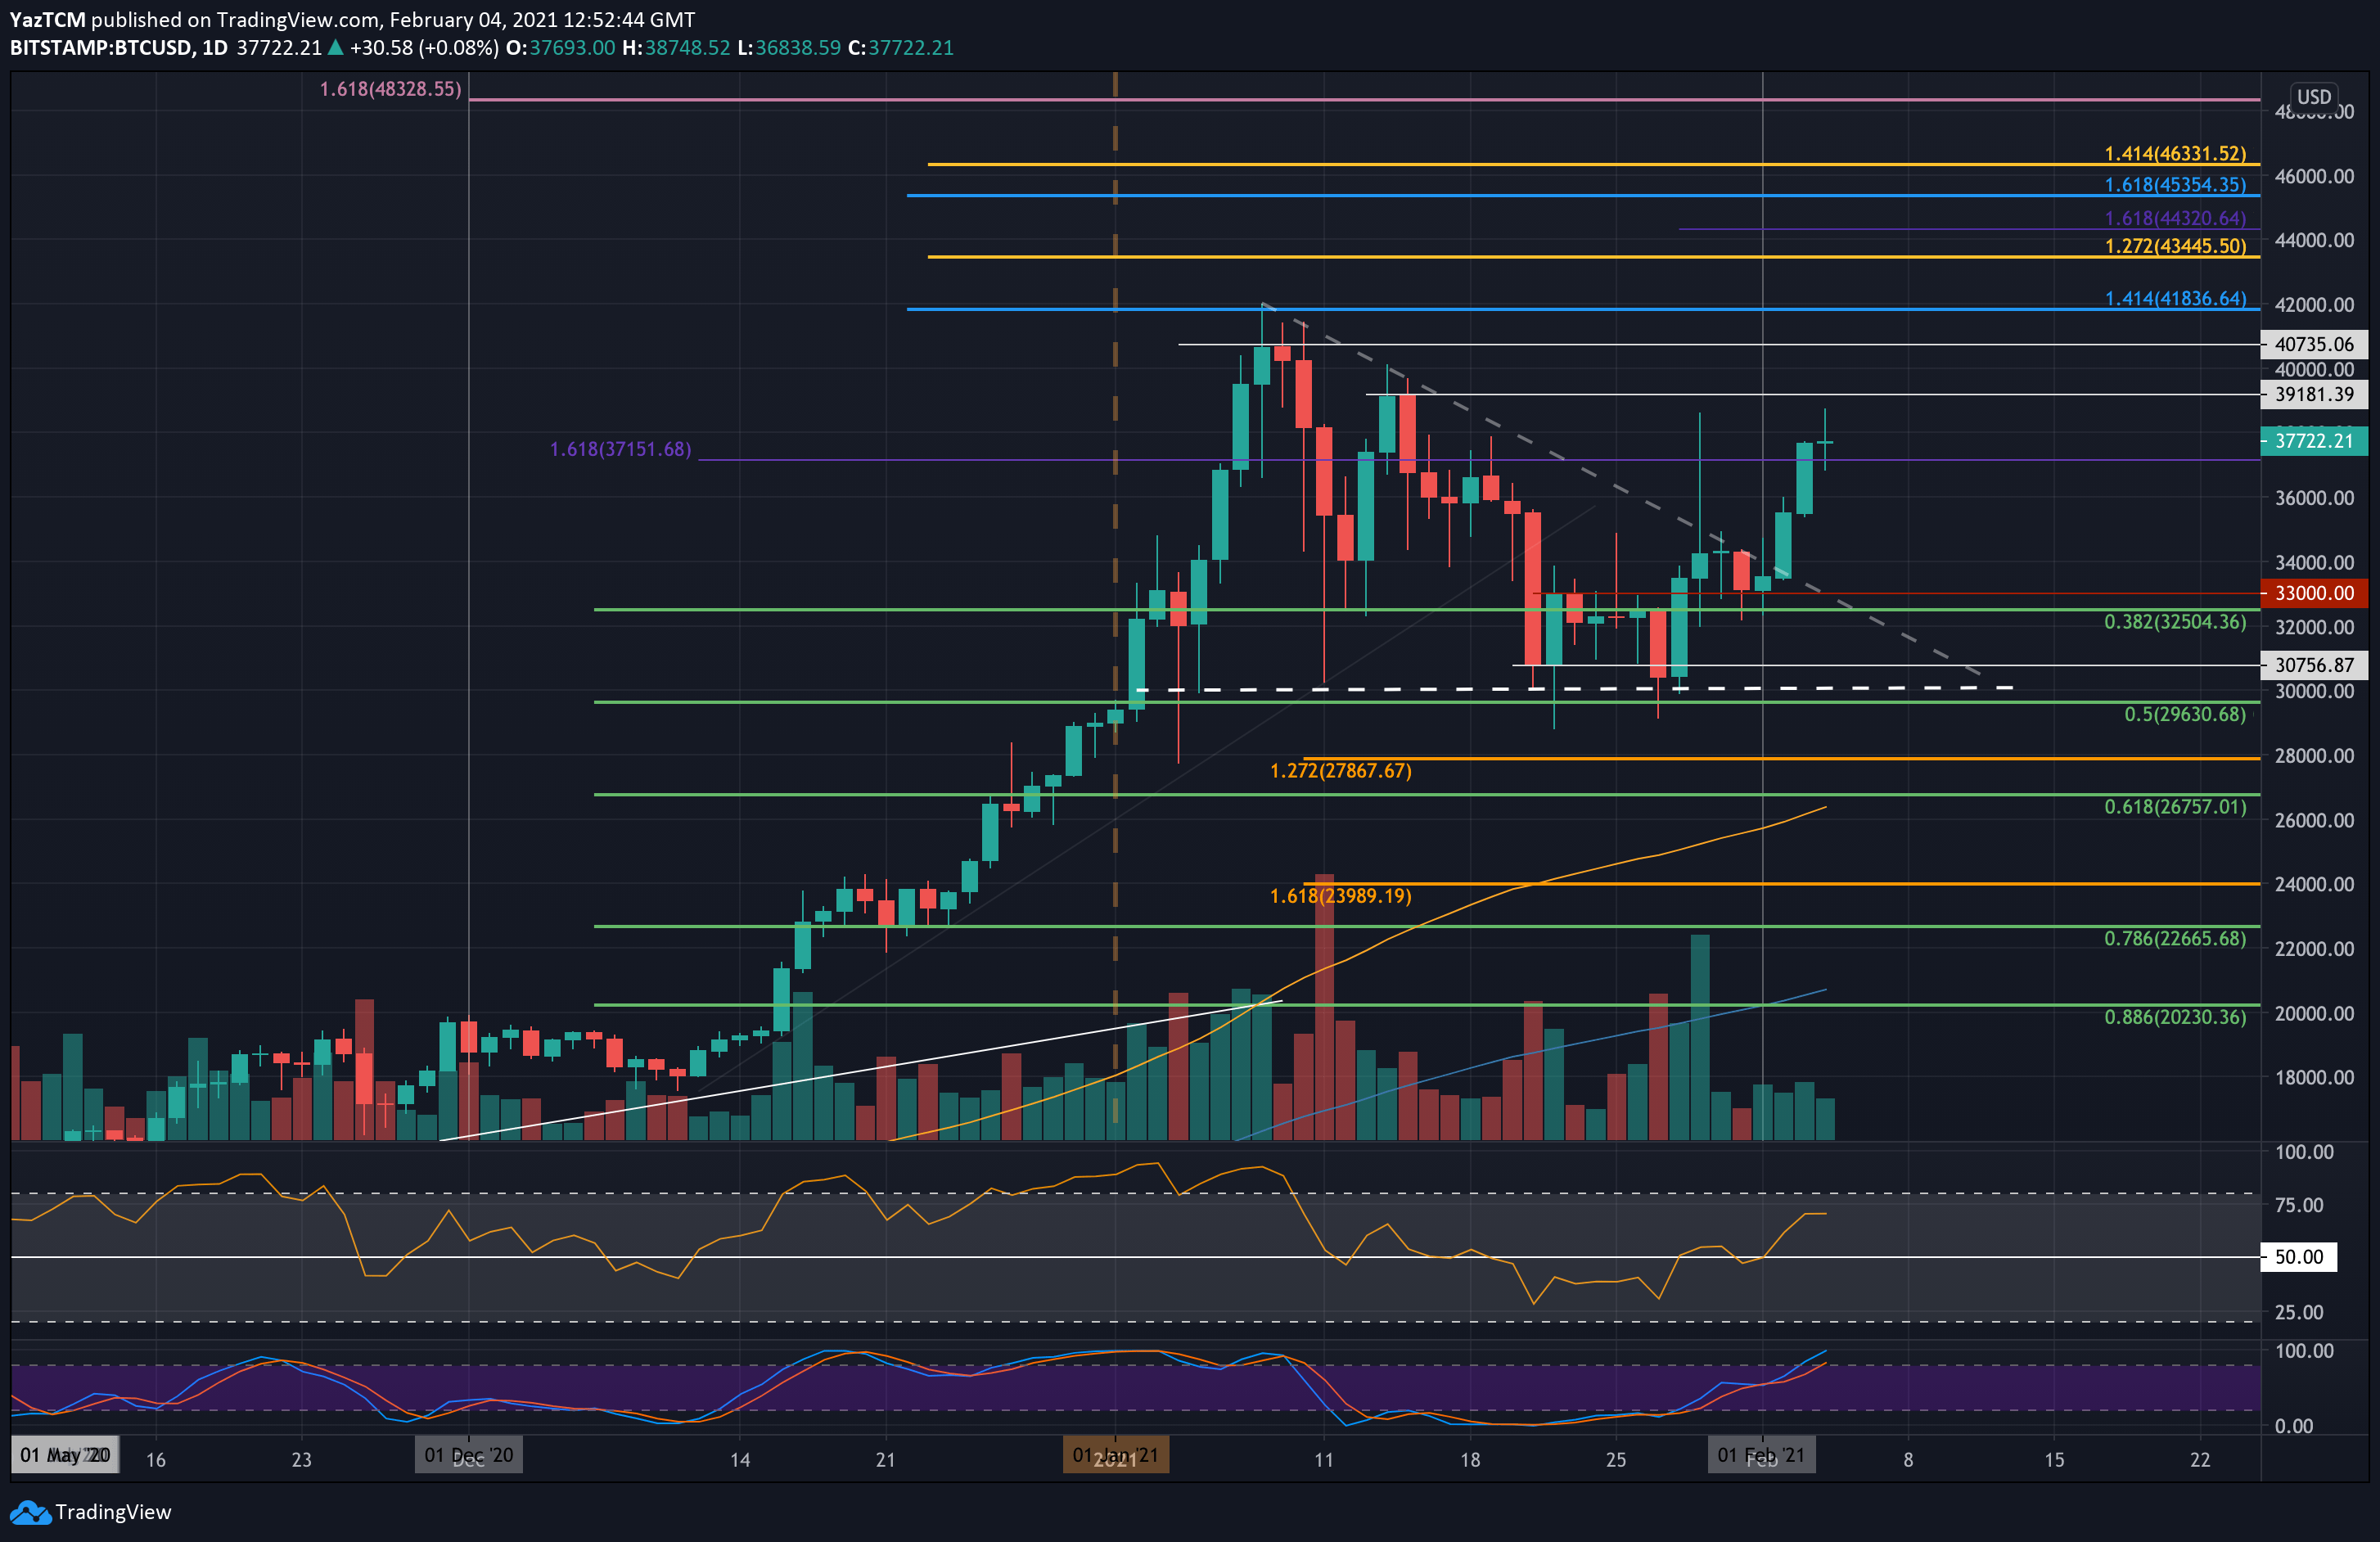
BTC/USD Daily Chart. Source: TradingView
Bitcoin is back on a bullish footing after finally breaking above the descending triangle pattern, which started forming a month ago when it recorded its all-time high. Since the breakout, the cryptocurrency managed to rise by a total of 12.5% to reach the current level of around $37,500.
A quick recap: bitcoin’s price had been trapped within a large descending triangle pattern for almost four weeks, as can be seen on the following charts. It did manage to break last Friday, however, this turned to be a fake-out, following Elon Musk’s tweeter action. The second attempt, which took place this Tuesday, has been confirmed with a daily candle closing above the triangle’s upper boundary.
Today, Bitcoin managed to climb by another 4% as it reached a high of $38,748, according to Bitstamp. This is the highest price of Bitcoin since January 15, 2020.
After reaching today’s high, BTC failed to close a 4-hour candle above $38,000 and has since dropped slightly toward $37,500, where it trades as of now.
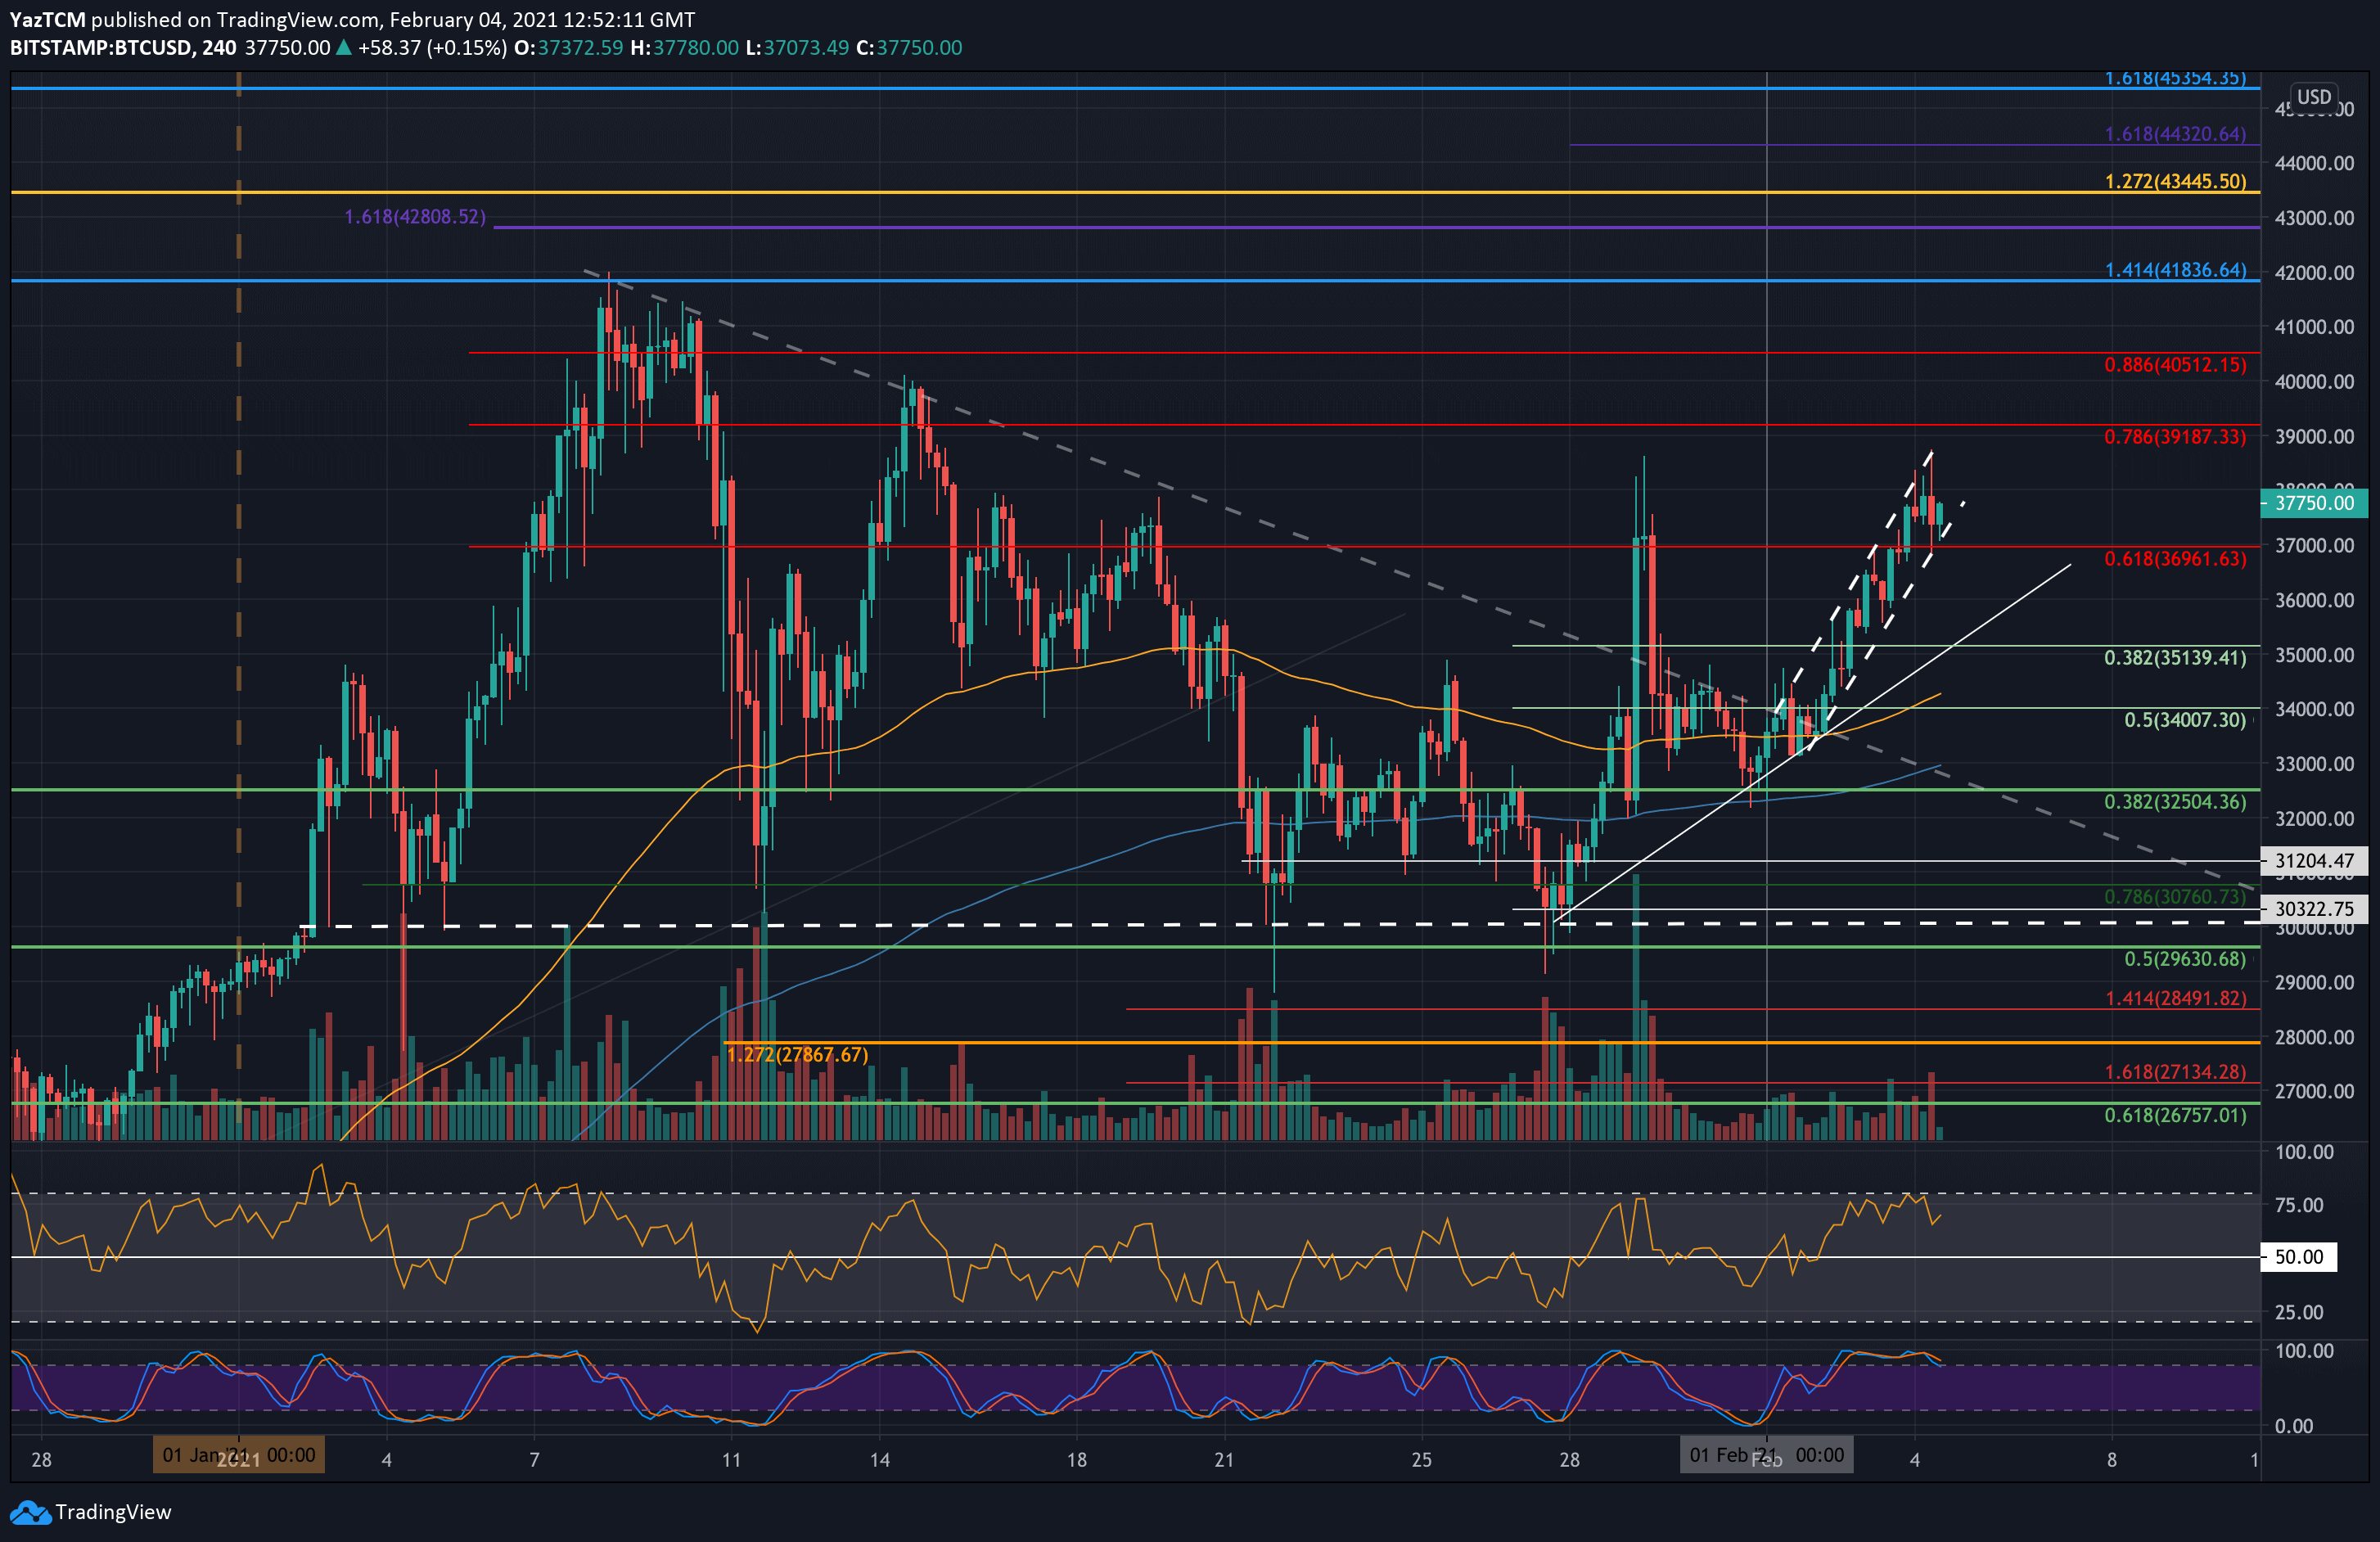
Additionally, BTC has established a steeply rising ascending price channel on the following 4-hour chart. With the recent bullish momentum, it will likely be heading back toward the $40K and then towards the $42,000 ATH price next. However, there is a lot of supply inside that range, so it might not be as easy.
Key Support Levels: $37,000, $36,000, $35,140, $34,000, $32,500.
Key Resistance Levels: $38,000, $38,800, $39,190, $40,000, $40,512 – $40,735, $42,000.
Moving forward, the first level of resistance lies at $38,000. This is followed by $38,800 (today and Tuesday’s high), $39,190 (bearish .786 Fib level, along with today’s high), $40,000, and $40,512 (bearish .886 Fib).
Further resistance is found at $40,735, and of course, the ATH level at $42,000, reached on January 8, 2021.
On the other side, the first support lies at $37,000. This is followed by $36,000 (short term ascending trend line), $35,140 (short term .382 Fib), $34,800 (4-hour chart’s MA-200), $34,000 (short term .5 Fib and 4-hour’s MA-50), and $32,500 (long term .382 Fib).
As mentioned, the bullish momentum is growing. This is reflected by the RSI, which remains well above the 50 level. It still has room to grow even higher.