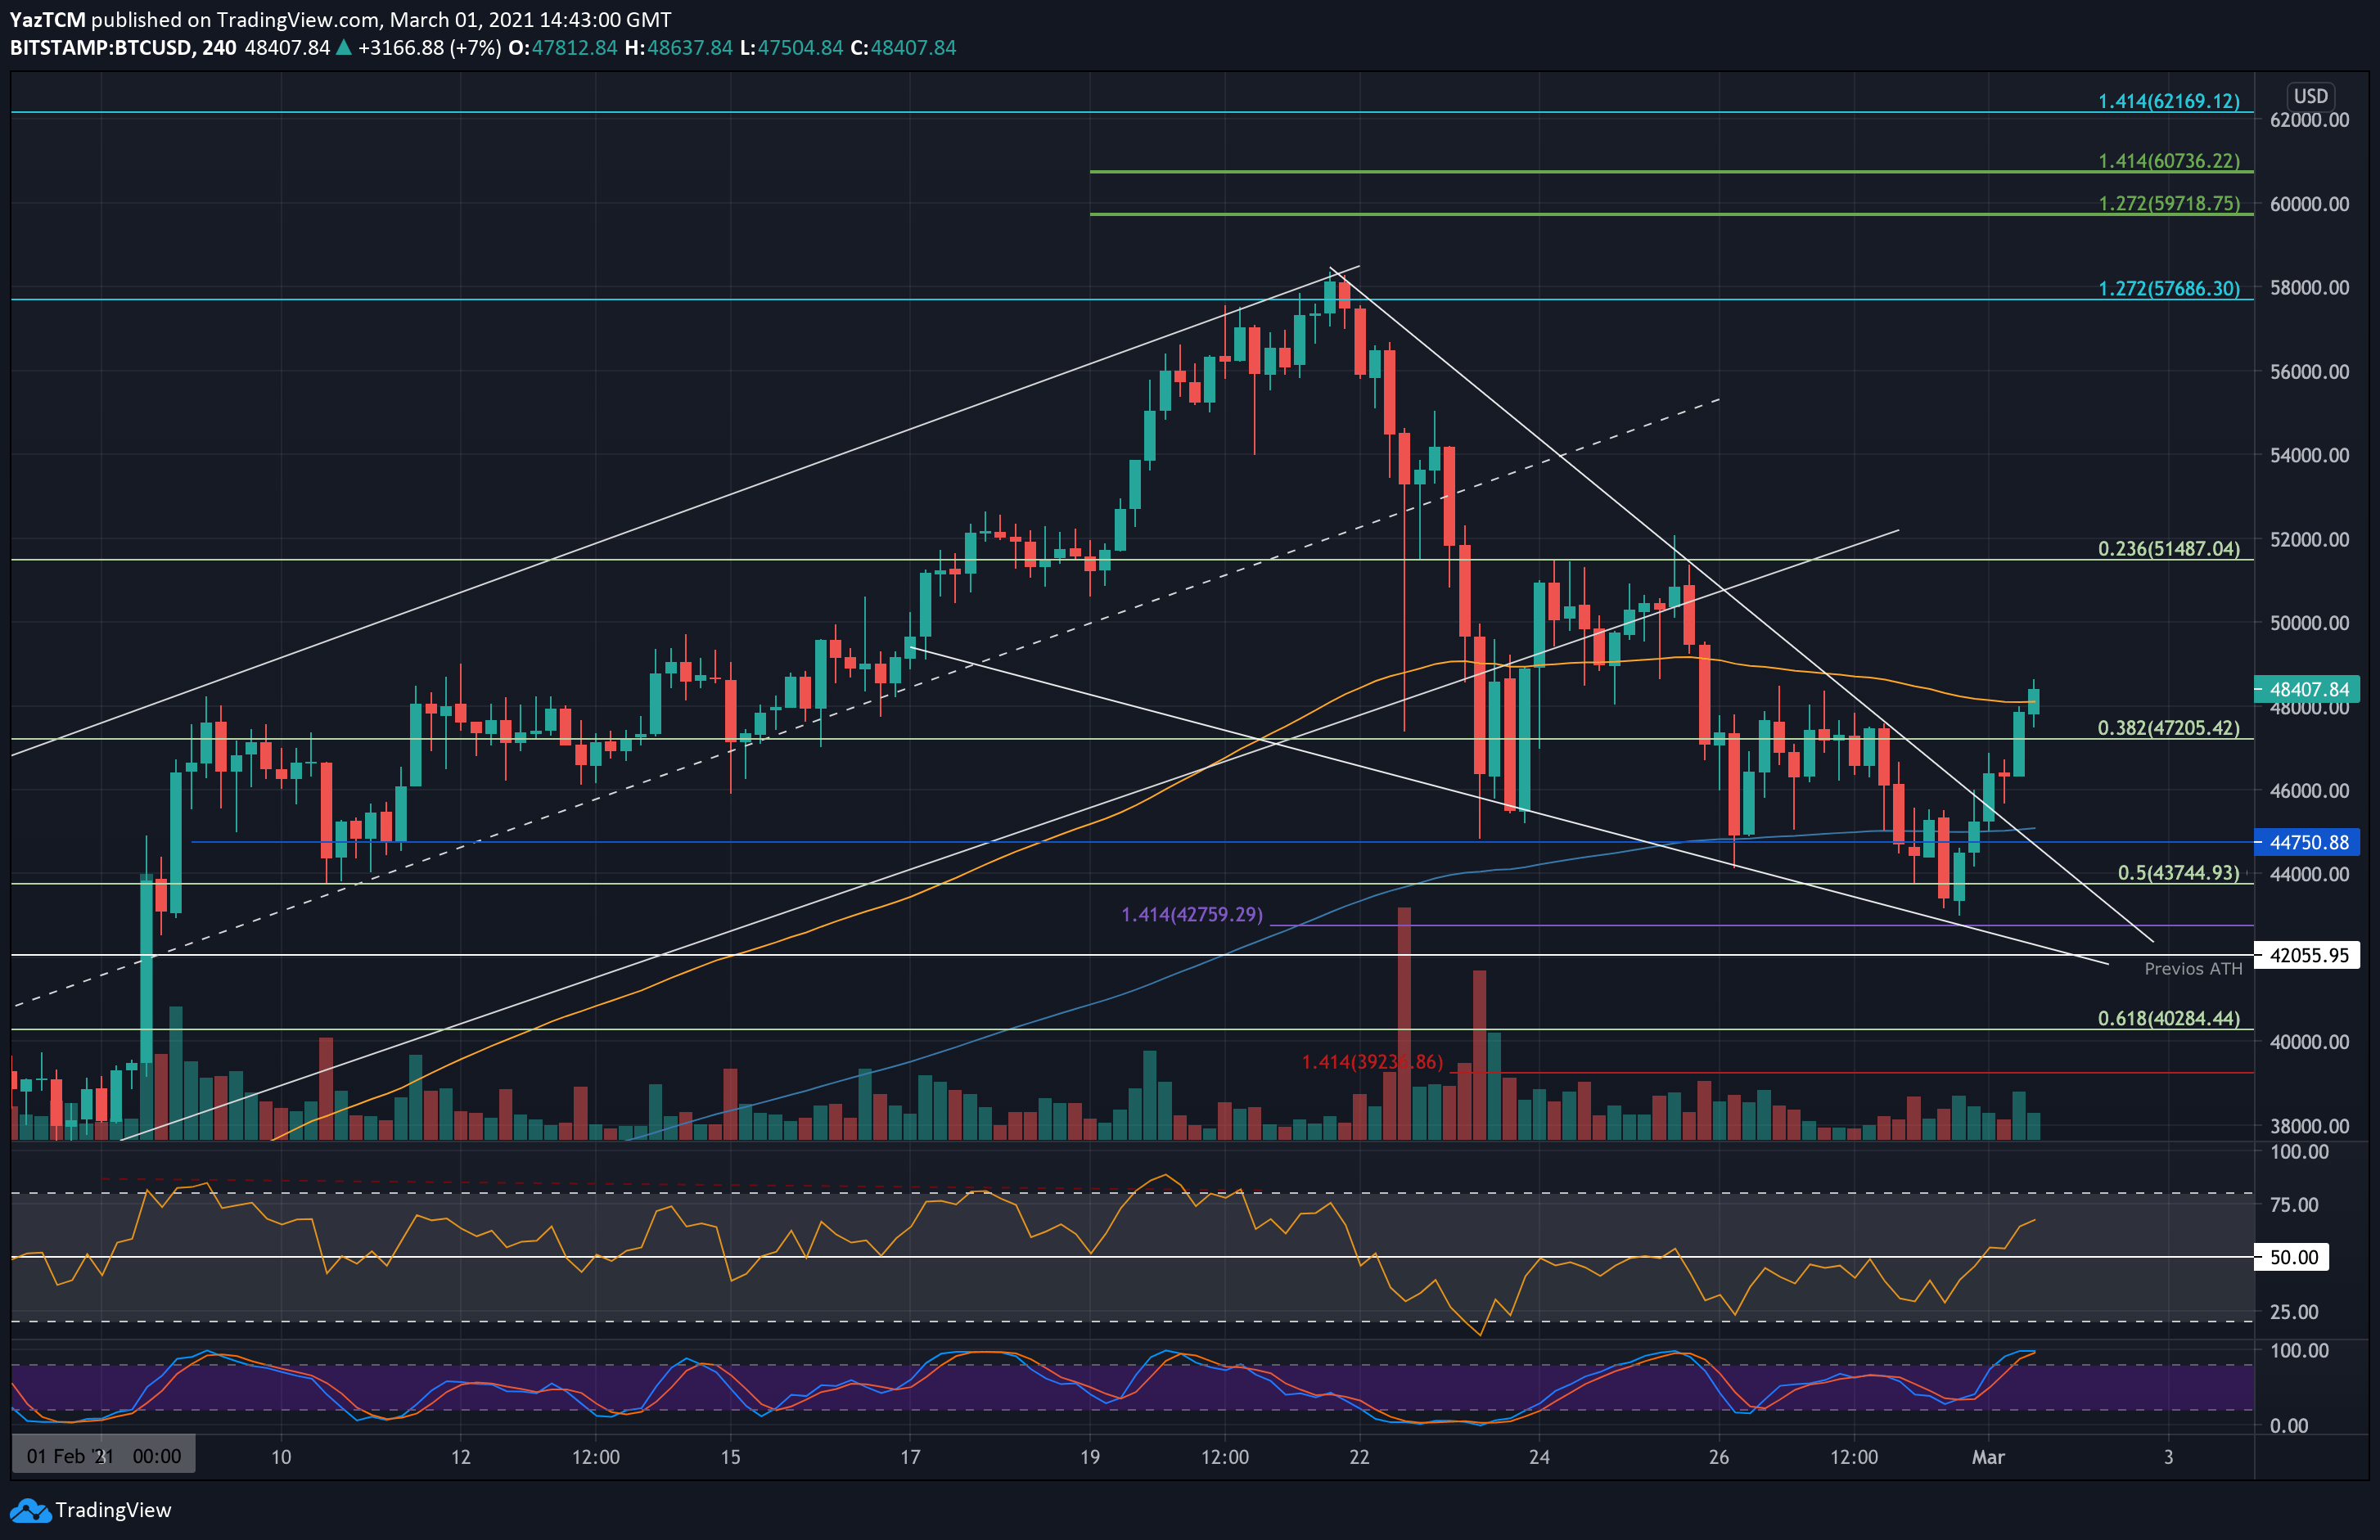
BTC/USD 4-Hour Chart. Source: TradingView
Bitcoin saw a strong rebound today as it recovered from yesterday’s low at $43,000 to over $48K, where it is trading as of writing these lines.
The cryptocurrency had been in a downtrend for the previous week as it dropped by over 25% to reach its weekly low yesterday, at the mentioned-above level of $43K (according to Bitstamp).
During the correction, Bitcoin had broken beneath an ascending price channel that it was trading within throughout February. However, over the past days, BTC was forming a falling wedge which is a textbook bullish formation. The wedge can be seen on the following 4-hour chart.
Alongside the pennant, there were hints of bullish divergence on the short-term timeframes, including the 4-hour, that we highlighted yesterday. After closing the daily candles for the previous two days at $44,750, the bullish divergence played out nicely today – allowing Bitcoin to break the wedge’s upper boundary, penetrate beyond the 4-Hour 20-EMA, and sharply climb above the $48,000 mark.
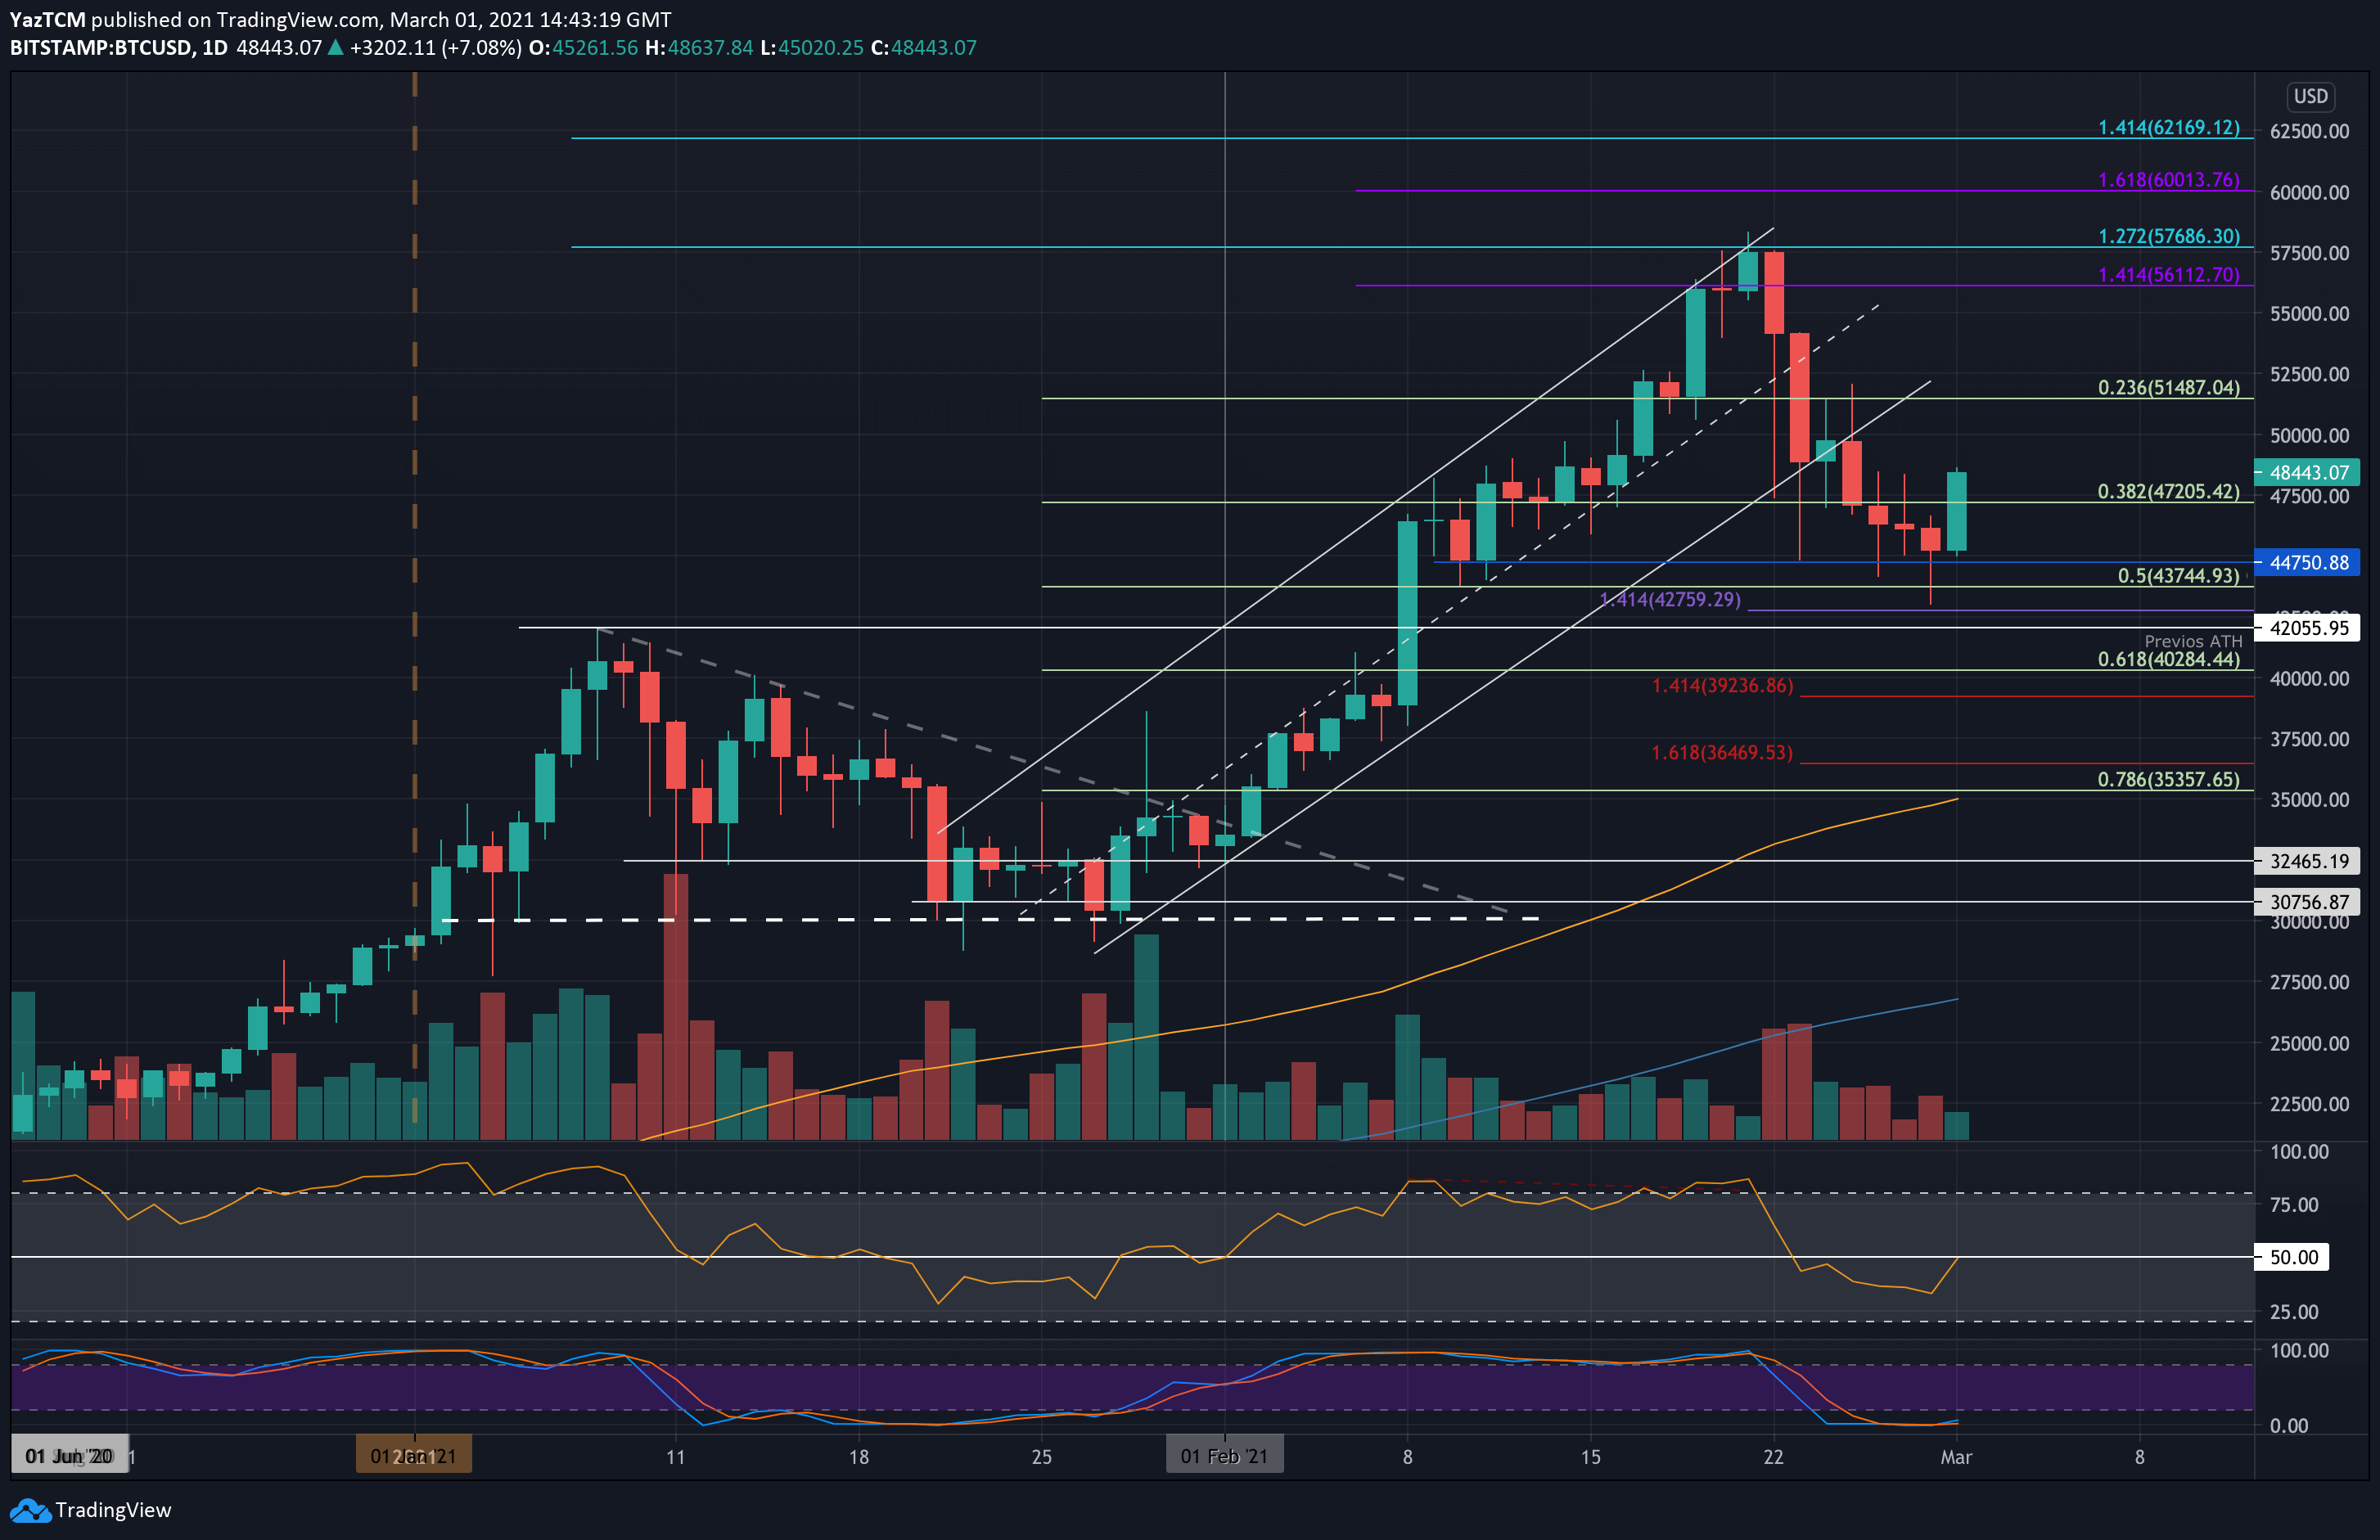
Now, the question is, whether Bitcoin will have enough power to penetrate the $50K psychological resistance level, and maybe aim at the current all-time high level of $58K, set just days ago on February 21, 2021.
Key Support Levels: $47,200, $46,600, $44,750, $43,745, $42,760, $42,000.
Key Resistance Levels: $50,000, $52,500, $55,000, $56,112, $57,960.
Moving forward, the first level of resistance lies at the benchmark level of $50,000. This is followed by $52,500 – the target of the wedge’s breakout, $55,000, $56,112 (1.414 Fib Extension – purple), and $57,690 (1.272 Fib extension – blue).
On the other side, the first support is now found at $47,200 (.382 Fib). This is followed by $46,600 (4-hour’s EMA-20), $44,750, $43,745 (.5 Fib), $42,760 (downside 1.414 Fib Extension), and $42,000 (previous ATH).
The daily RSI has now returned to the midline, indicating the previous bearish momentum has dissipated. The RSI is now above the midline on the short-term charts, indicating short-term bullish momentum is now present.