BTC/USD charts via Tradingview
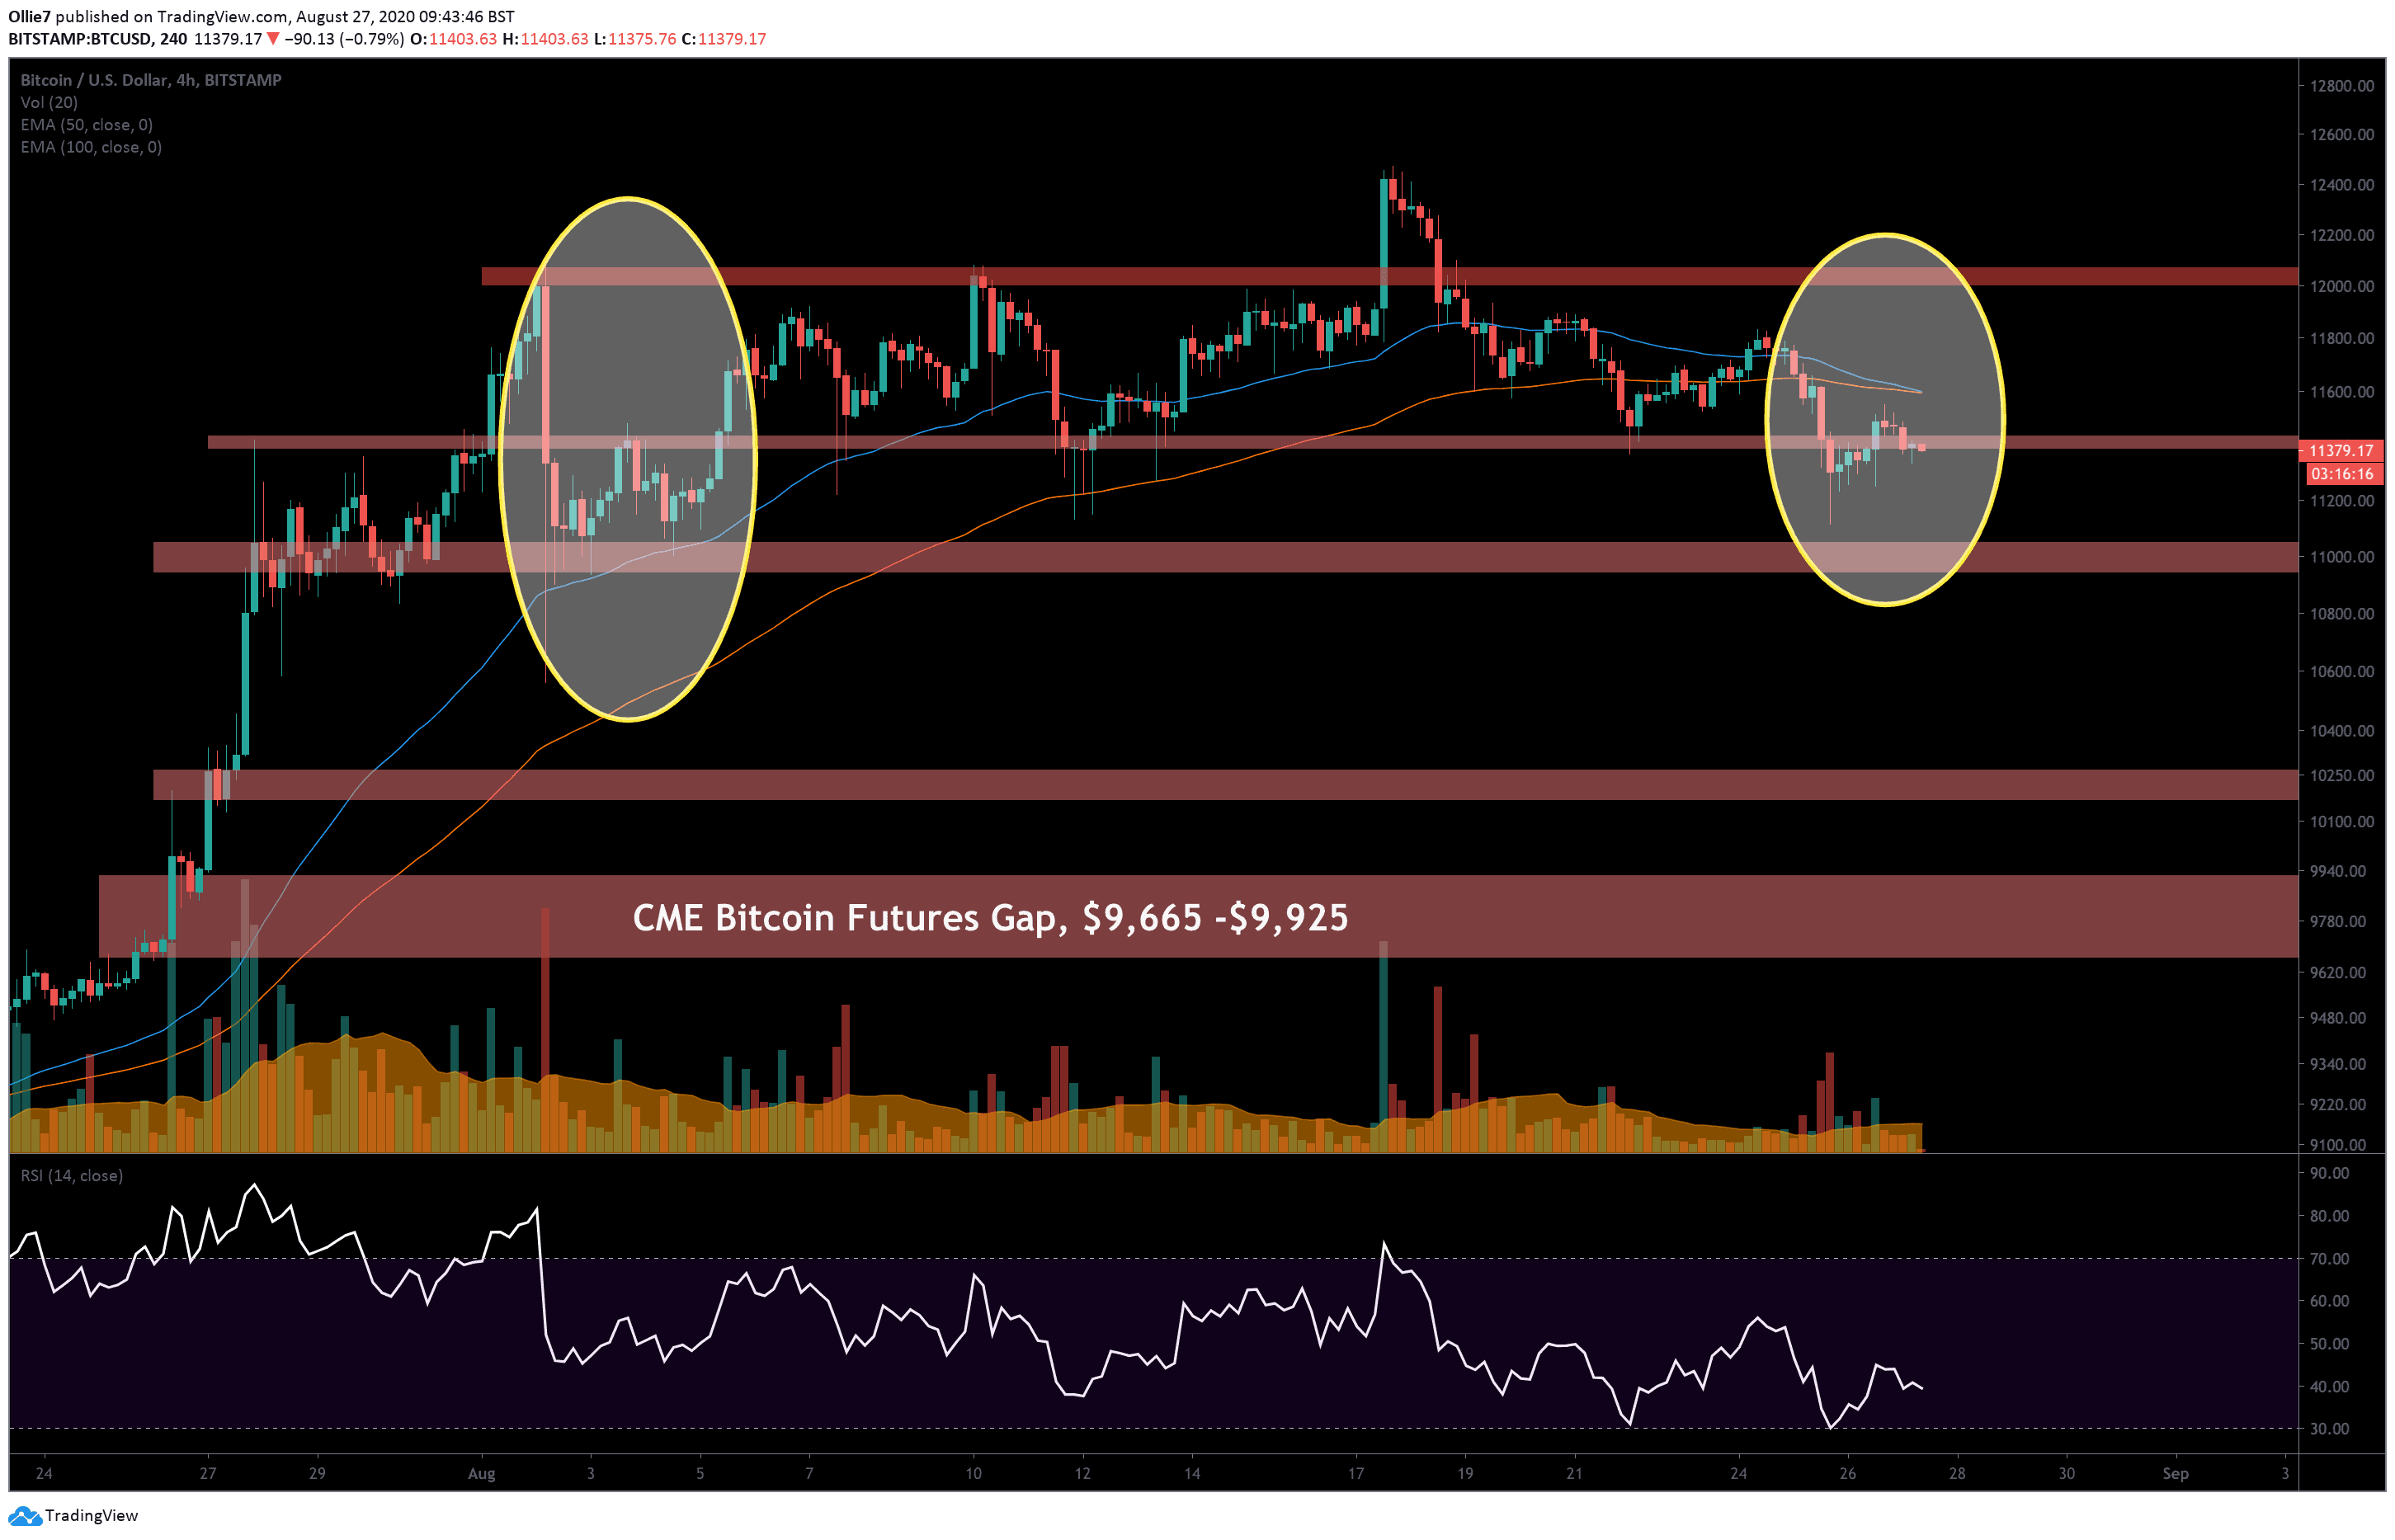
Bitcoin’s chart looks pretty interesting right now. On the 4-Hour BTC/USD, there is a clear bearish convergence forming between the 50 and 100 EMA lines for the first time since July 22.
This typically signals that there’s more downside to come as short-term momentum drops in comparison to the longer-range momentum.
However, looking more closely at today’s price action, there are some signs of hope that we might get a recovery shortly.
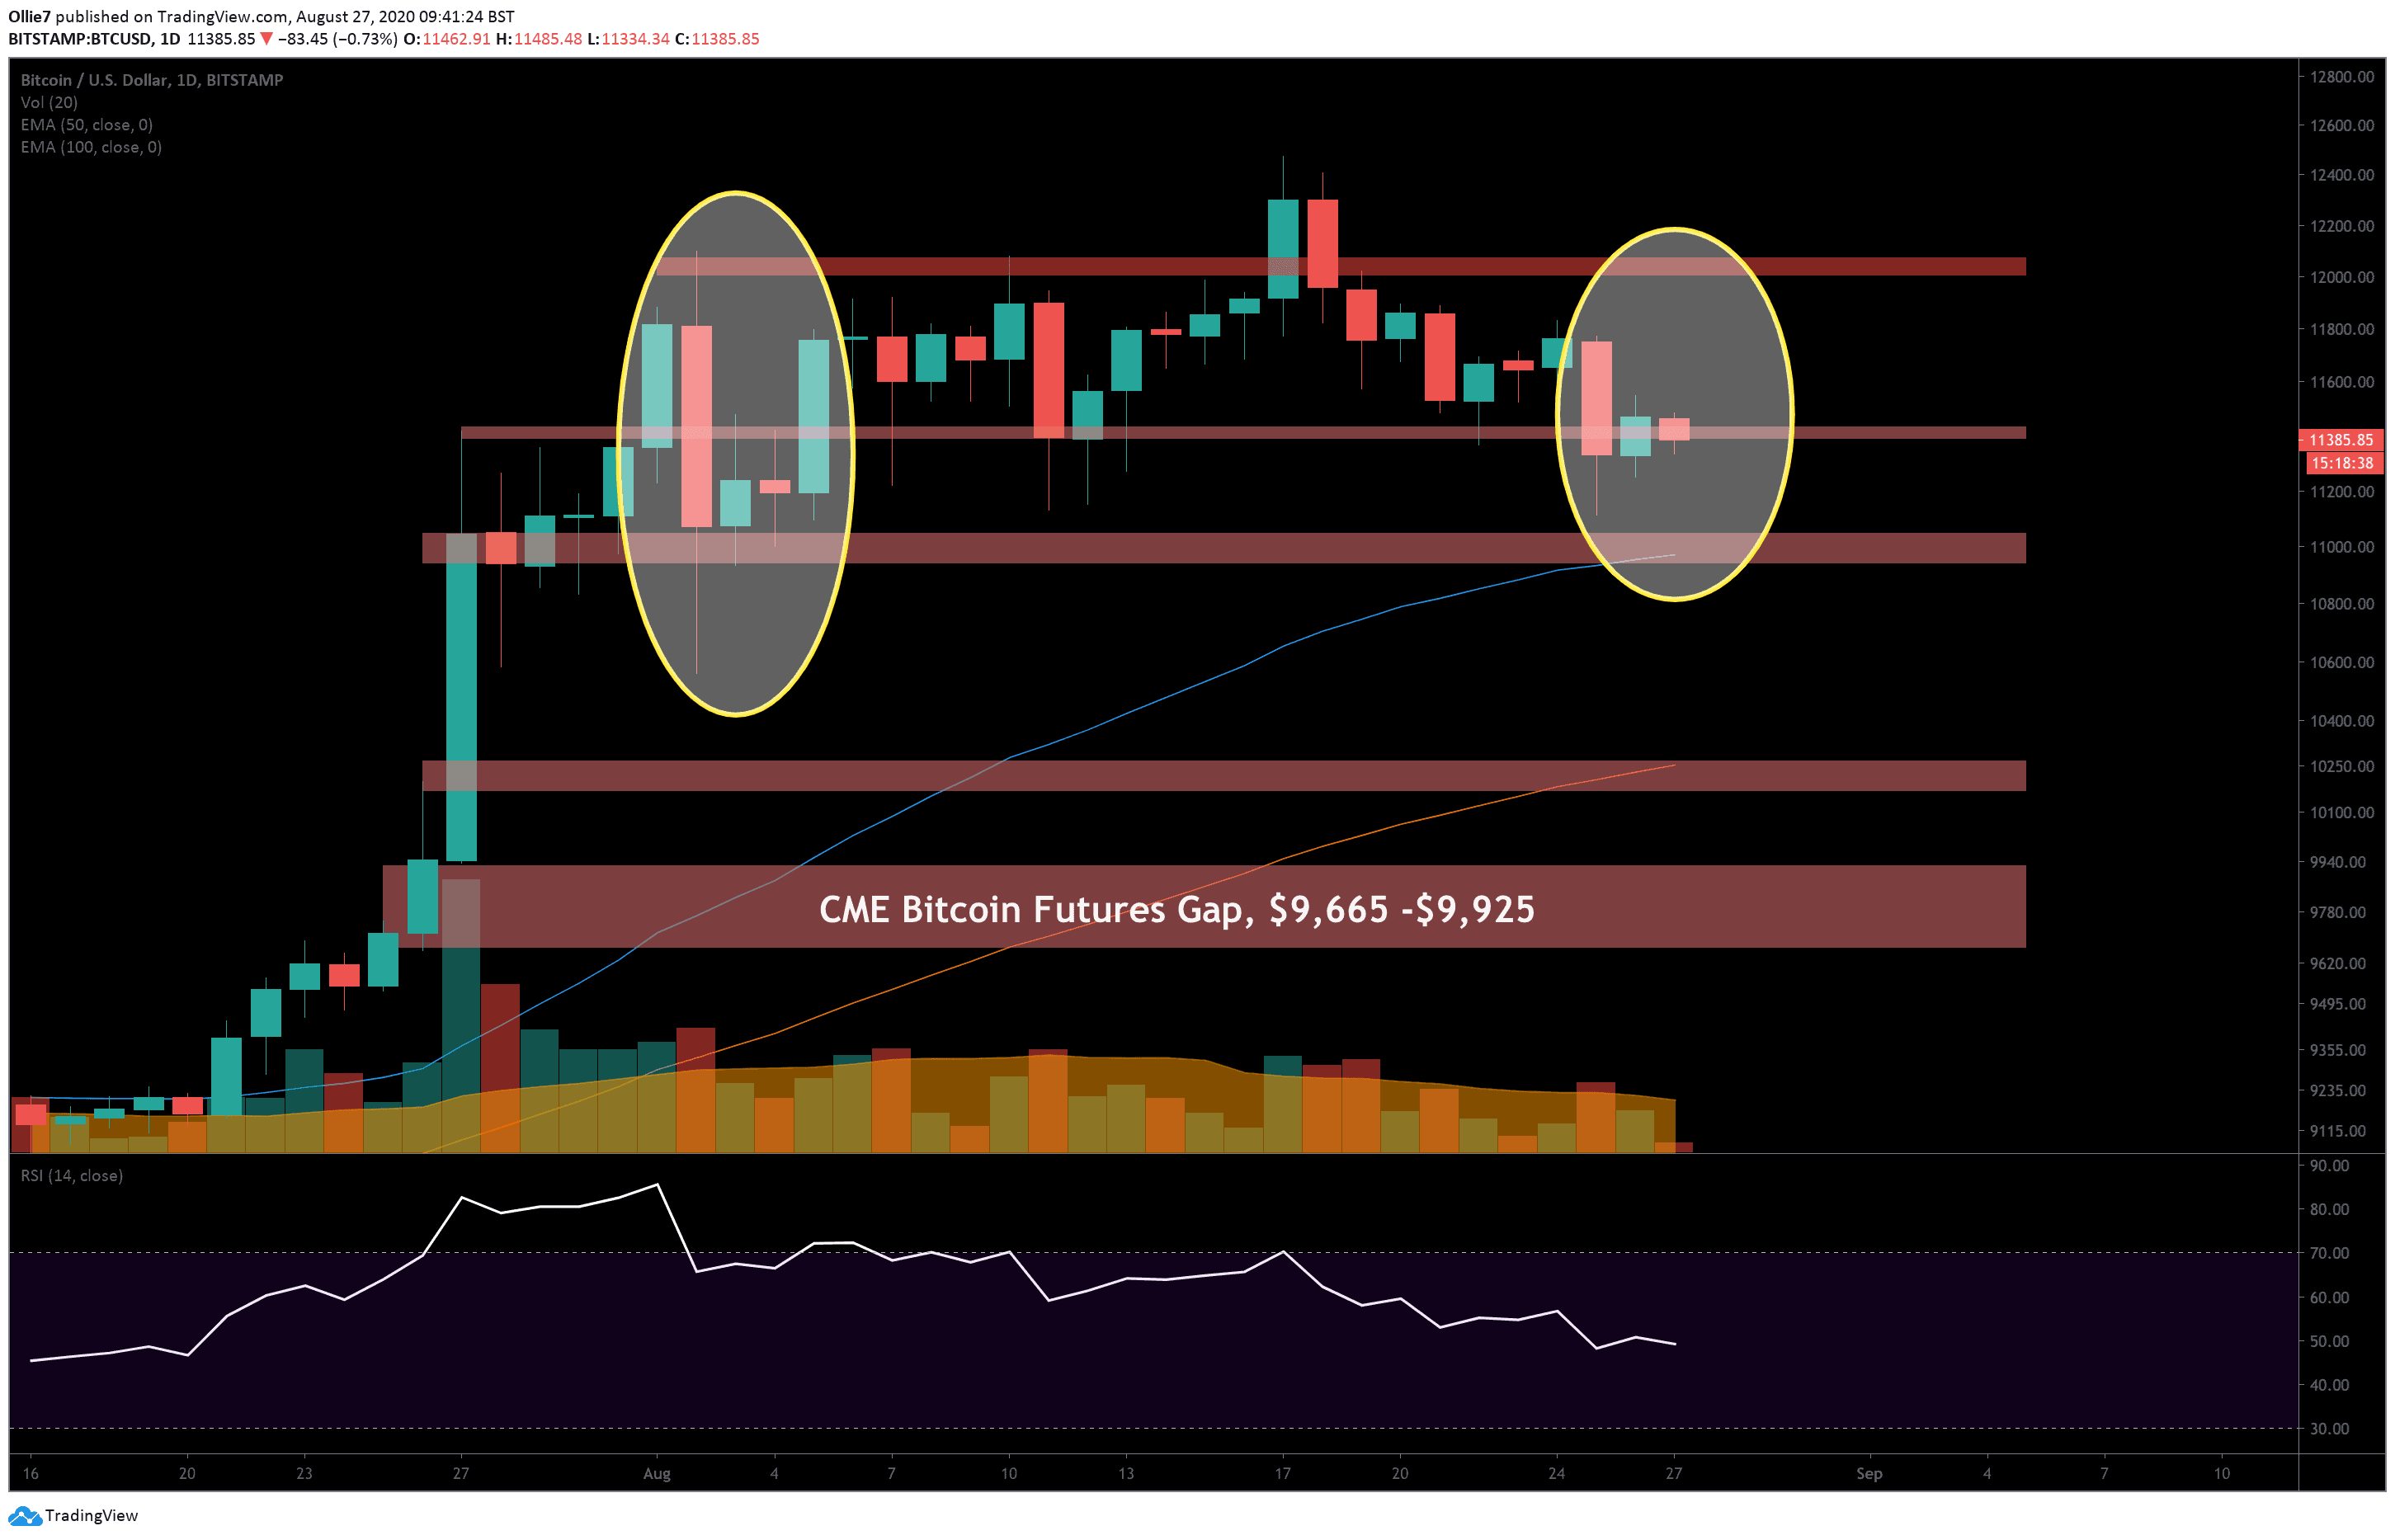
Bitcoin’s current trend is resembling the start of a whale manipulation pattern that we saw at the beginning of the month (see the marked yellow circles). If this is true, it could mean that BTC price will increase soon back over $11,600, and help bulls shake off the bearish EMA convergence.
On the daily BTC/USD chart, we can see that on August 2, the whale manipulation pattern completed itself as discussed in an analysis at the time. This pattern always has the same four characteristics that you need to be aware of:
1. A sharp decline, which retraces around 50% before closing.
2. Then, a short period of low volatility pushes the price action sideways.
3. The sideways volatility creates a lower low, followed by a higher low.
4. The pattern then completes by completely retracing back to the former high before the initial sharp decline.
Right now, we can see that Bitcoin’s price has already experienced a sharp decline of over 4%, which has since retraced. And BTC has already started to push sideways as market volatility slackens off.
On the 4-Hour chart, we can clearly see that we also have made a lower low followed by a higher low, which suggests that we should see a sharp rise back to around the $11,600 level next – if the pattern plays out.
This pump would drive BTC prices back above the pinching 50 and 100 EMA lines over this time frame, and should provide some support for bullish traders to recover along.
If a new uptrend emerges from this whale pattern, we will continue to watch the $11,800 and $12,000 as the first major areas of resistance. From there, bulls will almost certainly want to target the $12,470 resistance to set a new YTD-high.
If the pattern gets rejected, and BTC prices continue to fall instead of recover back to the former high, then the $11,200, $11,100 (this week’s low) and psychological $11,000 levels will likely be tested before the weekend. Further below lies $10,500 resistance turned support level, which was the prior 2020 high from mid-February.
Total market capital: $372 billion
Bitcoin market capital: $210 billion
Bitcoin dominance: 56.6%
*Data by Coingecko.