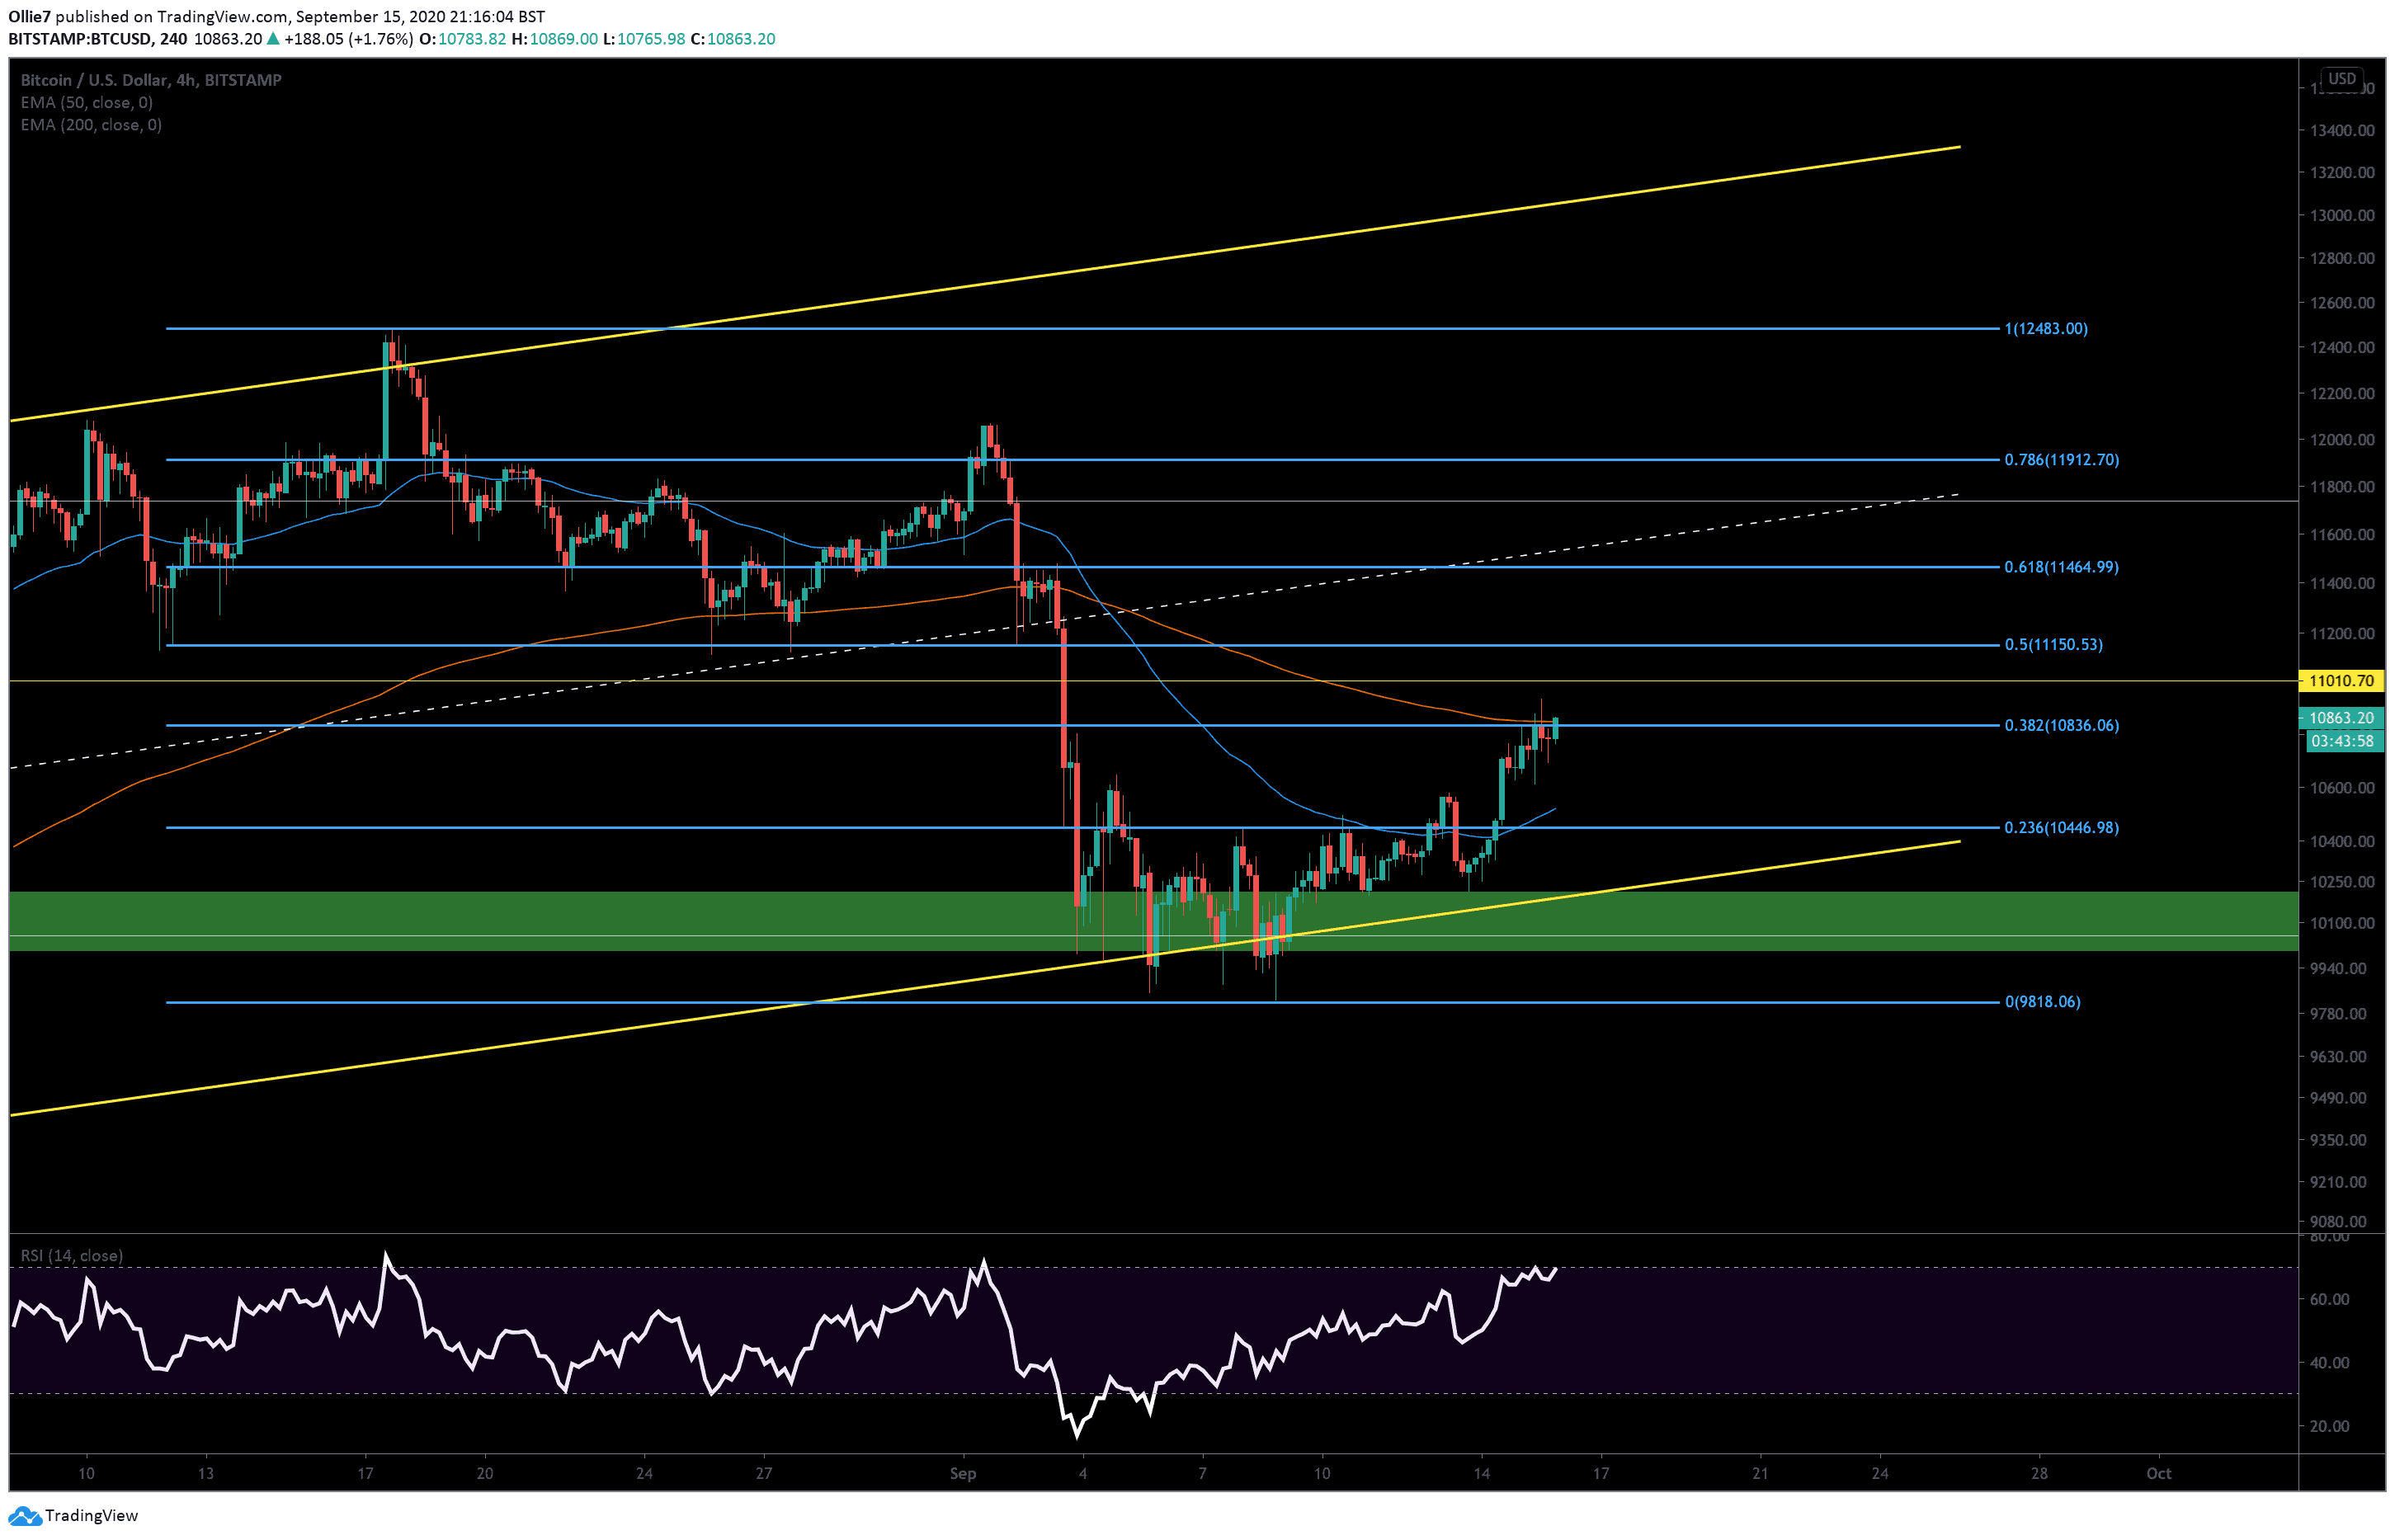
BTC/USD chart via Tradingview
Bitcoin is stealing all of the attention right now in the crypto market, with a 1.6% gain over the past 24 hours while most altcoins have plunged into the red.
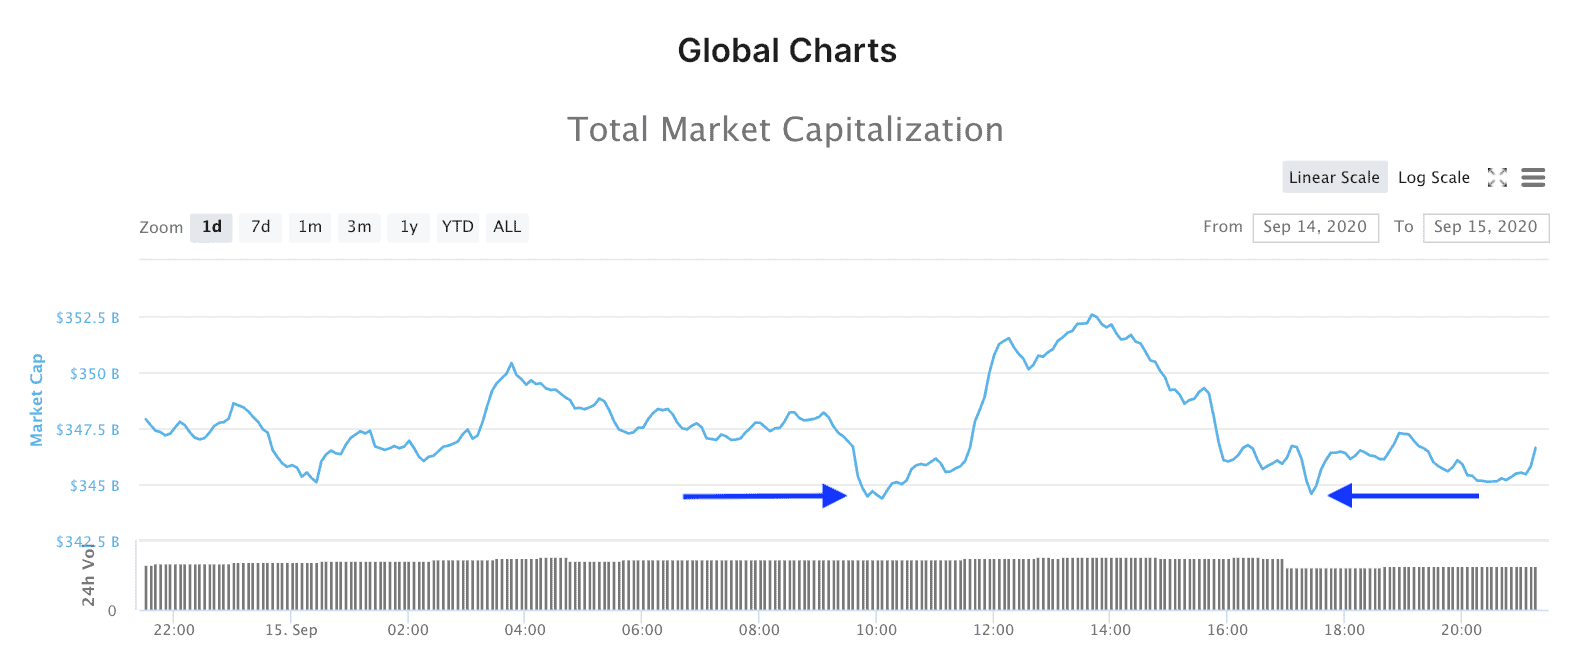
According to Coinmarketcap data, $8 billion was added to the market today from 10:00 to 13:45 (UTC+1) and then quickly evaporated 4 hours later. The chart reveals the total crypto market cap was at exactly $344 billion before the sudden $8 billion influx and was exactly $344 billion after the correction had occurred.
Whether this is merely a coincidence or an orchestrated event, it’s difficult to say. However, all we do know is that with the psychological $11K target well within sight now, it seems that a vast majority of traders are liquidating their other cryptocurrencies and piling into the BTC mini bull run.
On the following 4-hour BTC/USD chart, we can see that the current uptrend has run into a concrete wall of selling pressure at the 0.382 Fibonacci level ($10,836), which overlaps with the 200-day EMA.
This key area was mentioned in yesterday’s analysis as a likely area of resistance. It will now be even more challenging to overcome now that BTC is right on the cusp of breaking into the overbought region on the RSI indicator.
The RSI is an incredibly popular trading indicator and usually triggers trading bots to sell once the asset breaks over the 70 levels. If the correction is large enough, it can also trigger stop losses and cause the prices to plummet even further.
If bulls are able to break through this area, however, then we should anticipate more selling pressure at $11K (yellow horizontal line) as traders anticipated to take profit.
From there, the 0.5 Fibonacci level at $11,150 will be the next likely resistance if the uptrend continues, followed by the 0.618 level at $11,464.
If the bulls fail to break above the current major resistance zone, and the trend reverses, then we may see the $10,700 prop up prices briefly before BTC comes into contact with the stronger 50-EMA (blue line) support beneath.
Underneath that, the 0.236 Fibonacci level (~$10,400 – previous resistance turned support level) should also provide a solid foothold for bullish traders to rebound from now that it’s flipped from resistance to support.
Total market capital: $353 billion
Bitcoin market capital: $200 billion
Bitcoin dominance: 56.8%
*Data by Coingecko.