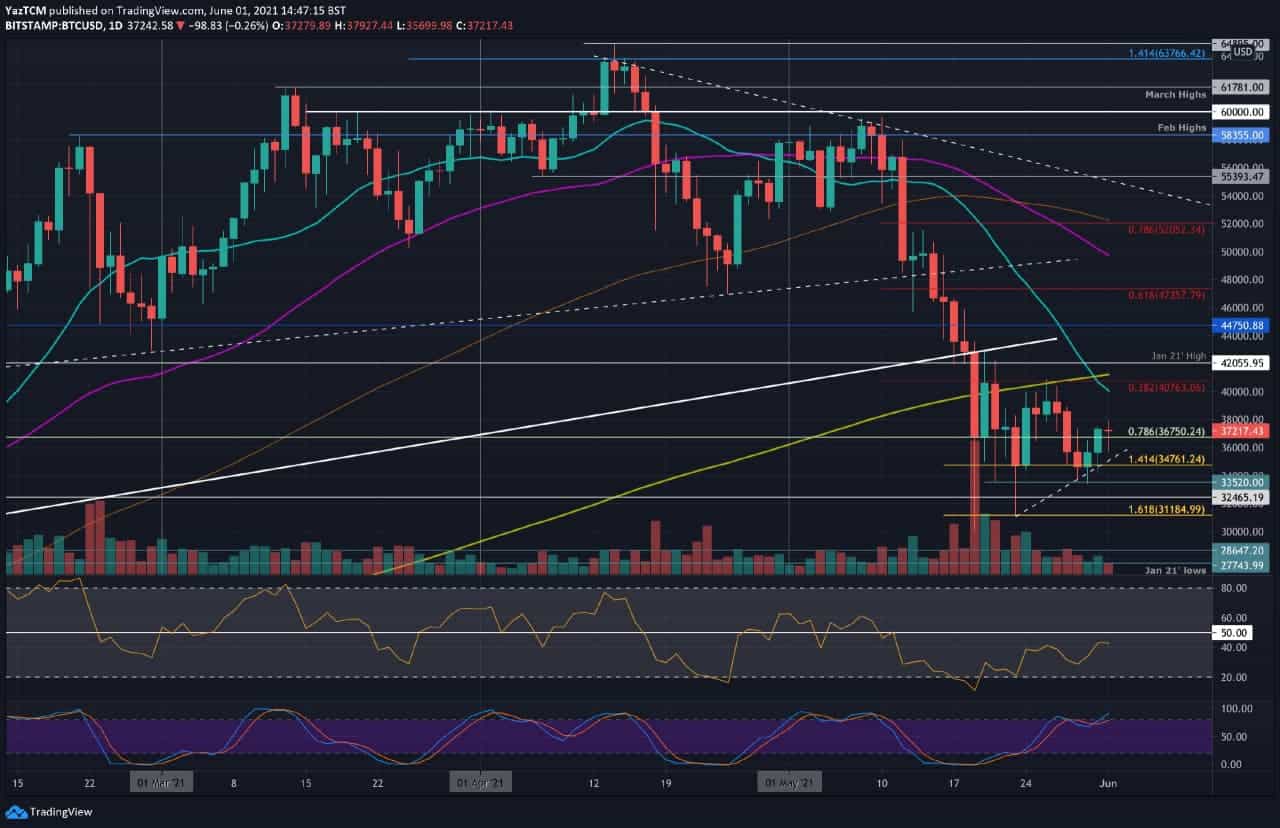
BTC/USD Daily Chart. Source: TradingView
Bitcoin is down by a sharp 3% over the past 24 hours.
The cryptocurrency bounced from $31,185 (downside 1.618 Fib Extension) last week but failed to overcome resistance at $40,765 (bearish .382 Fib & 200-day MA).
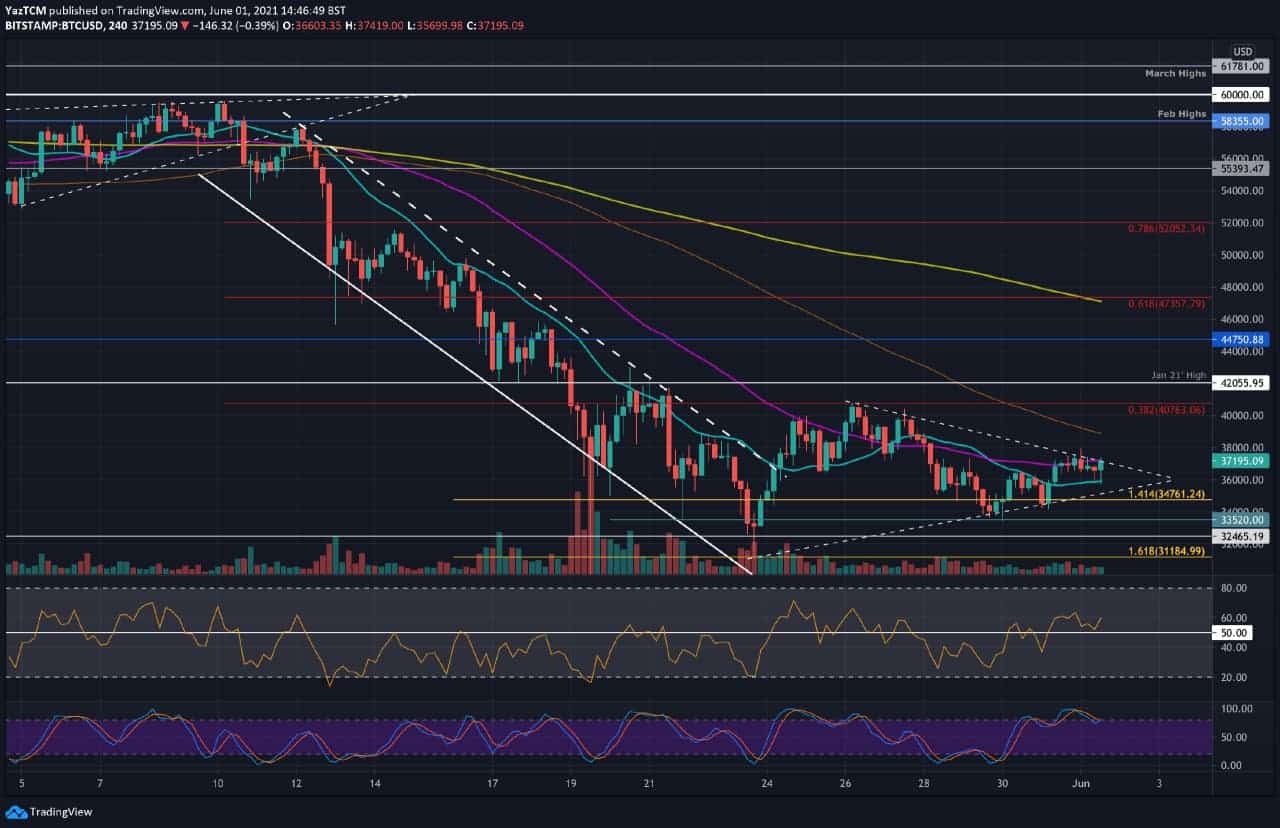
From there, BTC headed lower into the weekend but sustained support at $34,760 after spiking as low as $33,520. The daily chart looks pretty choppy, but the short-term 4-hour chart provides a clear symmetrical triangle pattern forming.
Yesterday, BTC bounced from the lower boundary of this triangle and reached the upper angle ($38K). The price was rejected at the upper angle and started to head lower from there. The market is now attempting to defend support of around $36,000 – provided by a short-term .5 Fib level.
A breakout of this short-term triangle will dictate the next direction for the market. A break toward the downside is likely to see BTC retesting $30,000 again, with a break toward the upside should set the stage for a recovery back above $40,000. We won’t have to wait long for this triangle to be resolved as the apex is set for June 3rd and the breakout typically occurs prior to the apex.
Key Support Levels: $35,100, $34,760, $34,000, $33,250, $32,465.
Key Resistance Levels: $37,200, $38,000, $40,000, $40,765, $41,200.
Looking ahead, the first support lies at $35,100 (lower angle of the the triangle. This is followed by $34,760 (downside 1.414 Fib Extension), $34,000, $33,250, and $32,465. Additional support lies at $32,000 and $31,185 (downside 1.618 Fib Extension).
On the other side, the first resistance lies at $37,200 (upper angle of the triangle). This is followed by $38,000, $40,000 (20-day MA), $40,765 (bearish .382 Fib), $41,200 (200-day MA), and $42,000 – which is the most critical level for the midterm.
The daily RSI remains sluggish as it sits in bearish territory. It is rising and created a higher high recently. However, it seems as if the bulls are still unable to create any form of sustained momentum just yet.