The last day will not surprise those who are following CryptoPotato since 2016, or those of you who had witnessed at least one real Bitcoin bull-run.
When the primary currency decides to turn on its engines – it does it faster than any other asset existing on Earth, or on the blockchain. Bitcoin is now fully recovered from the COVID-19 damage, long before the stock markets.
This is the advantage of being a free market’s asset. The same advantage that caused Bitcoin to sink over 50% on March 12 and traders complained why there is no trading-stop mechanism during severe drops, just like on Wall Street.
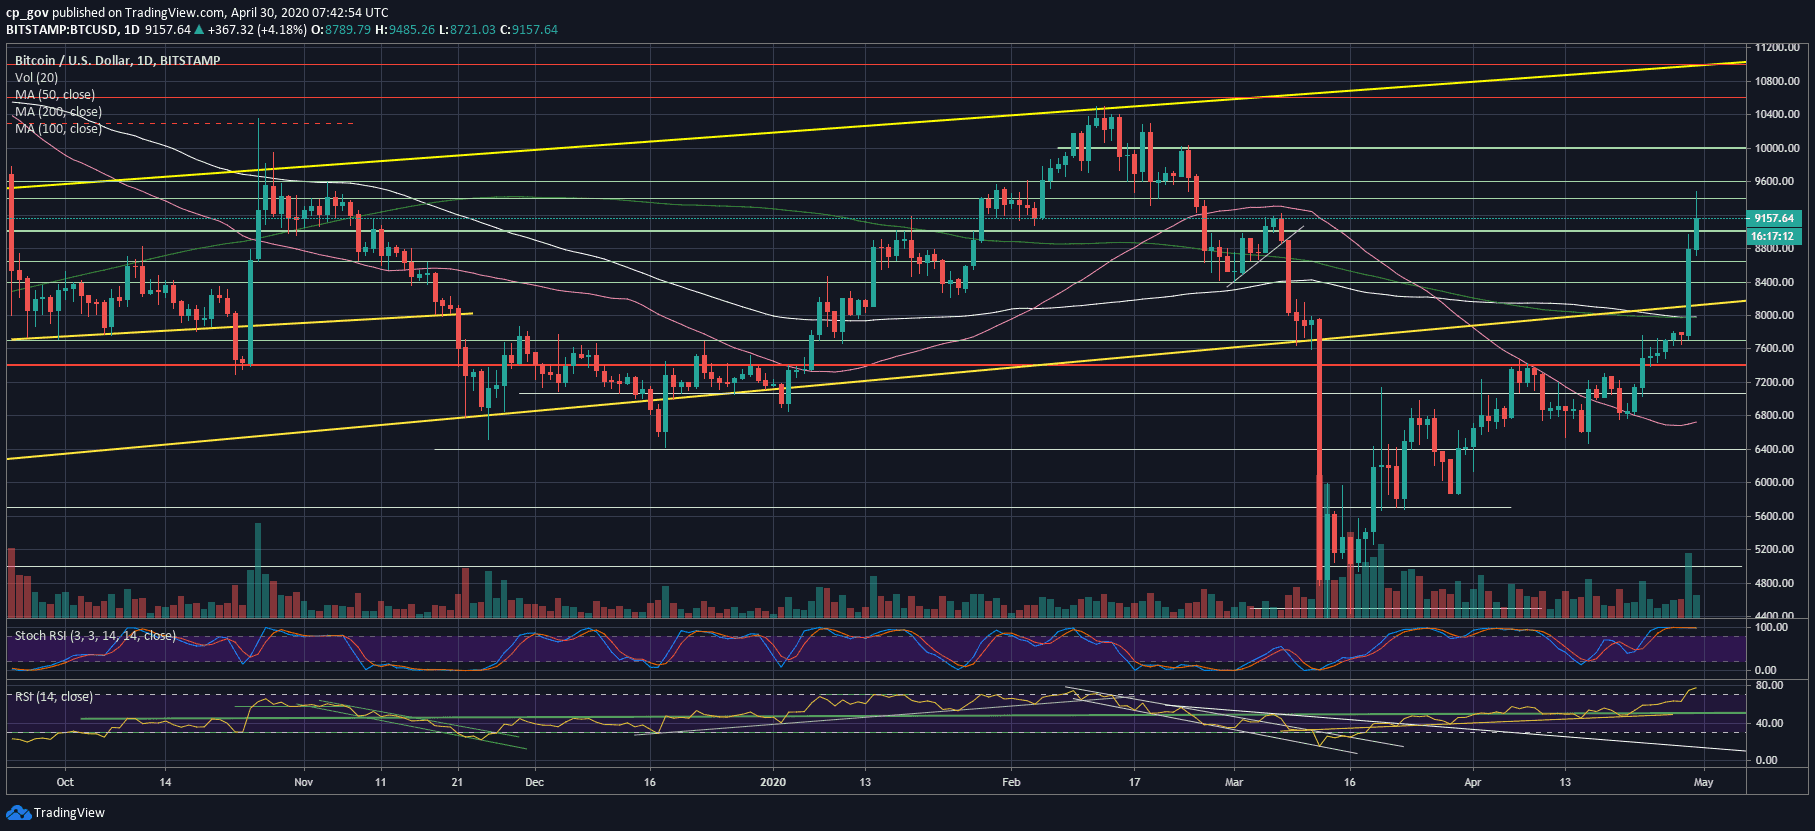
After breaking one resistance after another, including the significant 200-days moving average line back at $8K (the green line on the following daily chart), Bitcoin is now remarkably close to regaining the 5-digit mark.
However, before $10,000, there is a significant resistance area around $9600 Bitcoin will have to break. Besides, it is always better to see a steadily built uptrend instead of a violent move like we had seen over the past 24 hours.
The “October 26 Chinese Pump” saw Bitcoin raising 42% in just a day. However, it took Bitcoin no more than 30 days to get back into the levels before this Chinese pump had started.
The technical indicators are well over-extended, the volume is here to declare on an official end of this bear market, but unlike the Chinese Pump, Bitcoin better creates a higher low somewhere in the middle of the way ($8600 – $9000) in order to initiate a new healthy long-term rising trend-line.
Total Market Cap: $260.7 billion
Bitcoin Market Cap: $171.3 billion
BTC Dominance Index: 65.6%
*Data by CoinGecko
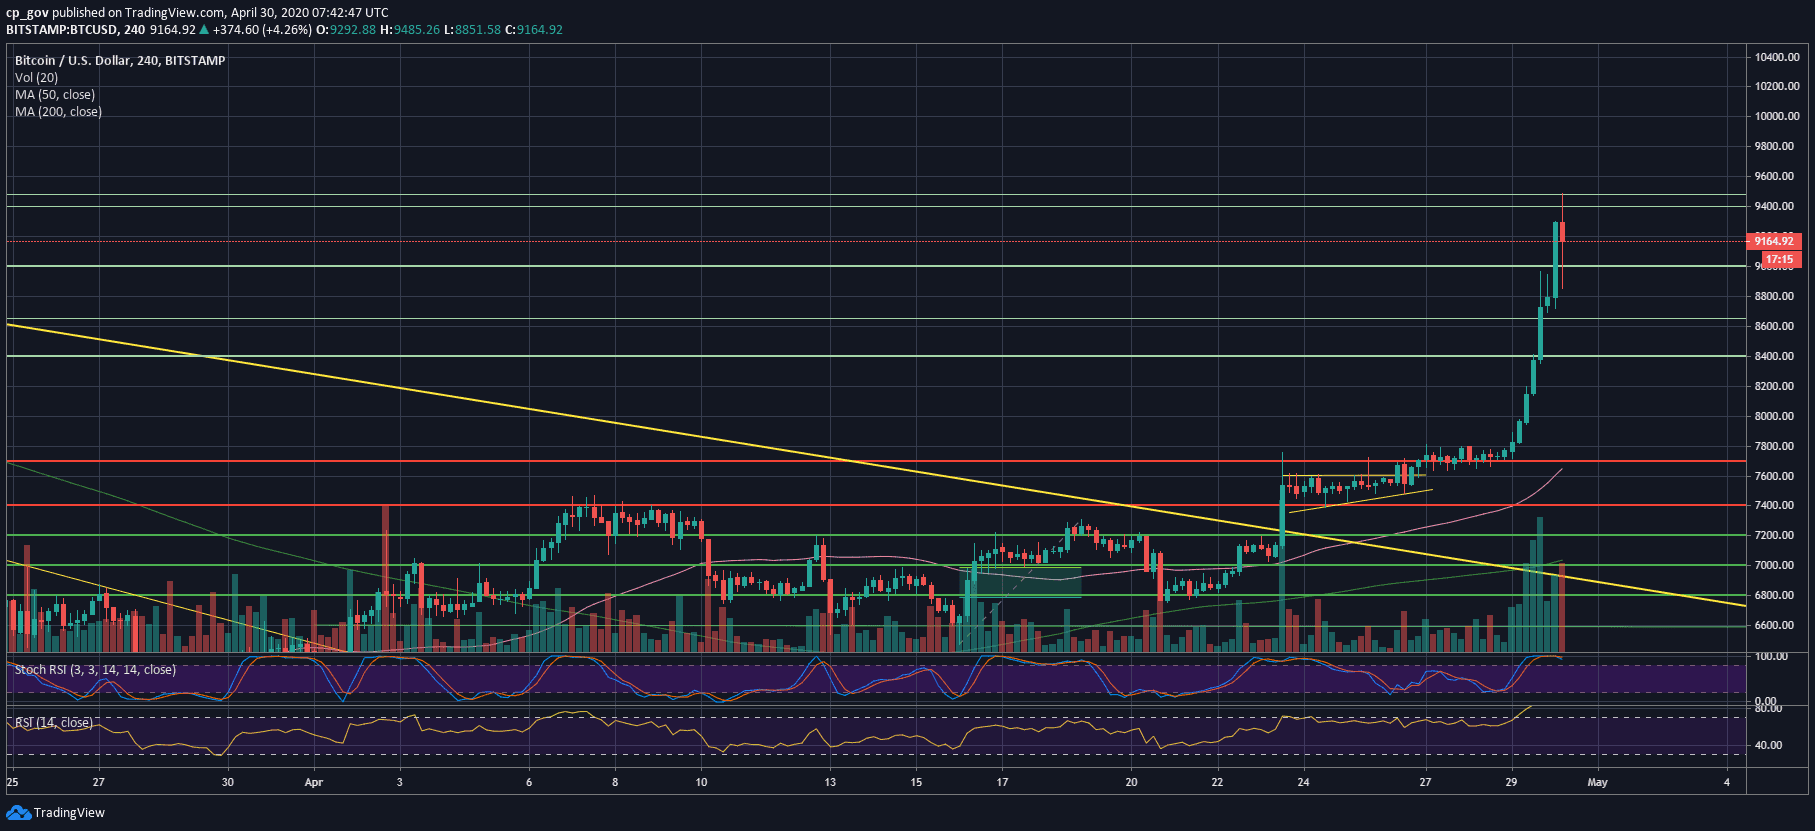
– Support/Resistance levels: As of writing these lines, the highest mentioned resistance from yesterday at $9400, had been achieved and currently is the new high.
This is the first level of resistance. Further above lies $9600, which was a past consolidation zone, mainly during the previous November.
Further above, we can expect some resistance at $9800, before reaching $10K. In case Bitcoin breaks above, the next significant level of resistance would be $10,300.
From below, the initial level of support now becomes the $9000 area, followed by $8650 – $8800. Further below lies resistance turned support levels at $8400 and $8200.
– The RSI Indicator: As mentioned above, the RSI is over-extended. Apparently, if we want to check when was the last time the momentum indicator was trading above 75, we need to go back all the way to June 2019, while Bitcoin was trading around $13,880 (the yearly high).
The Stochastic RSI oscillator is well overextended both on the 4-hour and the daily chart. A correction is needed. The question is when.
– Trading volume: The daily volume was declining since March 12, 2020, until yesterday. Wednesday’s volume was Binance’s highest ever volume day. And when that happens, you know that the bulls are back.