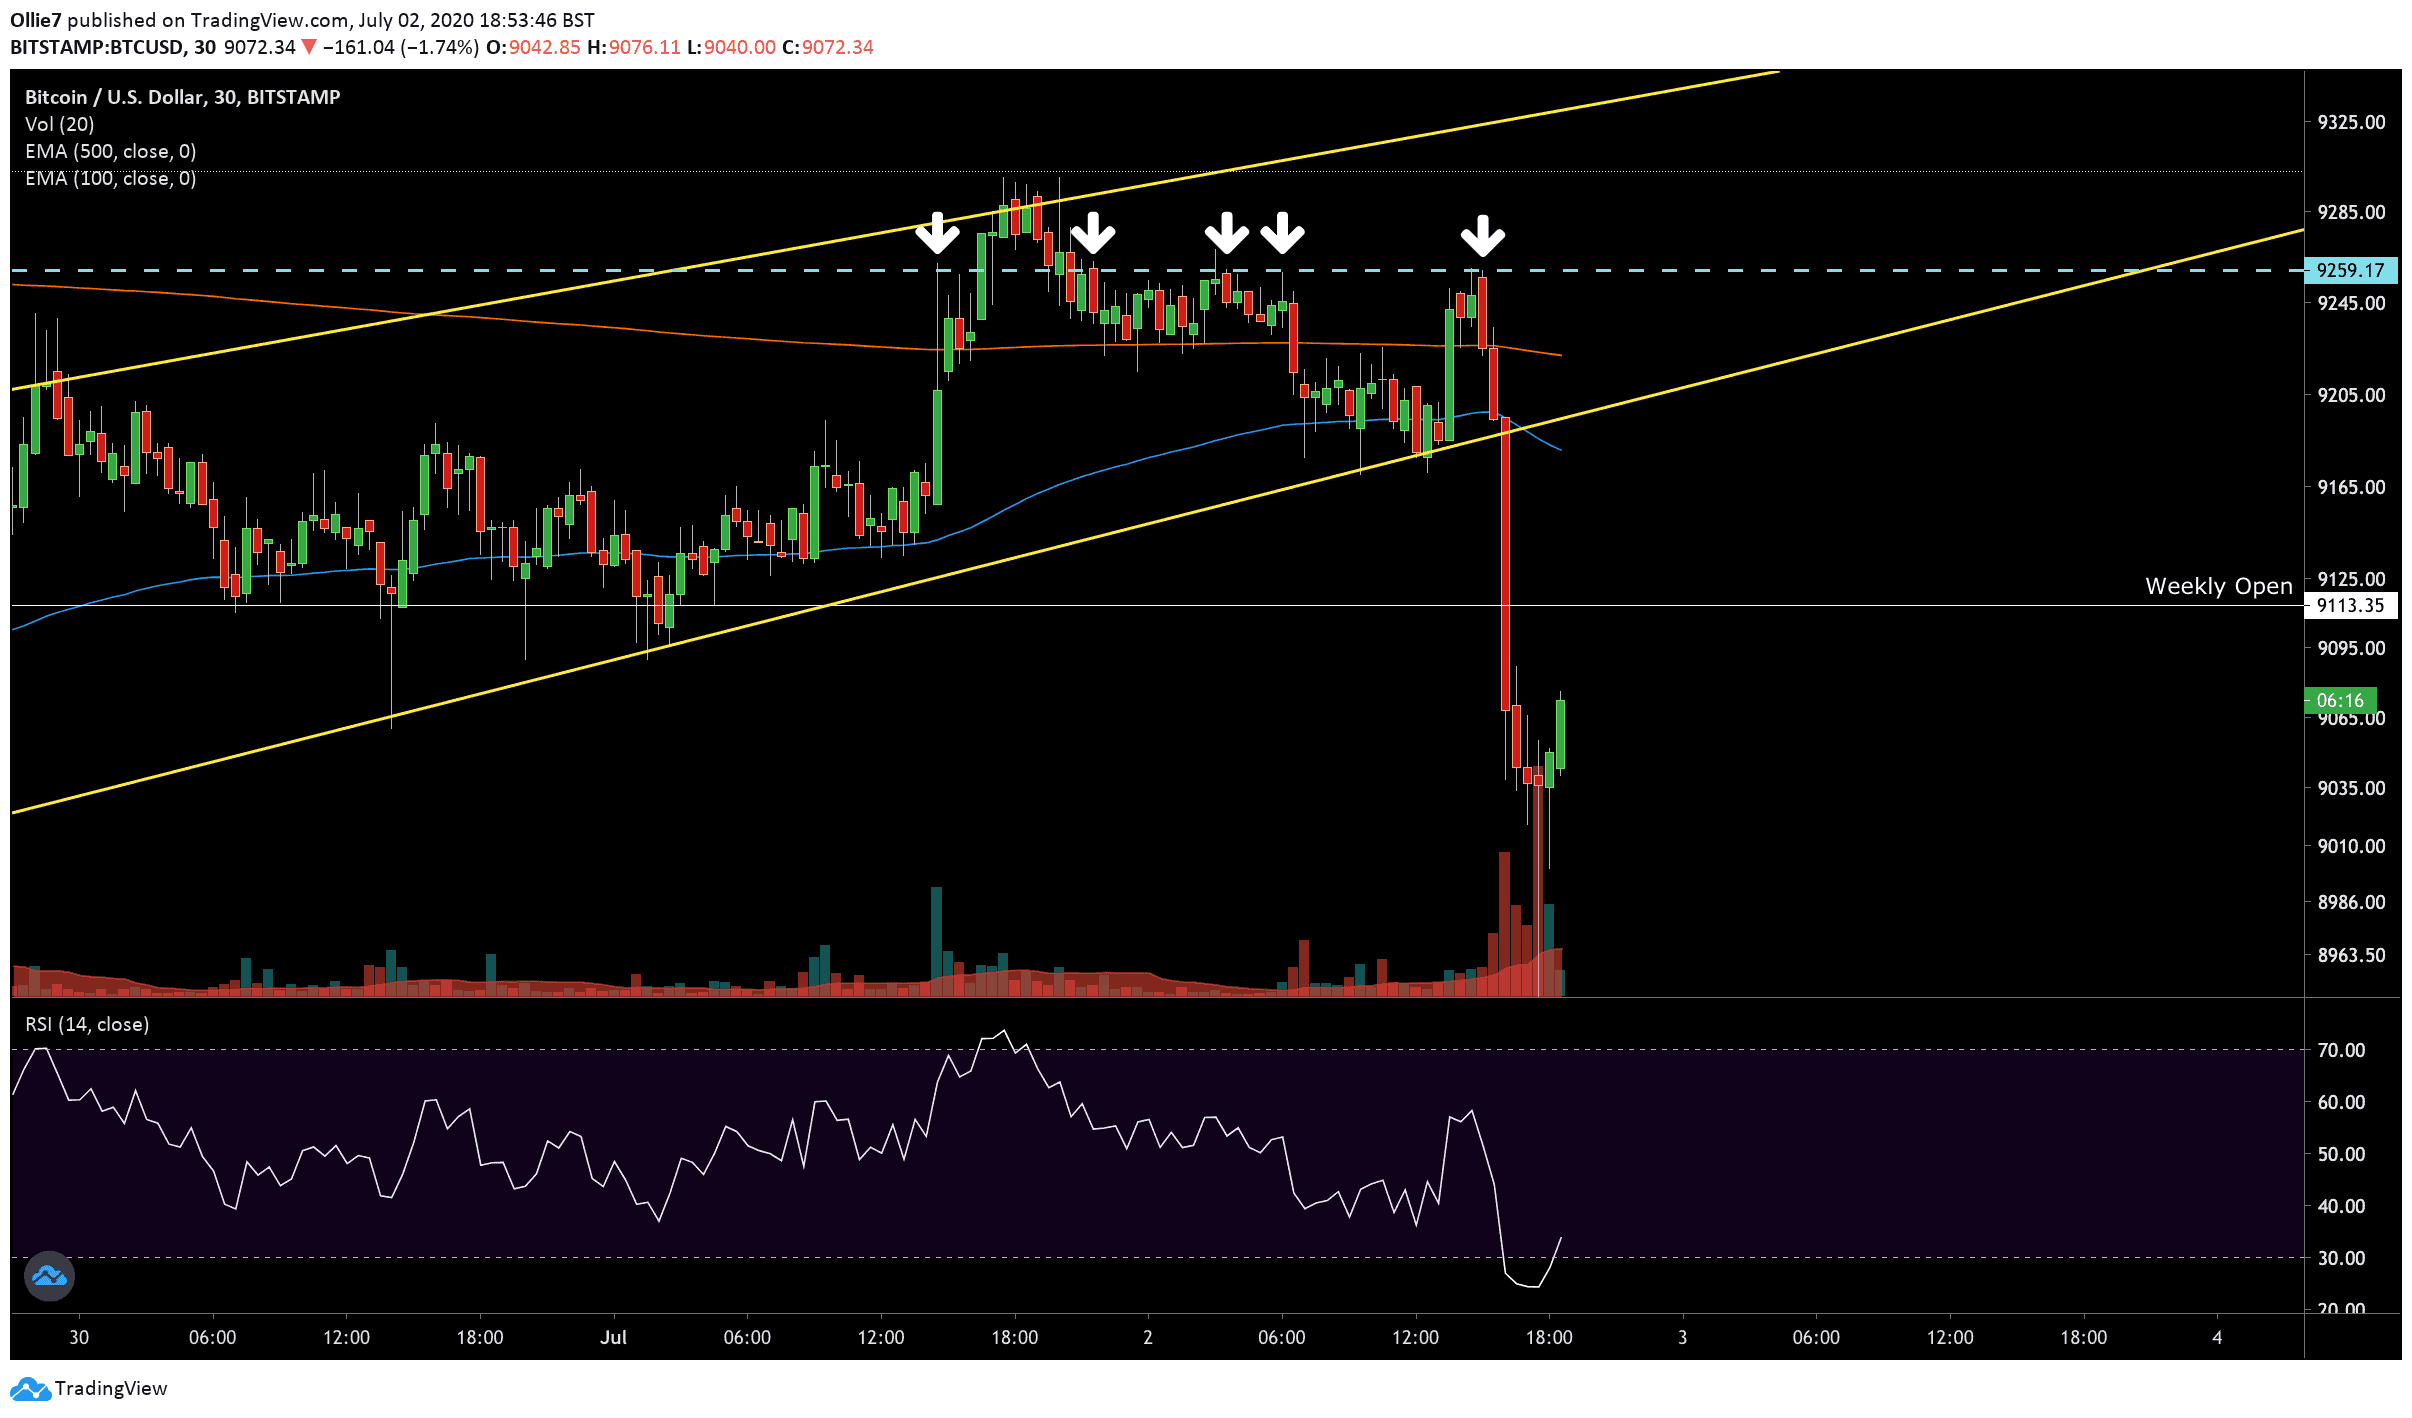
BTC/USD 30-min chart, Bitstamp
Bitcoin bears appear to have come out of hibernation today. According to the latest data from Glassnode, Bitcoin hourly addresses hit 2-year high today and hourly active addresses set at a new yearly high.
While these figures might sound promising, they have coincided with a steep $300 crash in Bitcoin’s price over a 2.5 hour period. So far, the leading crypto’s market cap has fallen by over $4 billion over the past several hours.
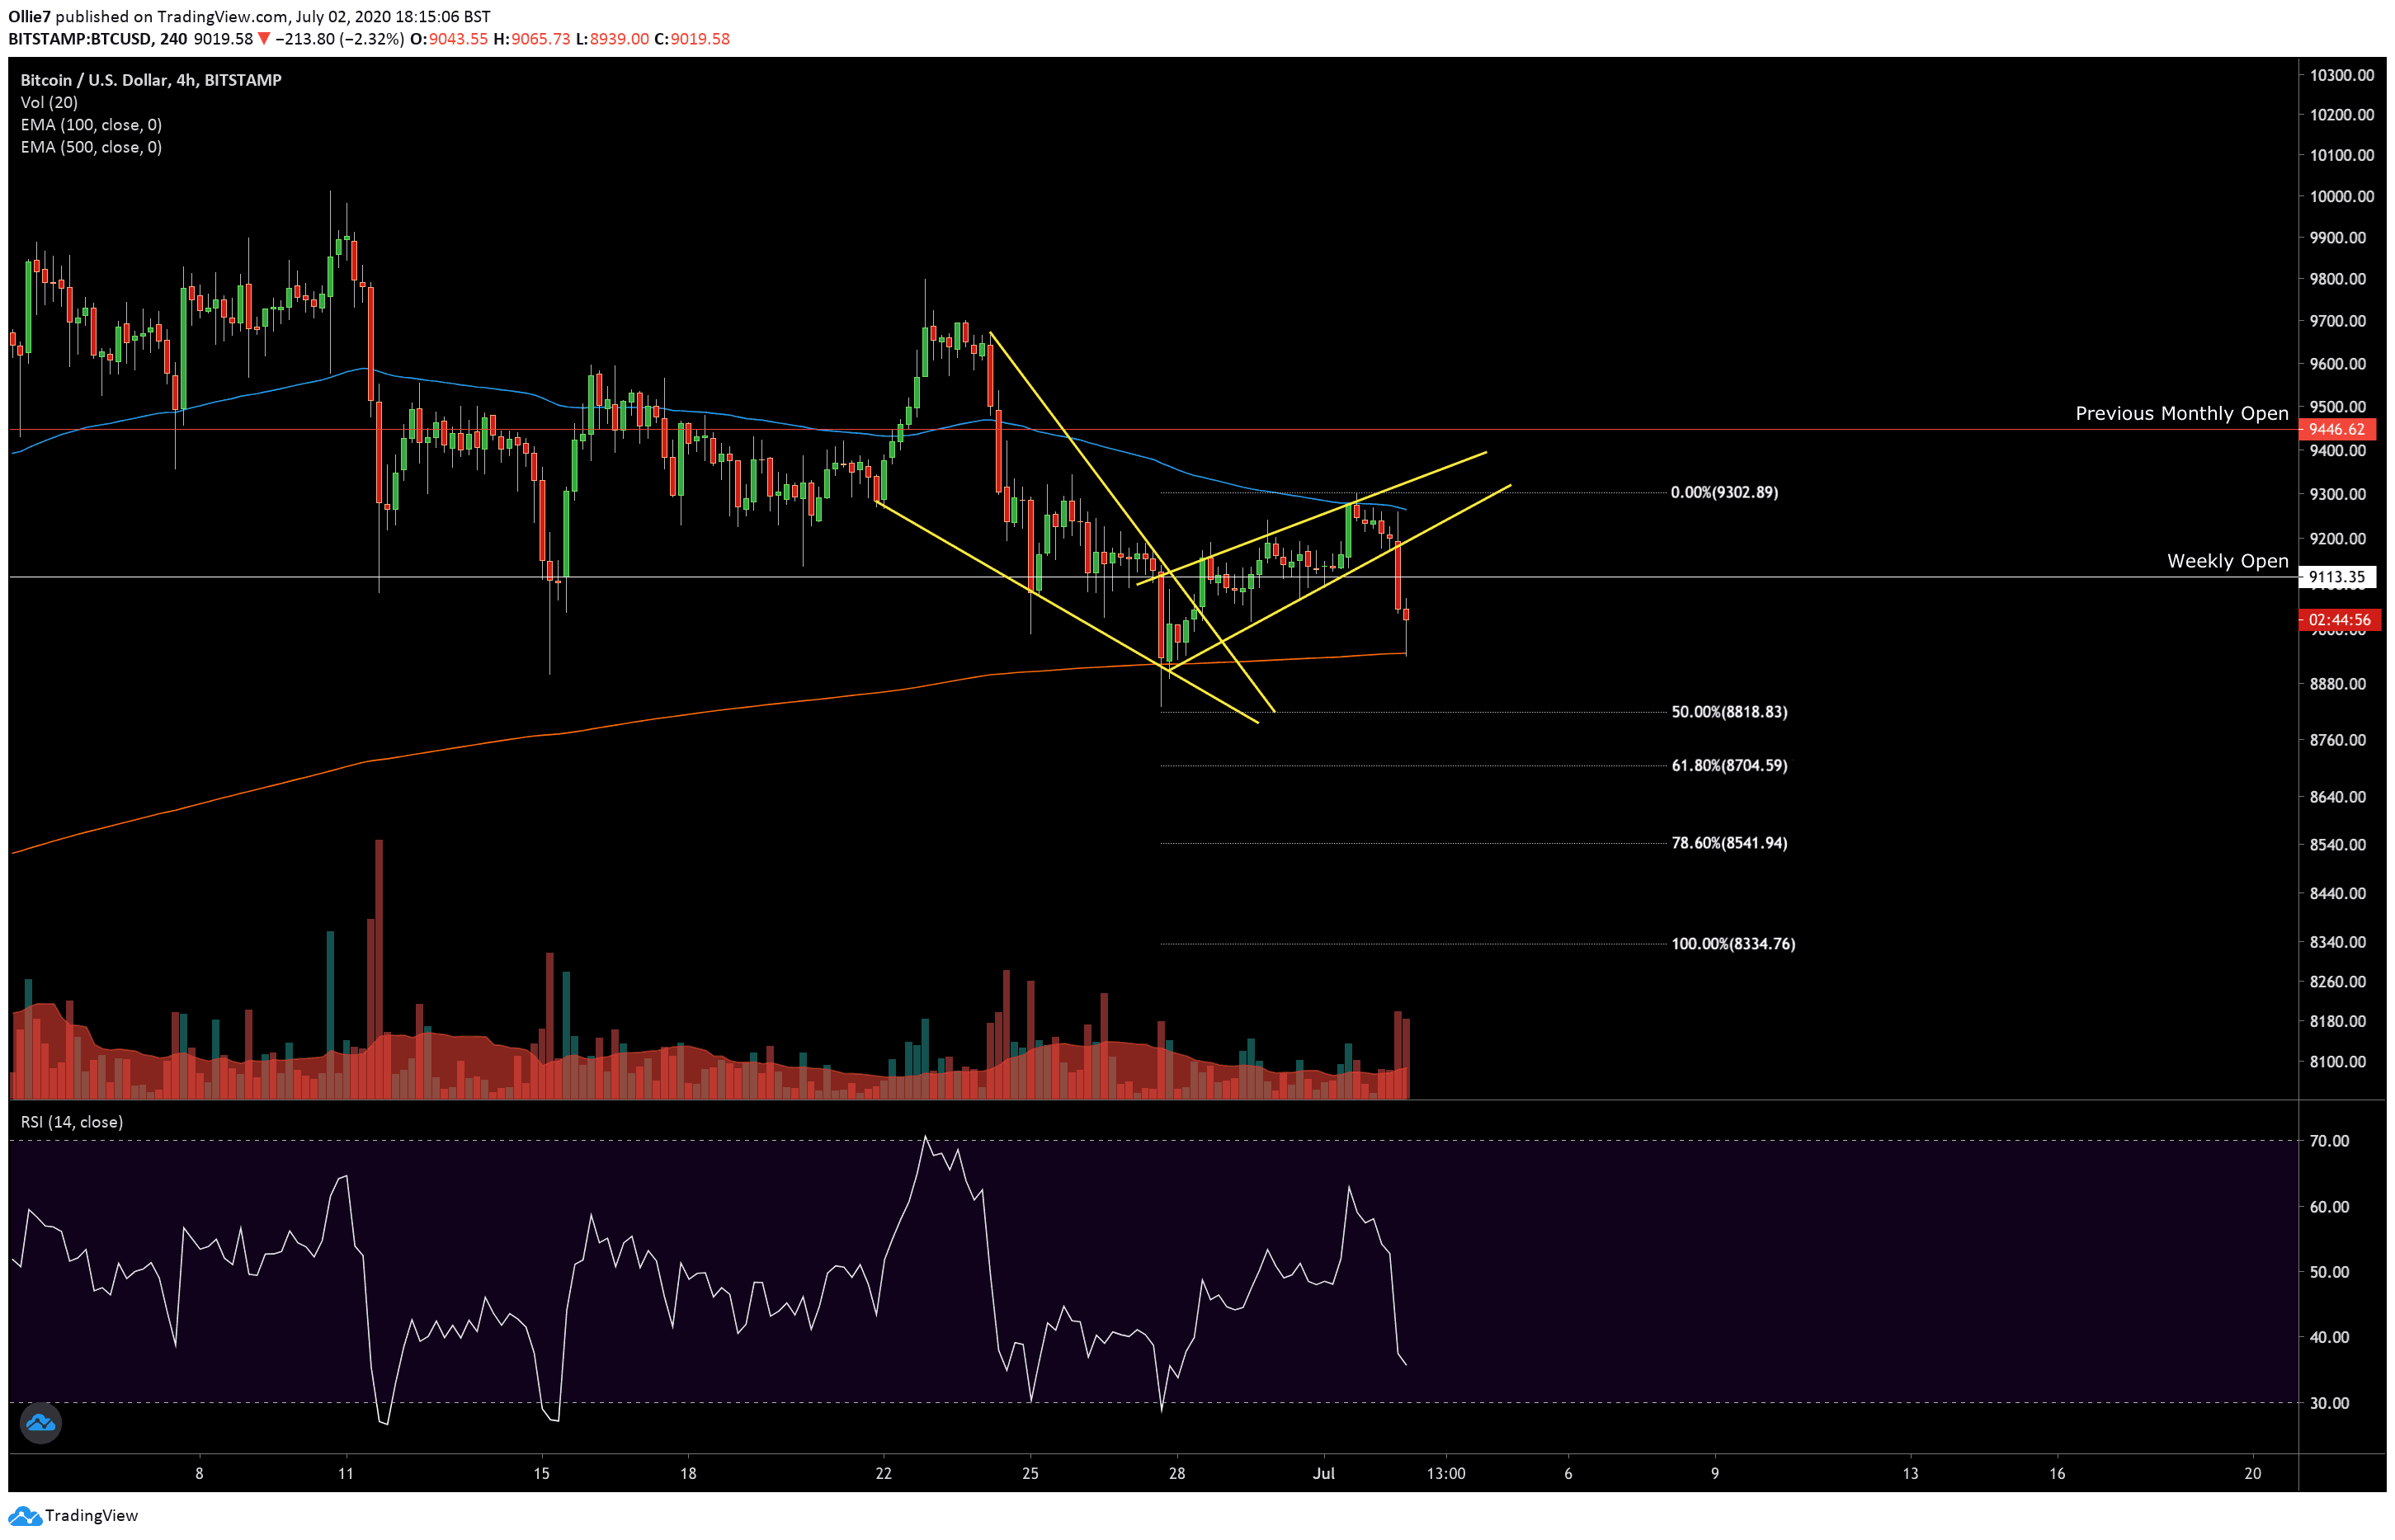
On the above 4-hour BTC/USD chart, we can see that the price action just broke to the bearish side, out of a rising wedge pattern.
The sudden surge in selling pressure drove Bitcoin through the weekly open support (white line) at $9,113 and all the way down on to the 500-EMA (marked red) support beneath, at around $8,944.
Prior to the breakout, the bulls almost succeeded in retesting the 50-EMA (blue line) for a second time, but the sentiment shifted quickly after the strong $9,260 resistance held for the 5th time (as can be seen on the 30-minute chart below). We anticipated this bearish decline in yesterday’s Bitcoin analysis.
Right now, the price levels which will most likely create resistance against any short-term uptrend will be the aforementioned weekly open at $9,113, and somewhere around the $9,200 area if bitcoin price throws back to the previous support level of the rising wedge pattern (yellow line).
Looking at the lower levels, we could see some support at the psychological $9,000 level and back at the 500-EMA level. However, we could see a possible second wave of selling take place once bears recharge from the recent crash. If this happens, the $8,800 level looks like a possible short-term target for bitcoin sellers, which coincides with a previous support and the 0.5 Fibonacci extension level.
Looking at the 30-minute BTC/USD chart, we can see that BTC price broke into the oversold region on the RSI. For intraday traders this is usually a strong buying signal, and already it has helped rebound prices back over the $9,000 mark. This doesn’t mean that bitcoin is out of the woods yet though.
The moving averages on the 4-hour MACD have now bearishly diverged beneath the zero line with selling volume rising on the histogram. This confirms that the short-term trend is now favorably bearish.
Total Market Cap: $261 billion
Bitcoin Market Cap: $167 billion
Bitcoin Dominance Index: 63.8%