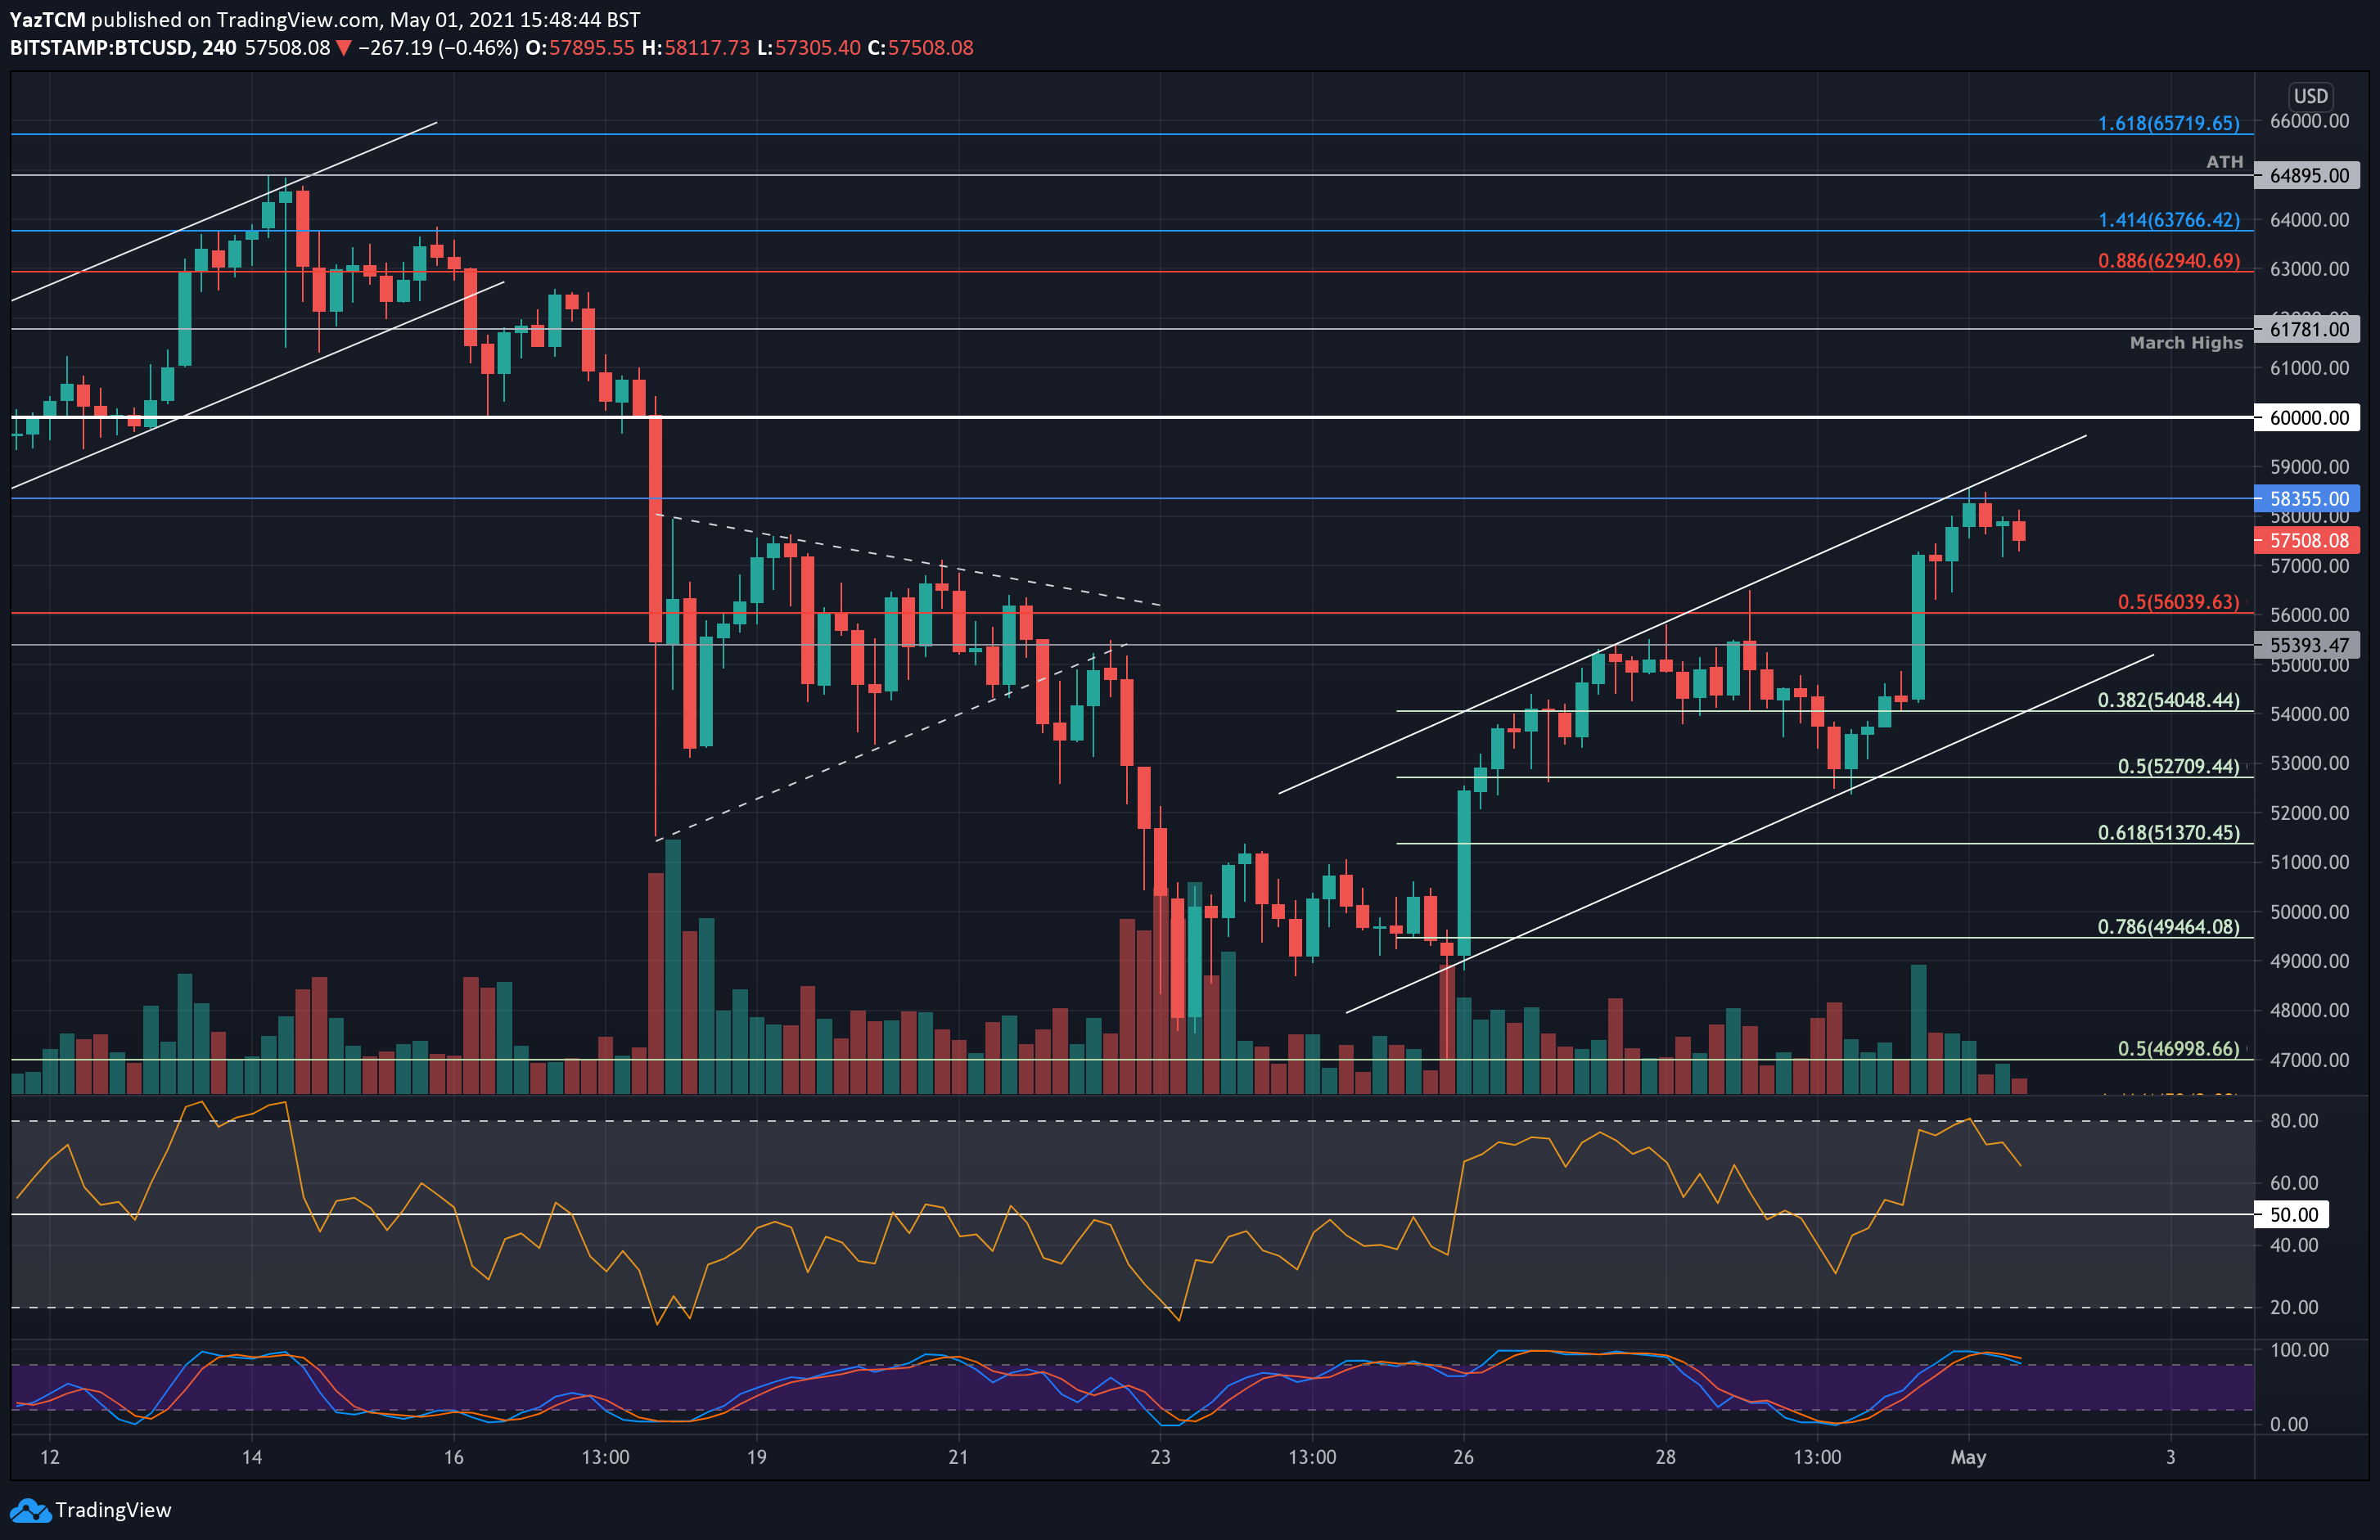
BTC/USD 4-Hour Chart. Source: TradingView
Yesterday, bitcoin surged by an impressive 9% from daily low to daily high, surpassing the $58k mark. This continues the ongoing bullish week for BTC. Just six days ago, on Sunday, bitcoin price plunged to as low as $47k.
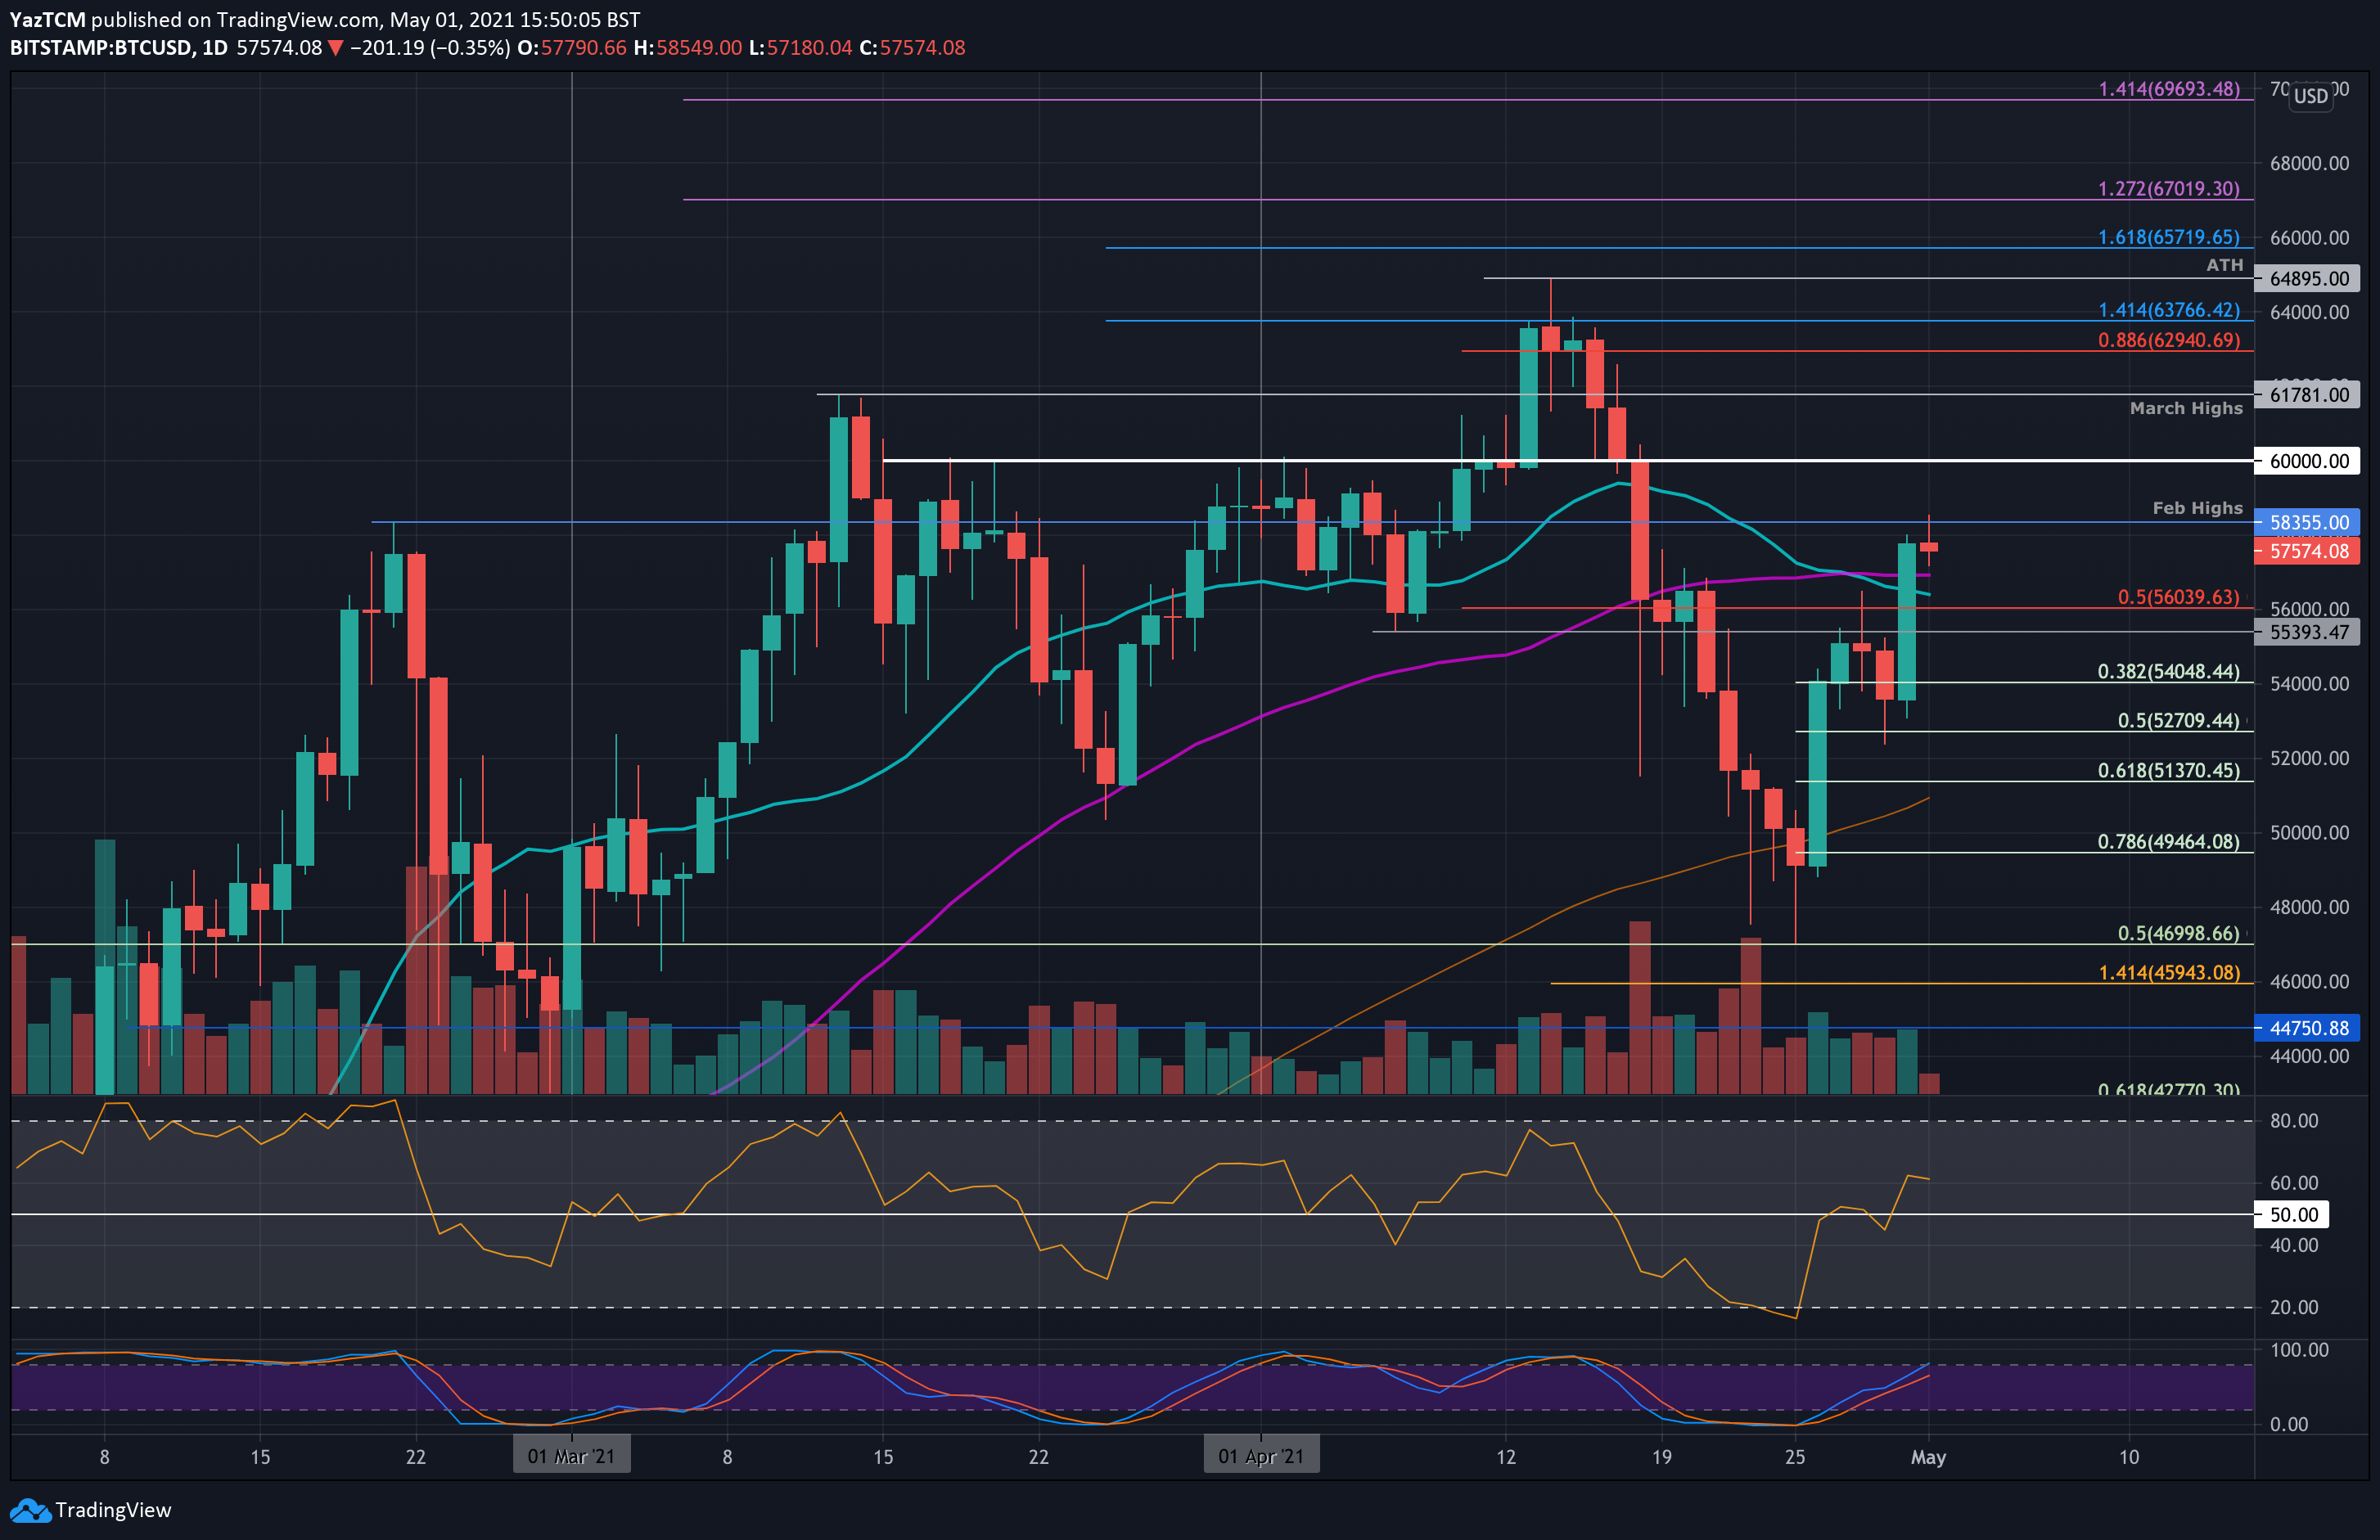
Yesterday’s spike allowed bitcoin to climb back above the significant 50-day moving average line, after spending 11 days beneath it. Before this, bitcoin hadn’t seen a daily close beneath the 50-days MA since October 2020.
As a quick recap, BTC broke below the 50-days MA on April 19th and continued to head lower from there until it found support at $47,000 (.5 Fib) last Sunday, as mentioned above.
Earlier today, the bulls encountered a significant resistance area at $58,355, which was the previous all-time high set at mid-February. This resistance was further bolstered by the upper angle of a short-term ascending price channel.
After reaching this resistance, bitcoin retraced over $1000 to where it is trading right now. According to Bitstamp, the daily MA-50 now lies at approximately $56,930. This, together with the $57k horizontal support, is the first major support bulls should look at.
Key Support Levels: $56,950 / $57k (MA-50), $56,400 (MA-20), $55,400, $54,050, $52,700.
Key Resistance Levels: $58,355, $59,000, $60,000, $61,780, $62,940.
Looking ahead, the first resistance lies at $58,355 (Feb highs or today’s highest). This is followed by $59,000 (upper angle of ascending price channel), $60,000, $61,780 (March previous all-time high), and $62,940 (bearish .886 Fib).
On the other side, the first support lies at $57k – $56,950 (50-days MA). This is followed by $56,400 (MA-20), $55,400, $54,000 (.382 Fi), and $52,700 (.5 Fib & lower angle of the price channel).
The RSI managed to break the midline and climb above 60, indicating that the bulls have taken control of the short-term momentum and are increasing their hold. This is a positive sign for the bulls, signals that the uptrend is healthy. This comes along with Bitcoin whales reportedly accumulating Bitcoin below $50k earlier this week.