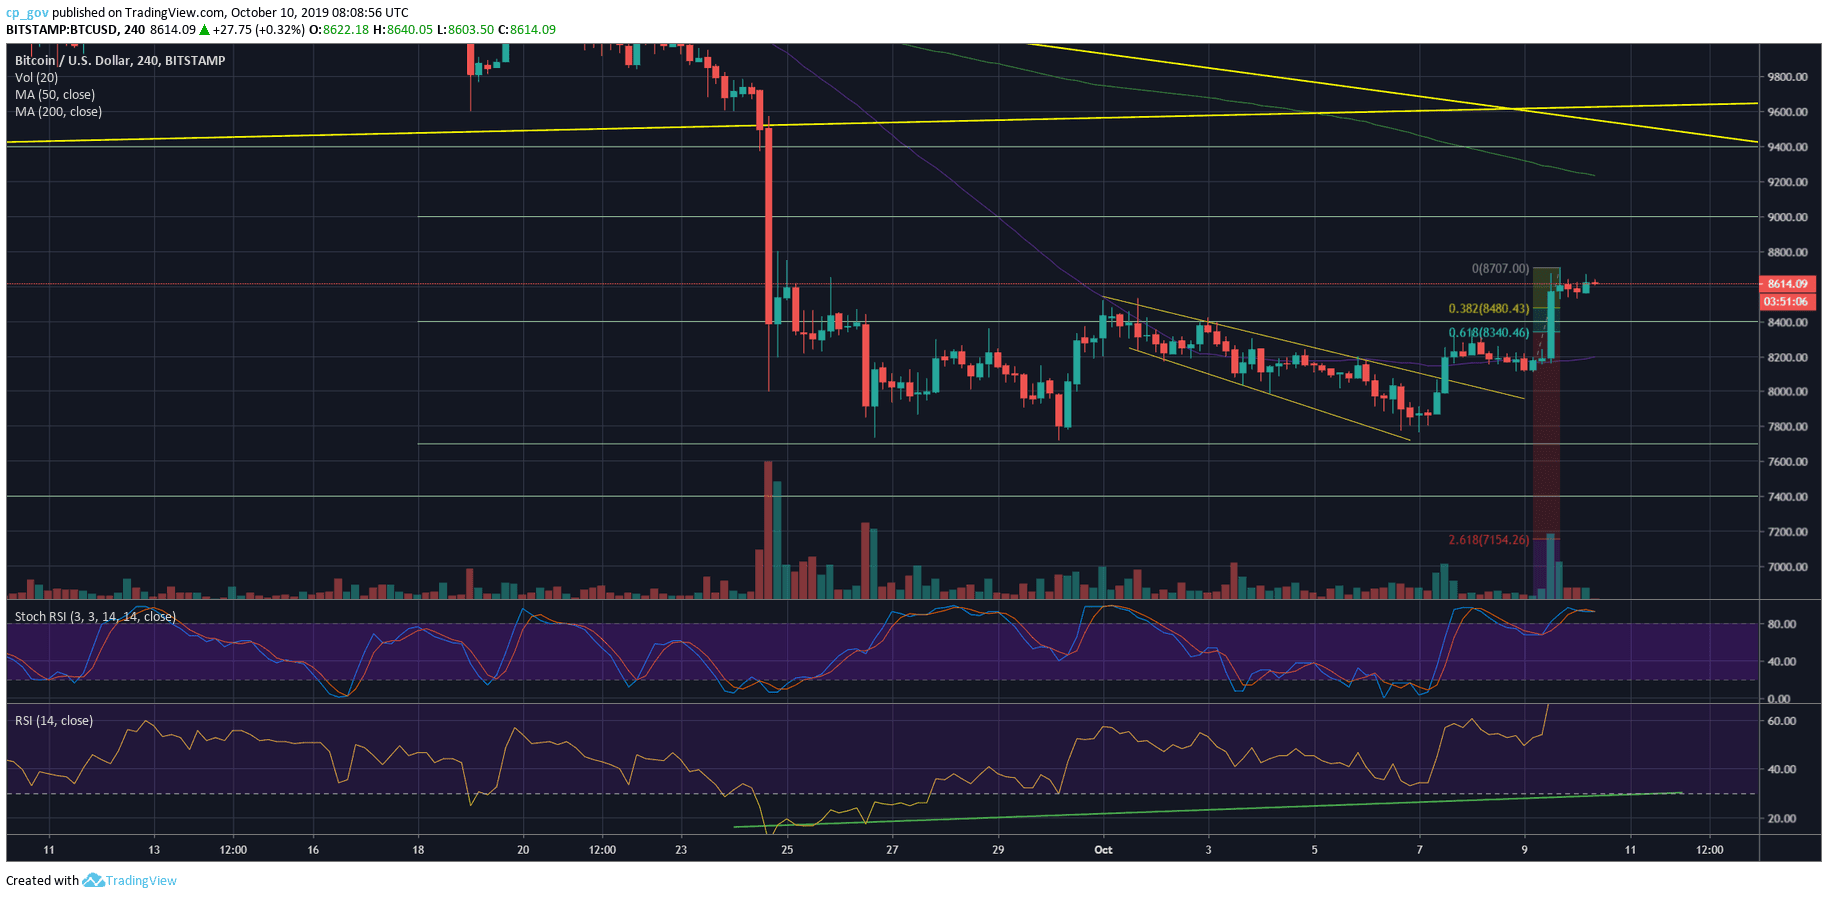
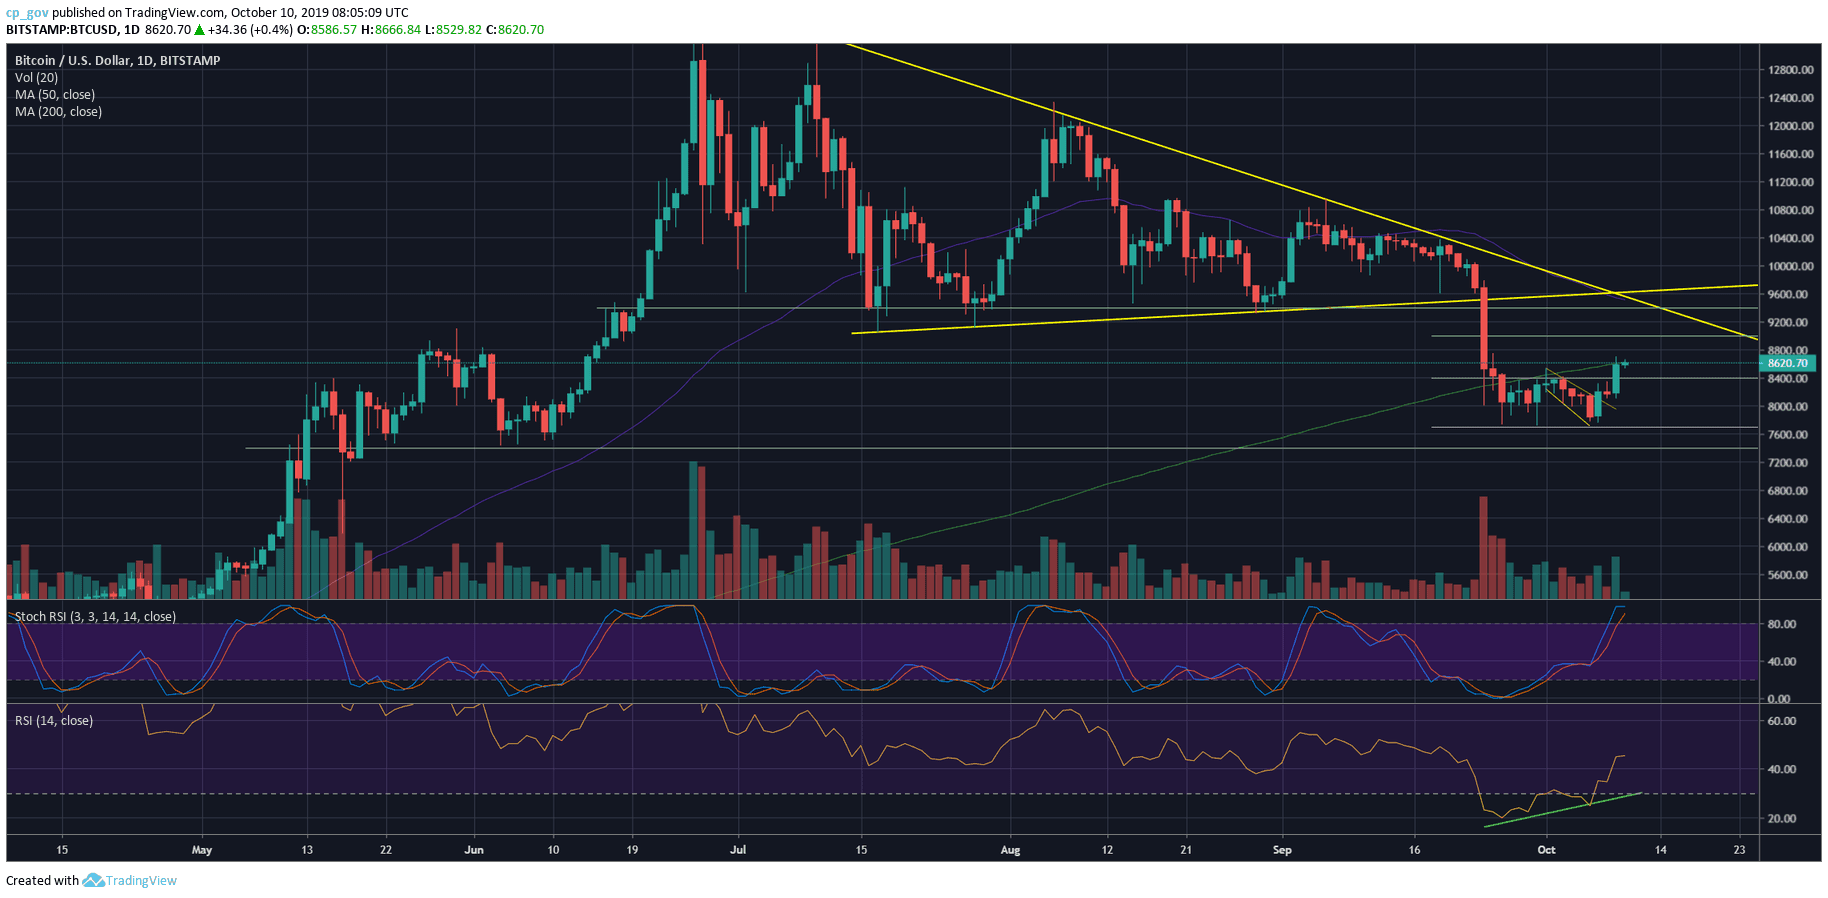
The bullish divergence mentioned in yesterday’s analysis, along with the descending wedge’s breakout three days ago, is so far not disappointing for the price of Bitcoin. Shortly after yesterday’s update was released, Bitcoin surged $400 exactly to our marked resistance of the MA-200.
Many traders consider the 200-days moving average line, which is marked in light green on the following BTC daily chart, as the distinguish between Bull and Bear markets. Since September 26, Bitcoin was trading below the line. Two times the line was tested as resistance in that period. Hours ago was the third attempt.
It will be interesting to see whether the bulls can push Bitcoin beyond that critical resistance line. It’s not a coincidence that the decent daily move from yesterday reached exactly the MA-200 line.
Total Market Cap: $231 billion
Bitcoin Market Cap: $155 billion
BTC Dominance Index: 66.9%
*Data by CoinGecko
– Support/Resistance:
As mentioned, Bitcoin is now facing resistance of the 200-days moving average line, around the $8600 price area. In case of a break-up, Bitcoin is likely to reach $9000 quickly. Further above is the $9200 (weak resistance) and the $9400 resistance. The next major test will be the ascending trend-line of the marked bearish triangle (which got broken down September 24). The line is currently around $9700.
In case of a correction to the bearish side, healthy correction targets could be the Fibonacci retracement levels of $8480 (38.2%) and $8340 (61.8%, along with strong resistance turned support at $8400). Further below is $8200 and $8000, which less likely to see them tested again in the very short-term.
– The RSI Indicator (Daily): The indicator continues its bullish surge. After recording its lowest levels since 2018, the RSI is showing strength and as of writing, this facing resistance around the 44-45 levels.
Despite the above, the Stochastic RSI oscillator is overextended in the overbought territory, which may support the option of a possible short-term correction.
– The Trading Volume: Yesterday saw a huge among of buyers’ volume. However, the volume is still far from the levels of sells following the breakdown of the $9400 area on September 24. If the bulls plan on controlling the market, the buyers’ volume levels must be a lot more impressive.