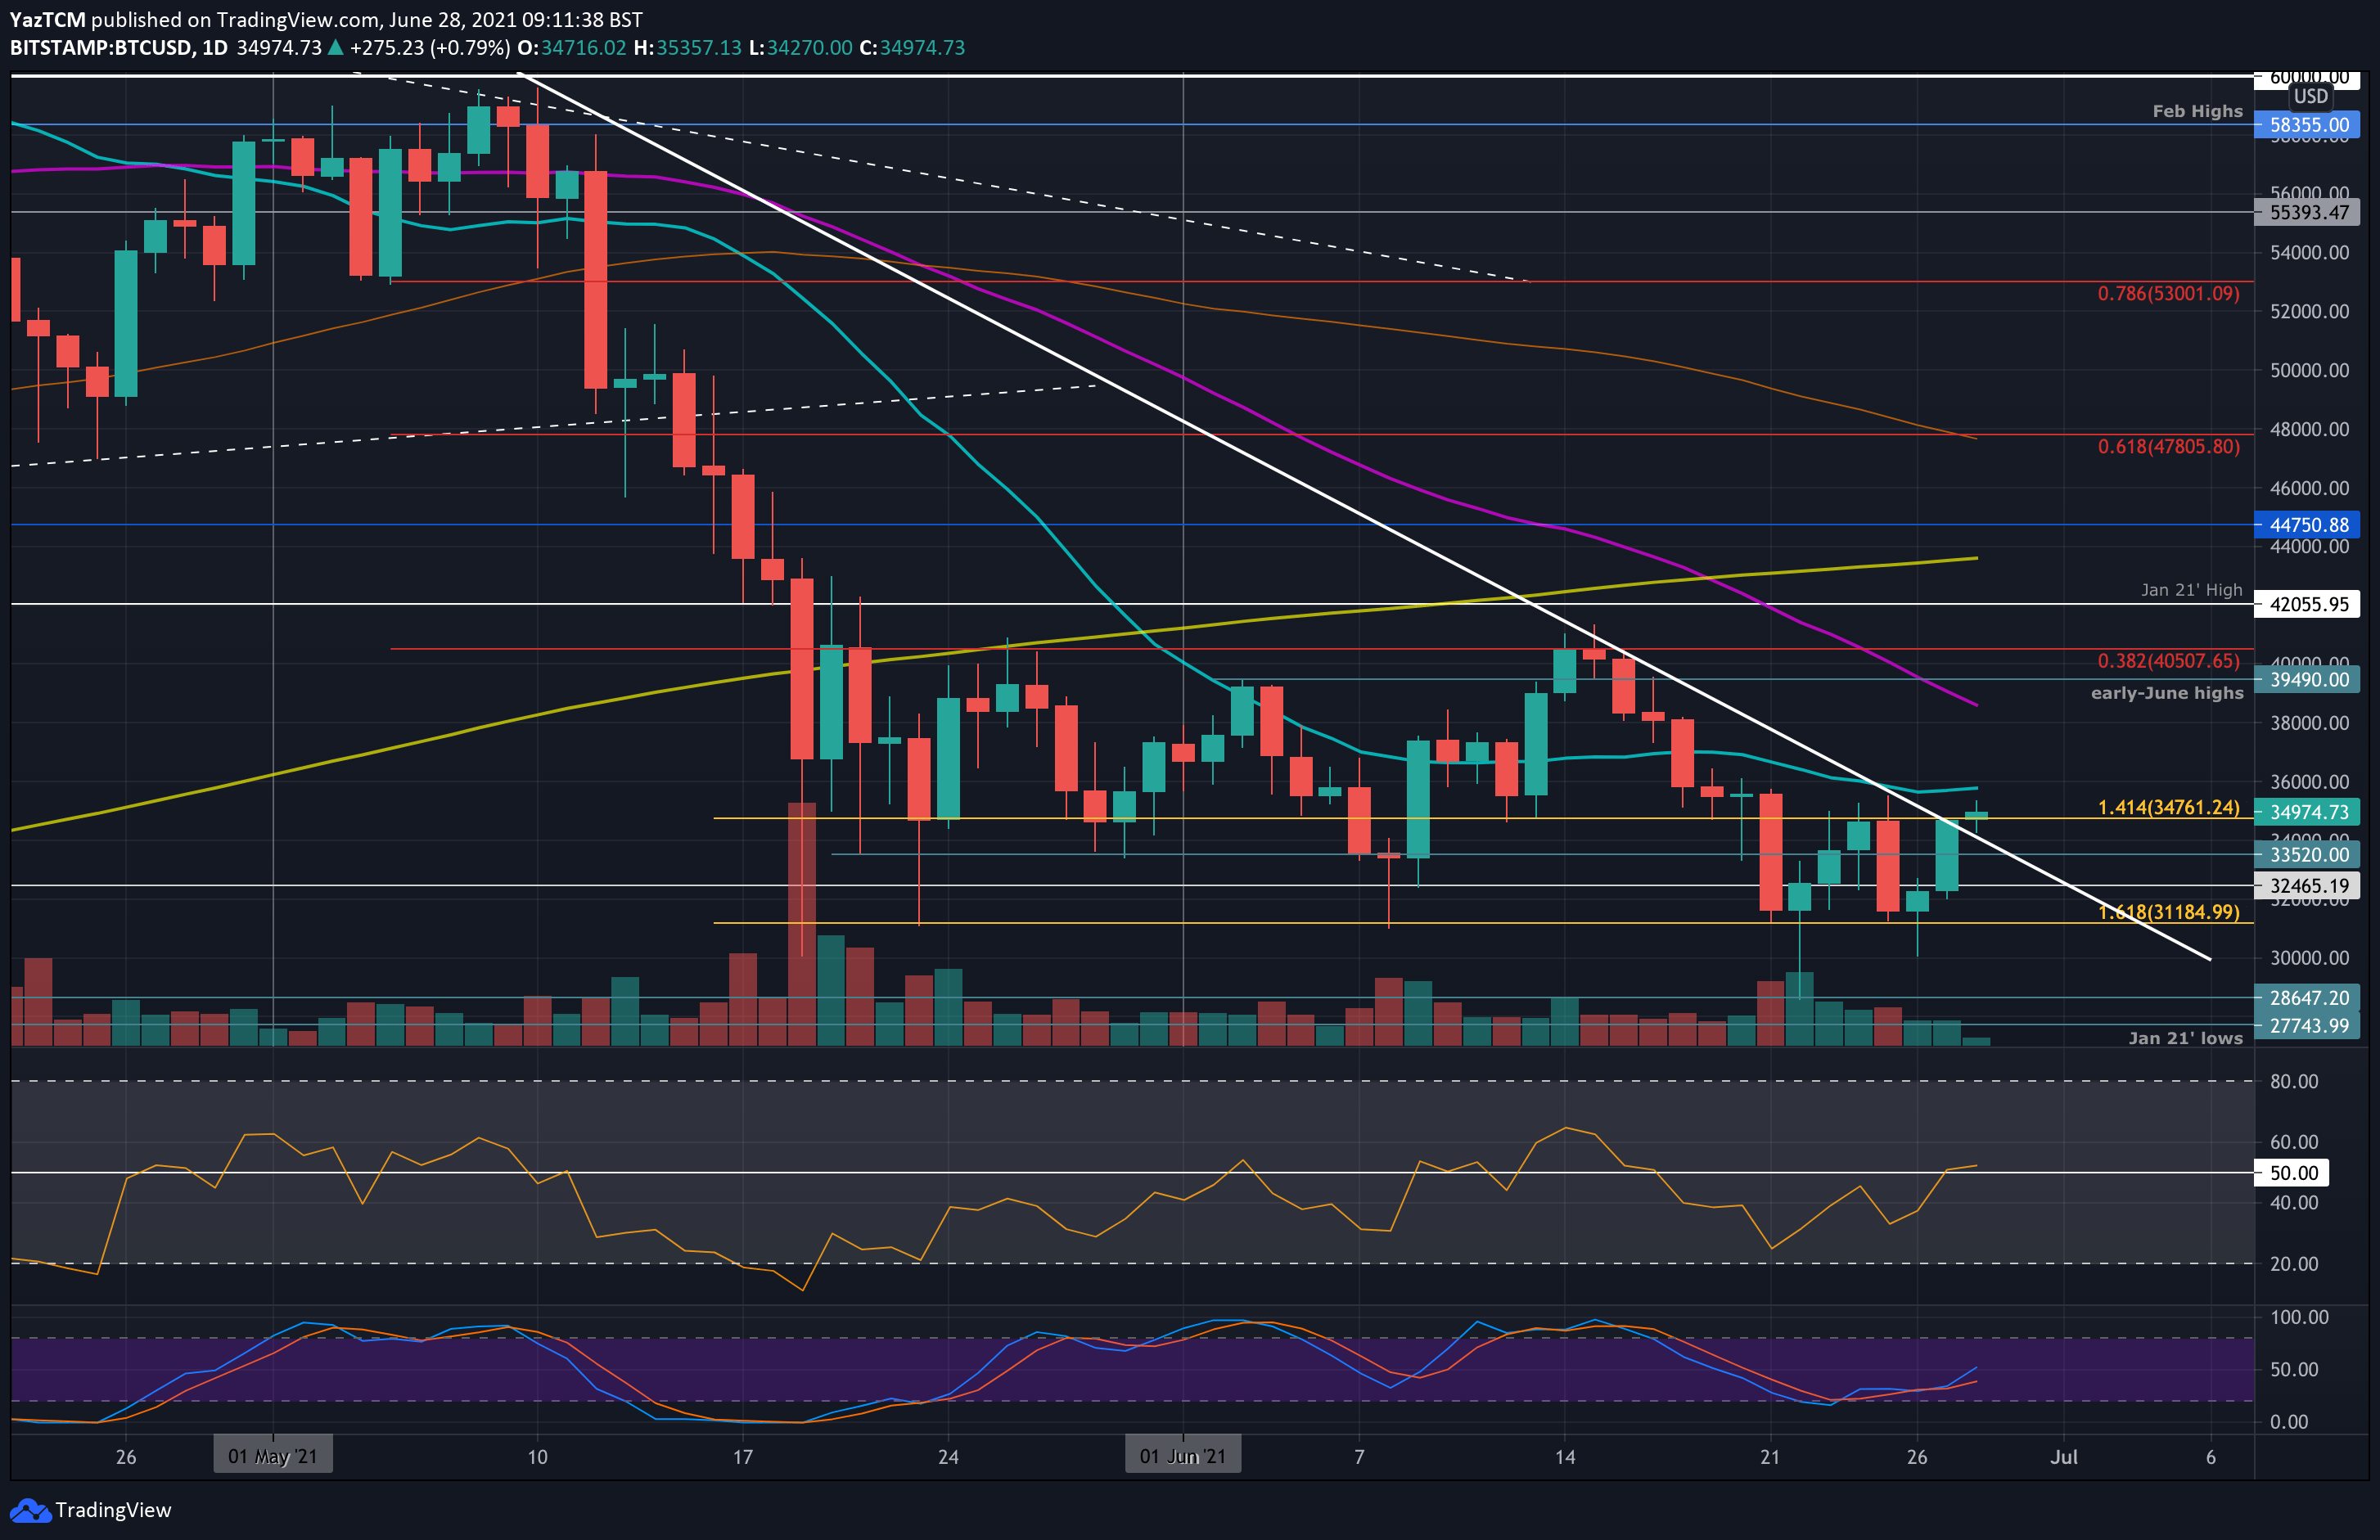
BTC/USD Daily Chart. Source: TradingView.
Bitcoin is up another 5% over the past 24 hours as it battles with resistance at $35K. The double bottom formed over the weekend has played out nicely and has allowed bitcoin to break resistance at a falling trend line that dates back to the May peaks.
As mentioned yesterday, the double bottom formation could be the first bullish signal that the overall bearishness in the market might be starting to settle, so long as the demand zone between $31K-$30K continues to hold as it has so far.
Each of the five times (since May 19) when the market spiked to these levels, it seemed that the buyers are taking the opportunity to step in. Bitcoin price has not yet closed a daily candle beneath $31,500 since the market tanked in mid-May.
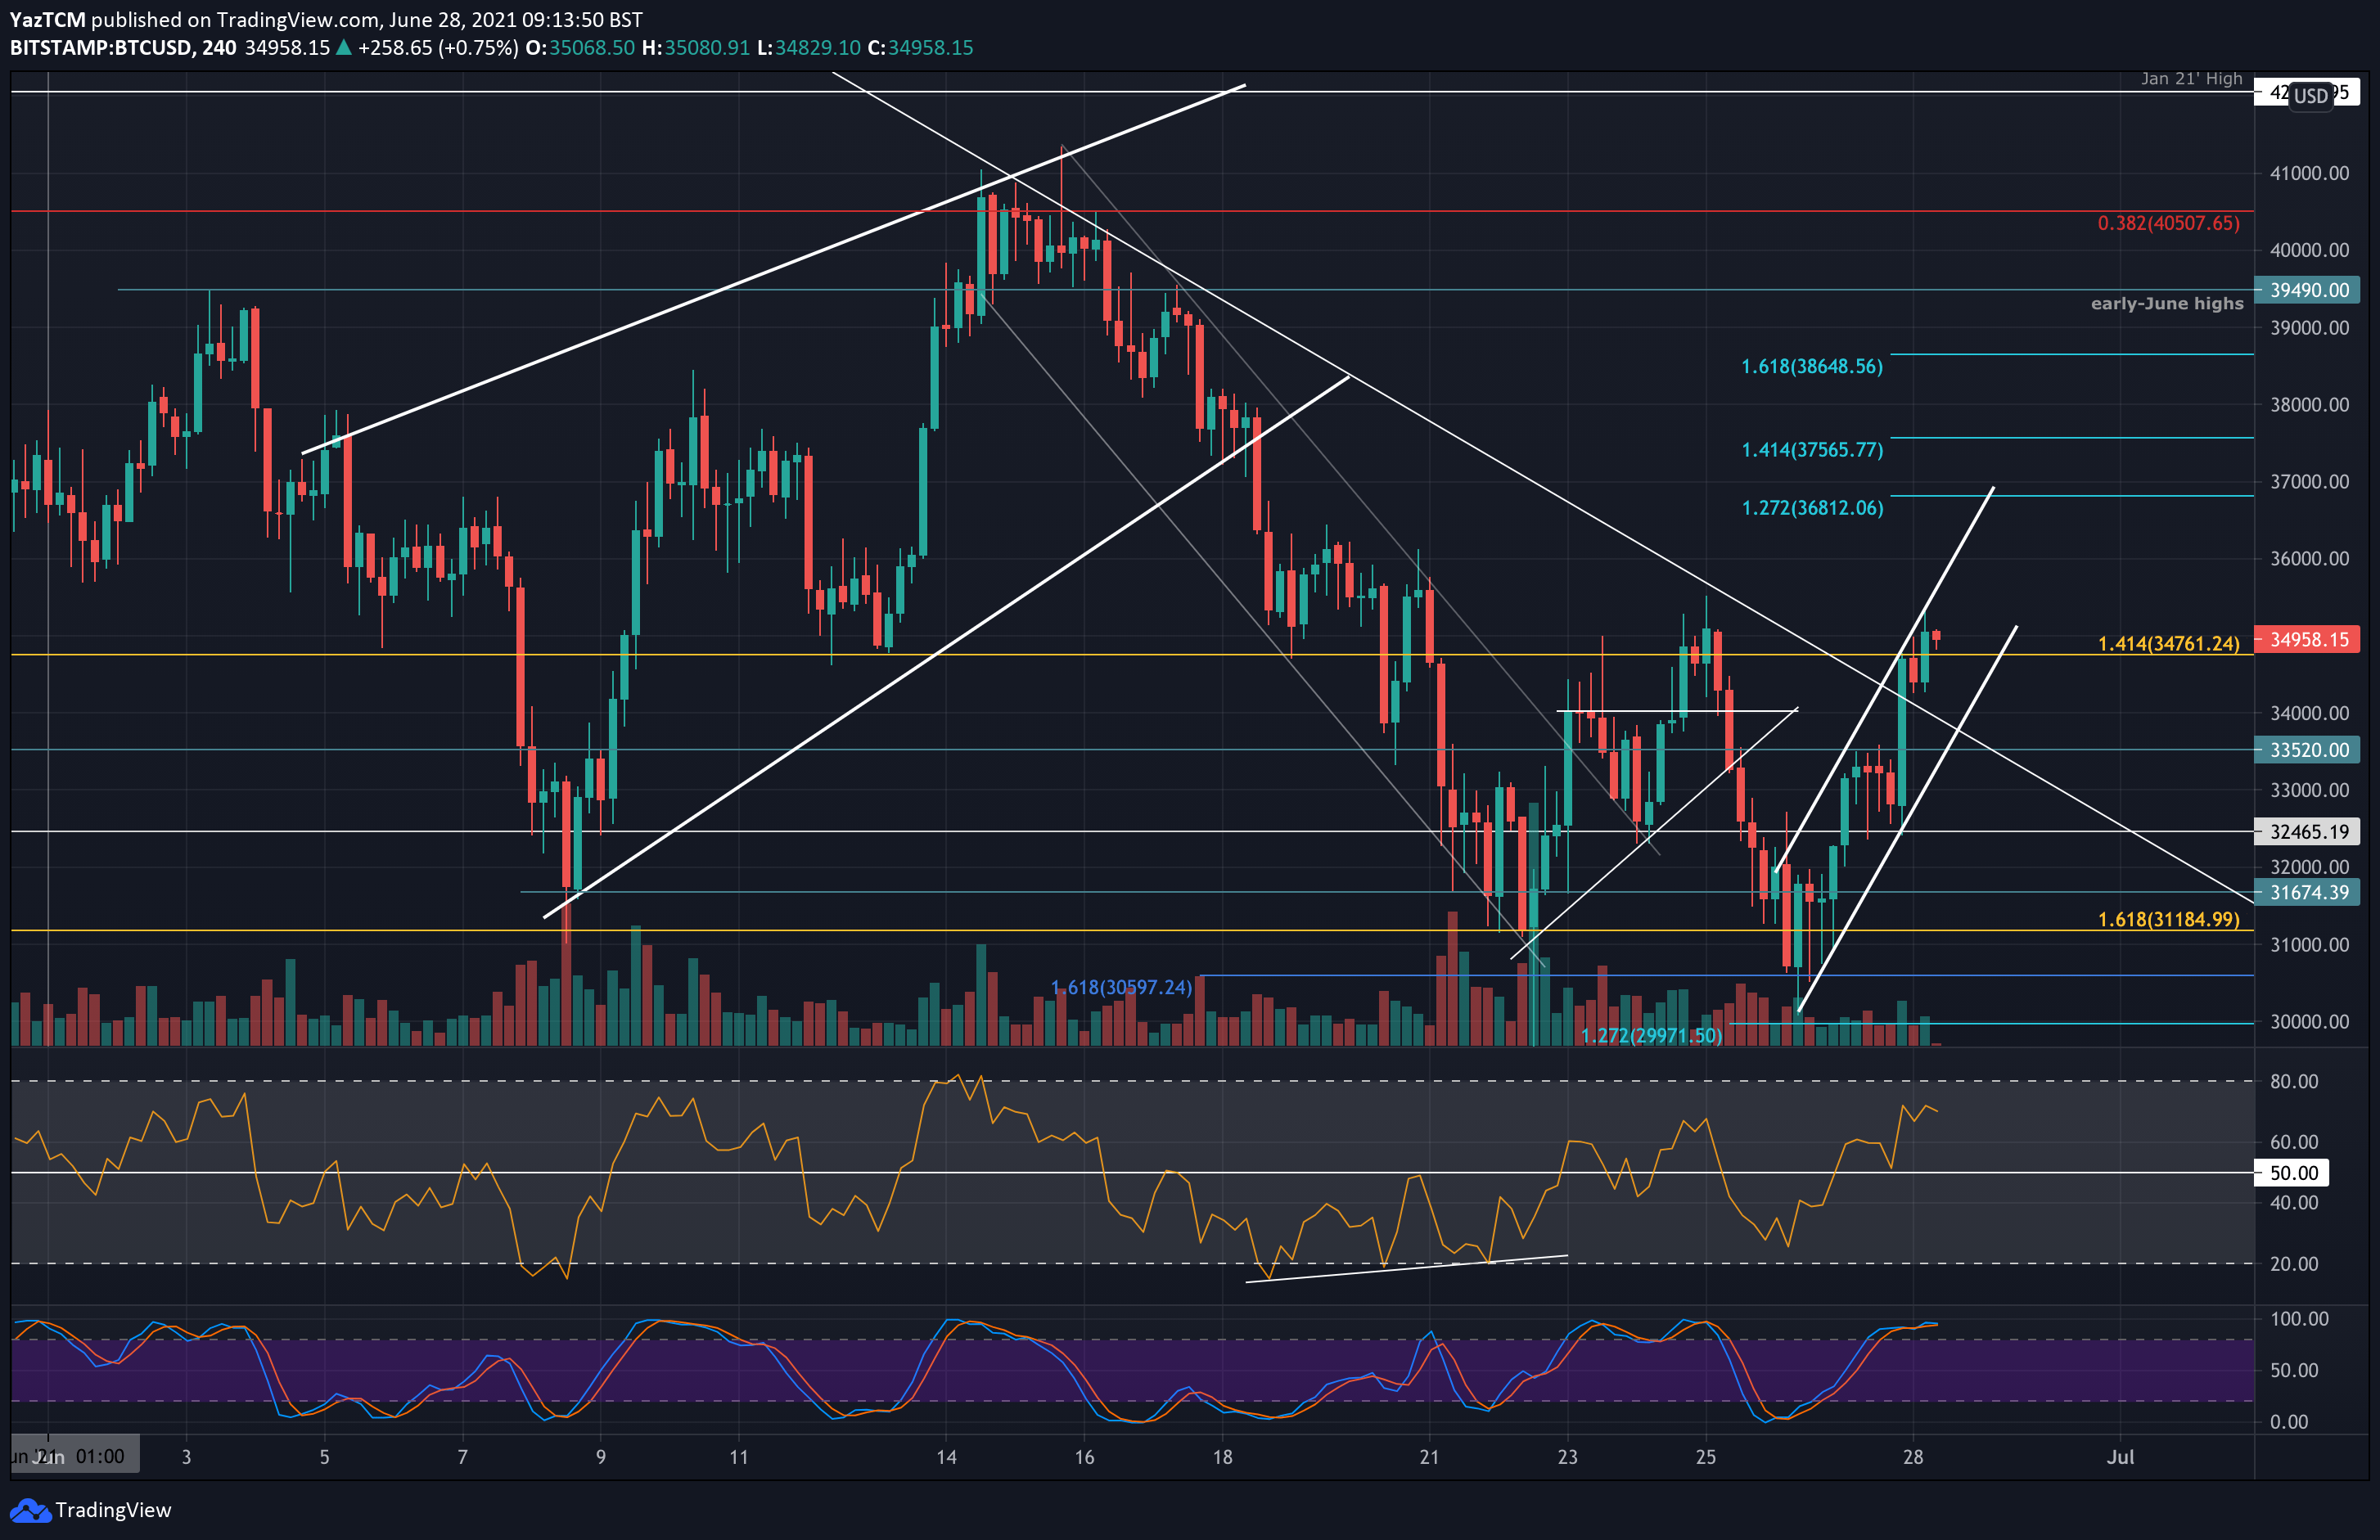
On the 4-hour chart, Bitcoin has now formed a short-term ascending price channel from the weekend support at $30,600 (downside 1.618 Fib Extension). It is currently facing resistance at the upper angle of this trendline, and a break above could see the market soaring back above towards the next target at $38K.
As can be seen below, the $35K zone is full of resistance: this includes the MA-20 (moving average 20 days) line and this week’s high recorded on Friday.
Reminder: the bigger picture hasn’t changed. Since May 19, 2021, Bitcoin’s price is maintaining the trading range between $30k and $42k. Until we see a breakout from this, we can expect choppy side action inside.
Key Support Levels: $34,000, $33,500, $32,460, $31,185, $30,600.
Key Resistance Levels: $35,400, $35,700, $36,800, $37,600, $38,600.
Beyond $35,400 (descenidng trend-line and weekly high recorded on Friday), the first resistance lies at $35,700 (20-day MA). This is followed by $36,800 (1.272 Fib Extension), $37,600 (1.414 Fib Extnsion), $38,600 (1.618 Fib Extension & 50-day MA), and $39,500 (early-June highs).
On the other side, the first support lies at $34,000 (lower boundary of ascending price channel). This is followed by $33,500, $32,460, and $31,185 (downside 1.618 Fib Extension). Added support lies at $30,600 (downside 1.618 Fib Extension) and $30,000.
The daily RSI has returned to the midline and is attempting to climb above it. This indicates that the previous bearish momentum has left the market. The RSI would have to rise beyond 50 to indicate bullish momentum and allow BTC to drive above $36K.