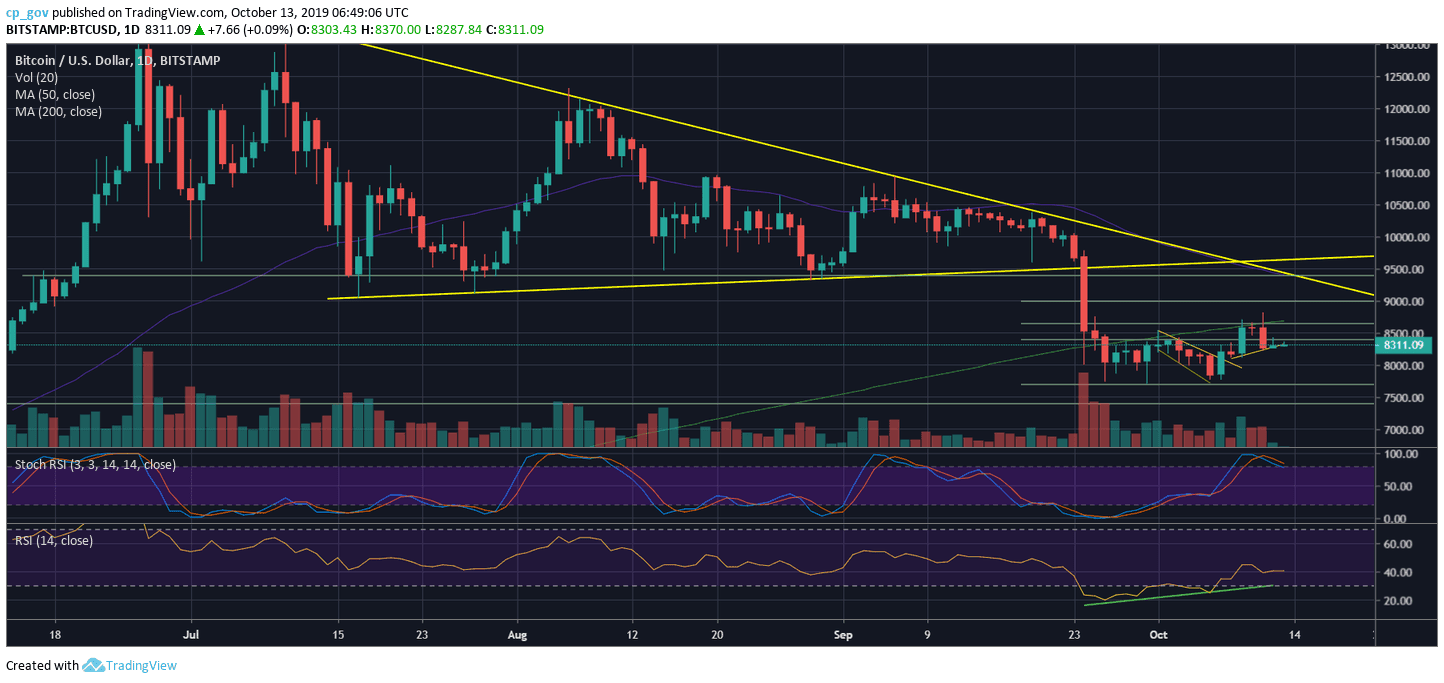
On the recent Bitcoin price analysis, we had mentioned how critical is the 200-days moving average line for Bitcoin.
Bitcoin couldn’t break-out to finally close above the line, which is seen by many traders as the boundary between Bear and Bull market conditions. Two days ago, we got another proof for this, as the breakout candle reaching $8,800 quickly turned back into a false one. Bitcoin Bears pushed the coin down to $8200 in what seems like another well planned price move.
Since then, and up until now, we see Bitcoin back into the tight range of $8200 – $8400. Despite the fake-out mentioned above, Bitcoin’s short-term still maintains the bullish pattern of higher lows, supported by the RSI indicator.
Total Market Cap: $224.6 billion
Bitcoin Market Cap: $150 billion
BTC Dominance Index: 66.8%
*Data by CoinGecko
– Support/Resistance:
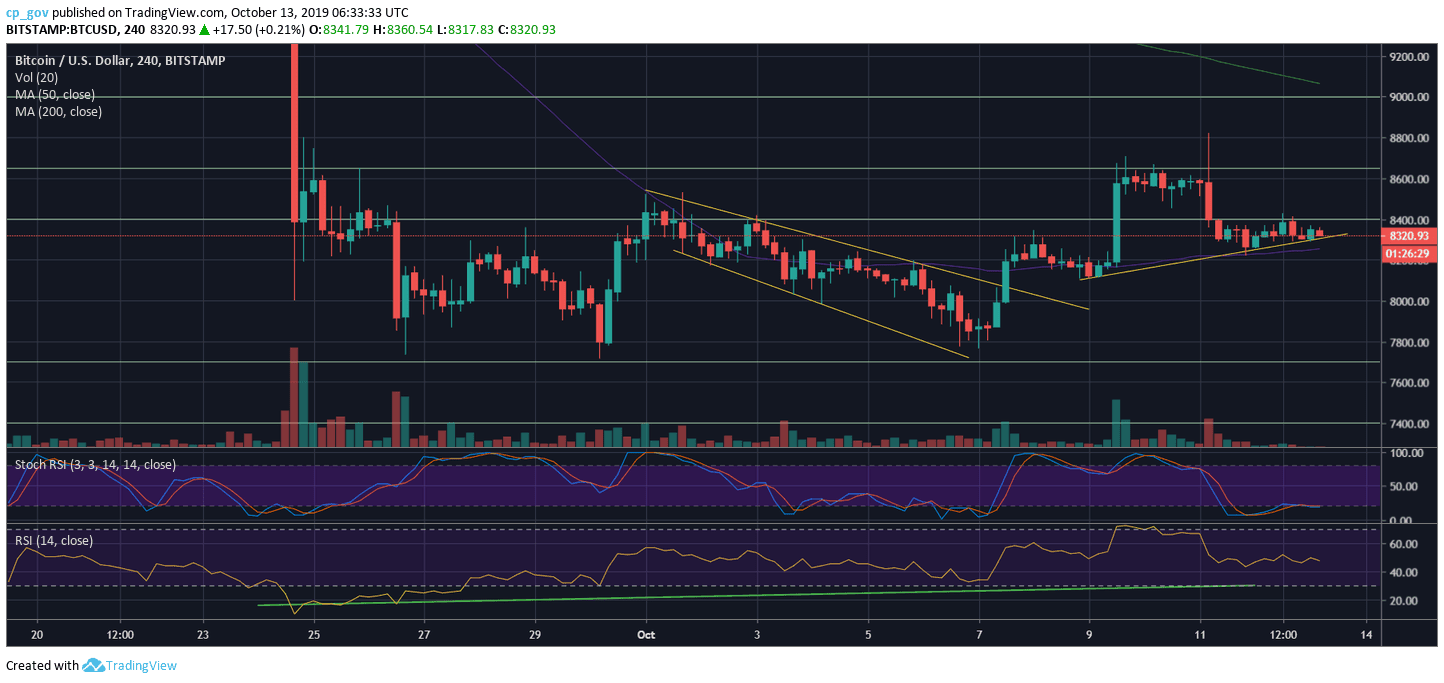
For the past two days, Bitcoin is trading between the $8400 resistance line from above and $8300 or the ascending short-term (4-hour) trend-line from below. It looks like that a strong move to either side is just a matter of hours.
From the bullish side, following $8400, Bitcoin is still facing resistance at $8650 along with the significant 200-days moving average line, around the $8700 price area. In case of a daily close above the crucial MA-200, Bitcoin is likely to reach $9000 quickly. Further above is the $9200 (weak resistance) and the $9400.
In case of a price move to the bearish side, the first support lies at $8300, along with the short-term resistance line and the 4-hour MA-50 (marked in dark blue). Further below is $8200 and $8000.
– The RSI Indicator (Daily): The indicator continues to be bullish, keeping up the higher lows trajectory. Recently, it got rejected trying to break-up the 44-45 resistance zone. Unlike the RSI, the Stochastic RSI had made a bearish crossover at the overbought territory, which might signal on a coming up bearish correction.
– The Trading Volume: One of the reasons that the breakout from two days ago (to $8800) turned to be fake is the lack of buyers’ volume. By looking at the volume chart of the past month, we can clearly identify a stronger phase of the sellers. The bulls can come back at any moment, but so far, it didn’t happen.