After June 2020 had won the title for the least volatile month for Bitcoin since October 2019, then came July. So far, this month, Bitcoin had been trading in even a tighter range.
The primary cryptocurrency had been adequately following the $9200 price, surrounding it, refusing to leave it, despite the ongoing craziness of the altcoins.
After the Bitcoin Volatility Index reached a negative record since November 2018, Bitcoin finally moved more than 1% on the daily. While most of crypto Twitter were bearish, the coin broke to the bullish side.
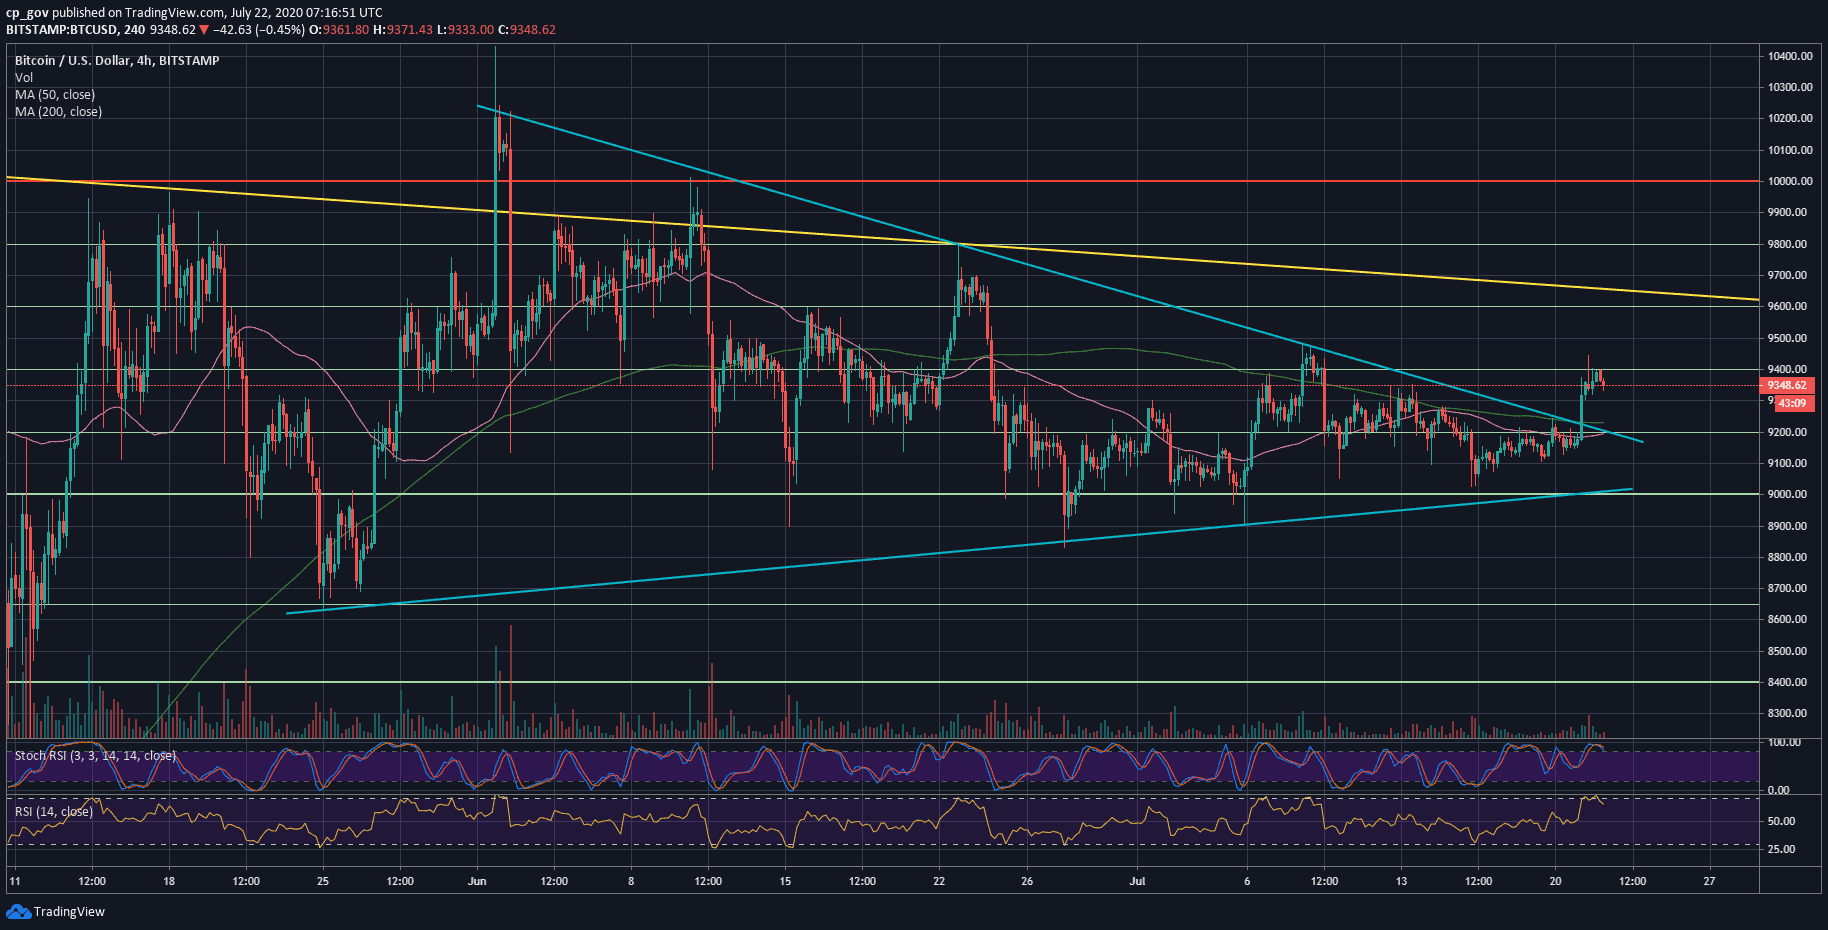
As can be seen on the following 4-hour chart, Bitcoin broke beyond the massive blue symmetrical triangle. From the breakout around $9225, Bitcoin quickly regained position to the next significant resistance area at $9400. These gains were probably enough for just one day, and the same consolidation is now around $9350 – $9400.
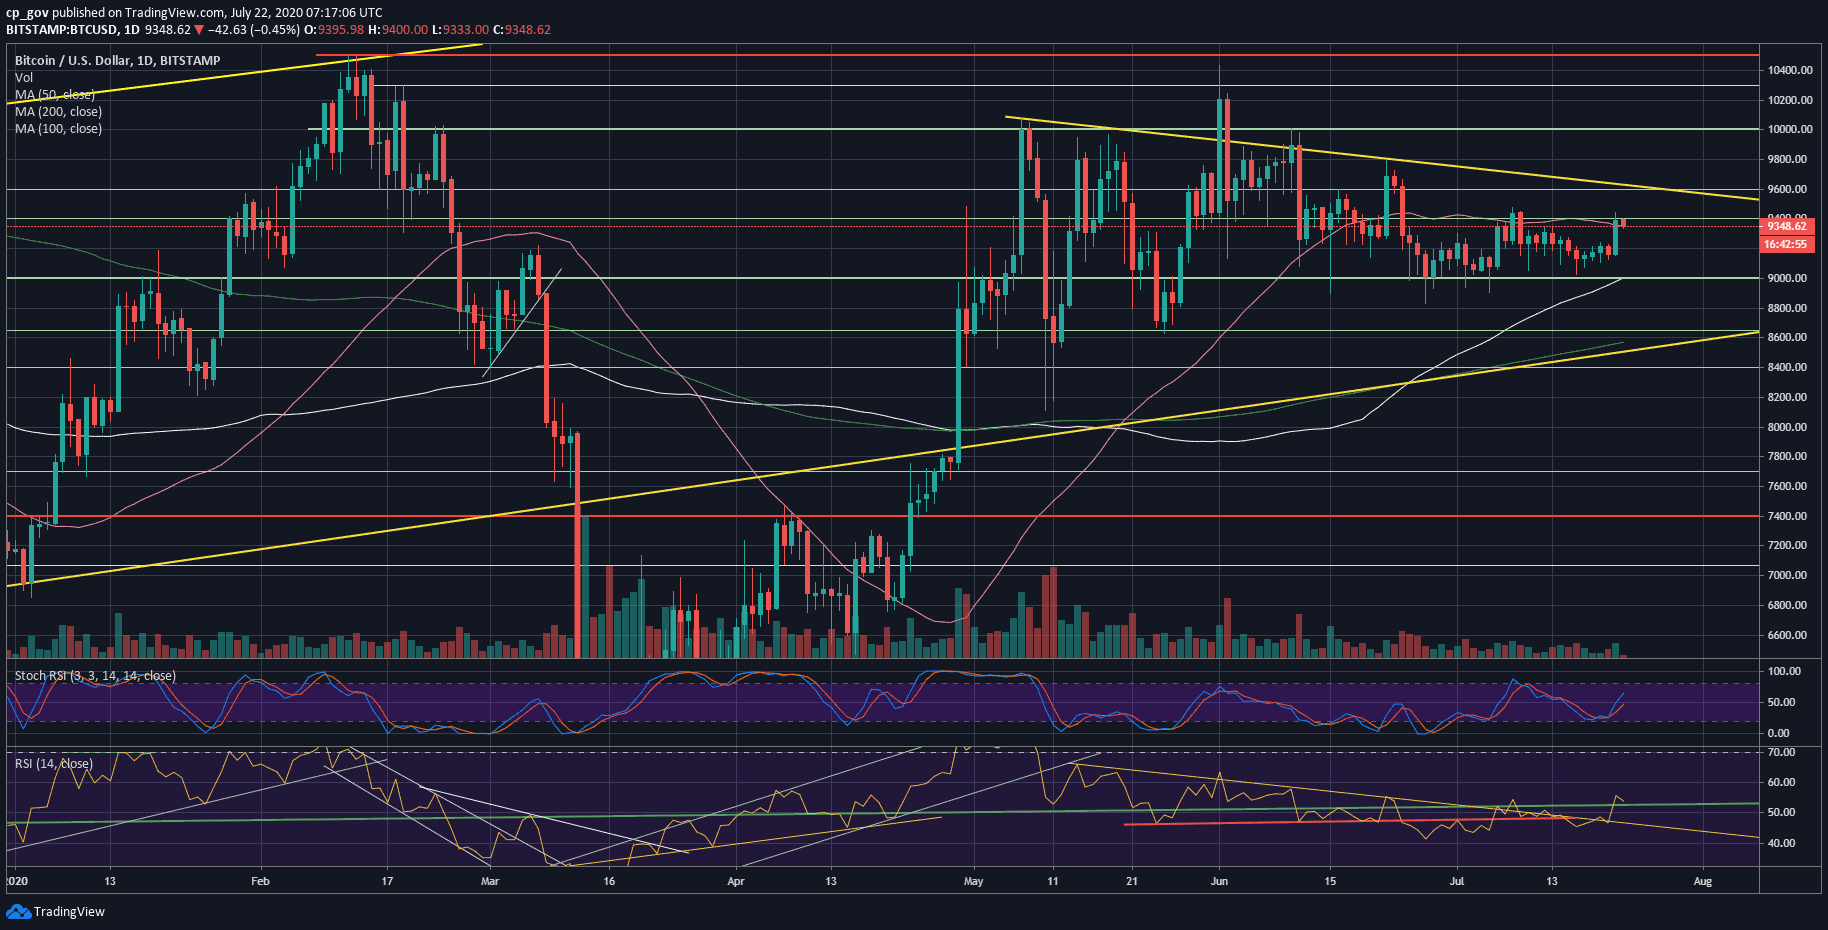
While the chances for a bullish breakout increase, there is a lot of demand around the $9350 – $9400 resistance area. This includes the significant 50-days moving average line (pink on the following 1-day chart).
On the other hand, a typical move for Bitcoin would be to build a new Bart Simpson’s head back down and mark this as a fake-out.
What is for sure is that once things are finally moving after a month or so of dull price action, Bitcoin is unlikely to get back its comfort zone just like it did around $9200. We are likely to see a continuation of this minor volatility of yesterday.
After yesterday’s breakout, Bitcoin is currently facing a huge resistance area between $9350 – $9400 (MA-50), in case of a breakout – the next significant resistance would be the familiar mid-term yellow descending trend-line on the daily chart, which lies around $9650. Further above lies $9800 and $10,000.
From below, the first level of support is now at $9300, followed by the famous $9200. Down below lies $9000, which also includes the 100-days moving average line (white), and $8800.
From a technical point of view, the daily RSI broke its own descending trend-line at around 46, surpassing 52 (the marked green line), and now retesting it as support. This, along with the Stochastic RSI oscillator, can assist the bulls.
Speaking about trading volume, yesterday’s volume was indeed a 10-days high. However, the volume levels are not here yet. The heavy traders, or whales, are not in the game yet.
Total Market Cap: $276.9 billion
Bitcoin Market Cap: $172.2 billion
BTC Dominance Index: 62.2%
*Data by CoinGecko