Bitcoin’s price has been trapped inside a consolidation range between $18K and $25K for months already, and is trading sideways with extremely low volatility. However, the primary cryptocurrency is now closer to the lower boundary of the range around $18K, and if this level breaks, we can expect new yearly lows.
By Shayan
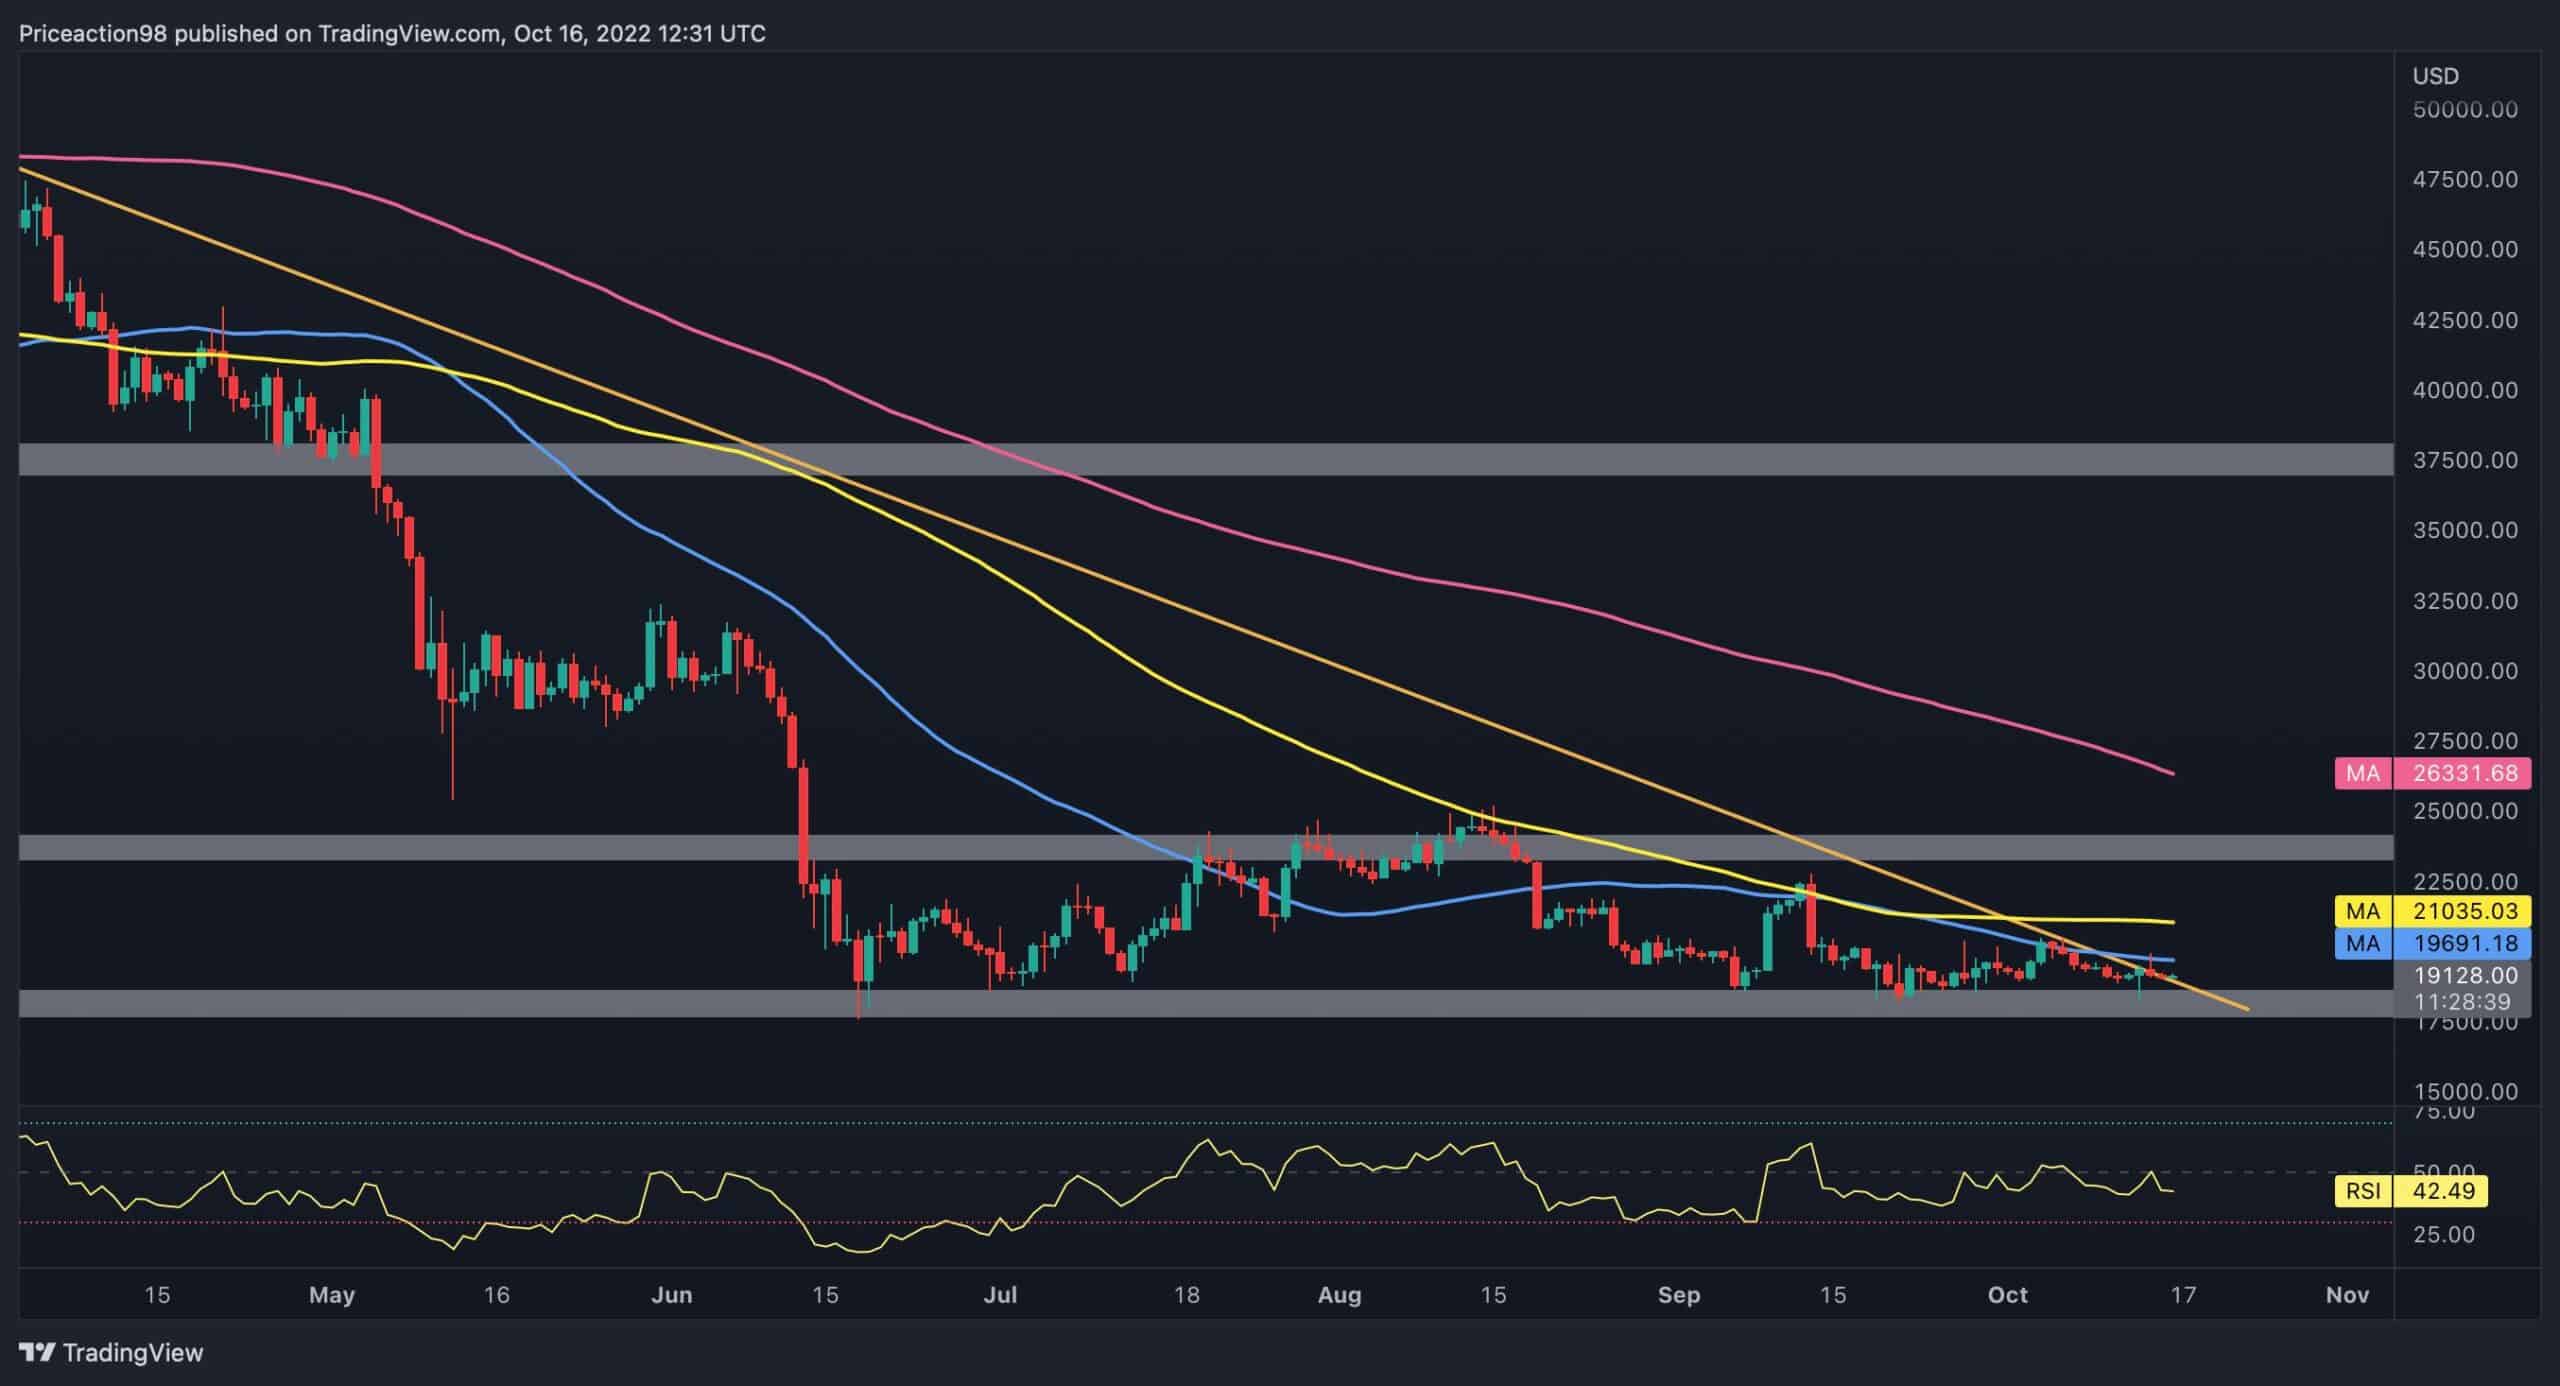
The following chart indicates that the market suffers from insufficient activity and a lack of demand. As a result, the price action has been minor, with low volatility, making it difficult to trade.
From the bullish side, BTC is trapped under two critical resistance lines: the 50-day moving average at the $19.6K level and the 100-day moving average around $21K. Bitcoin must break above these crucial levels with considerable trading volume, in order to retarget higher levels.
However, considering the current bearish state of the market, the price could get rejected to set new yearly lows (below $18K).
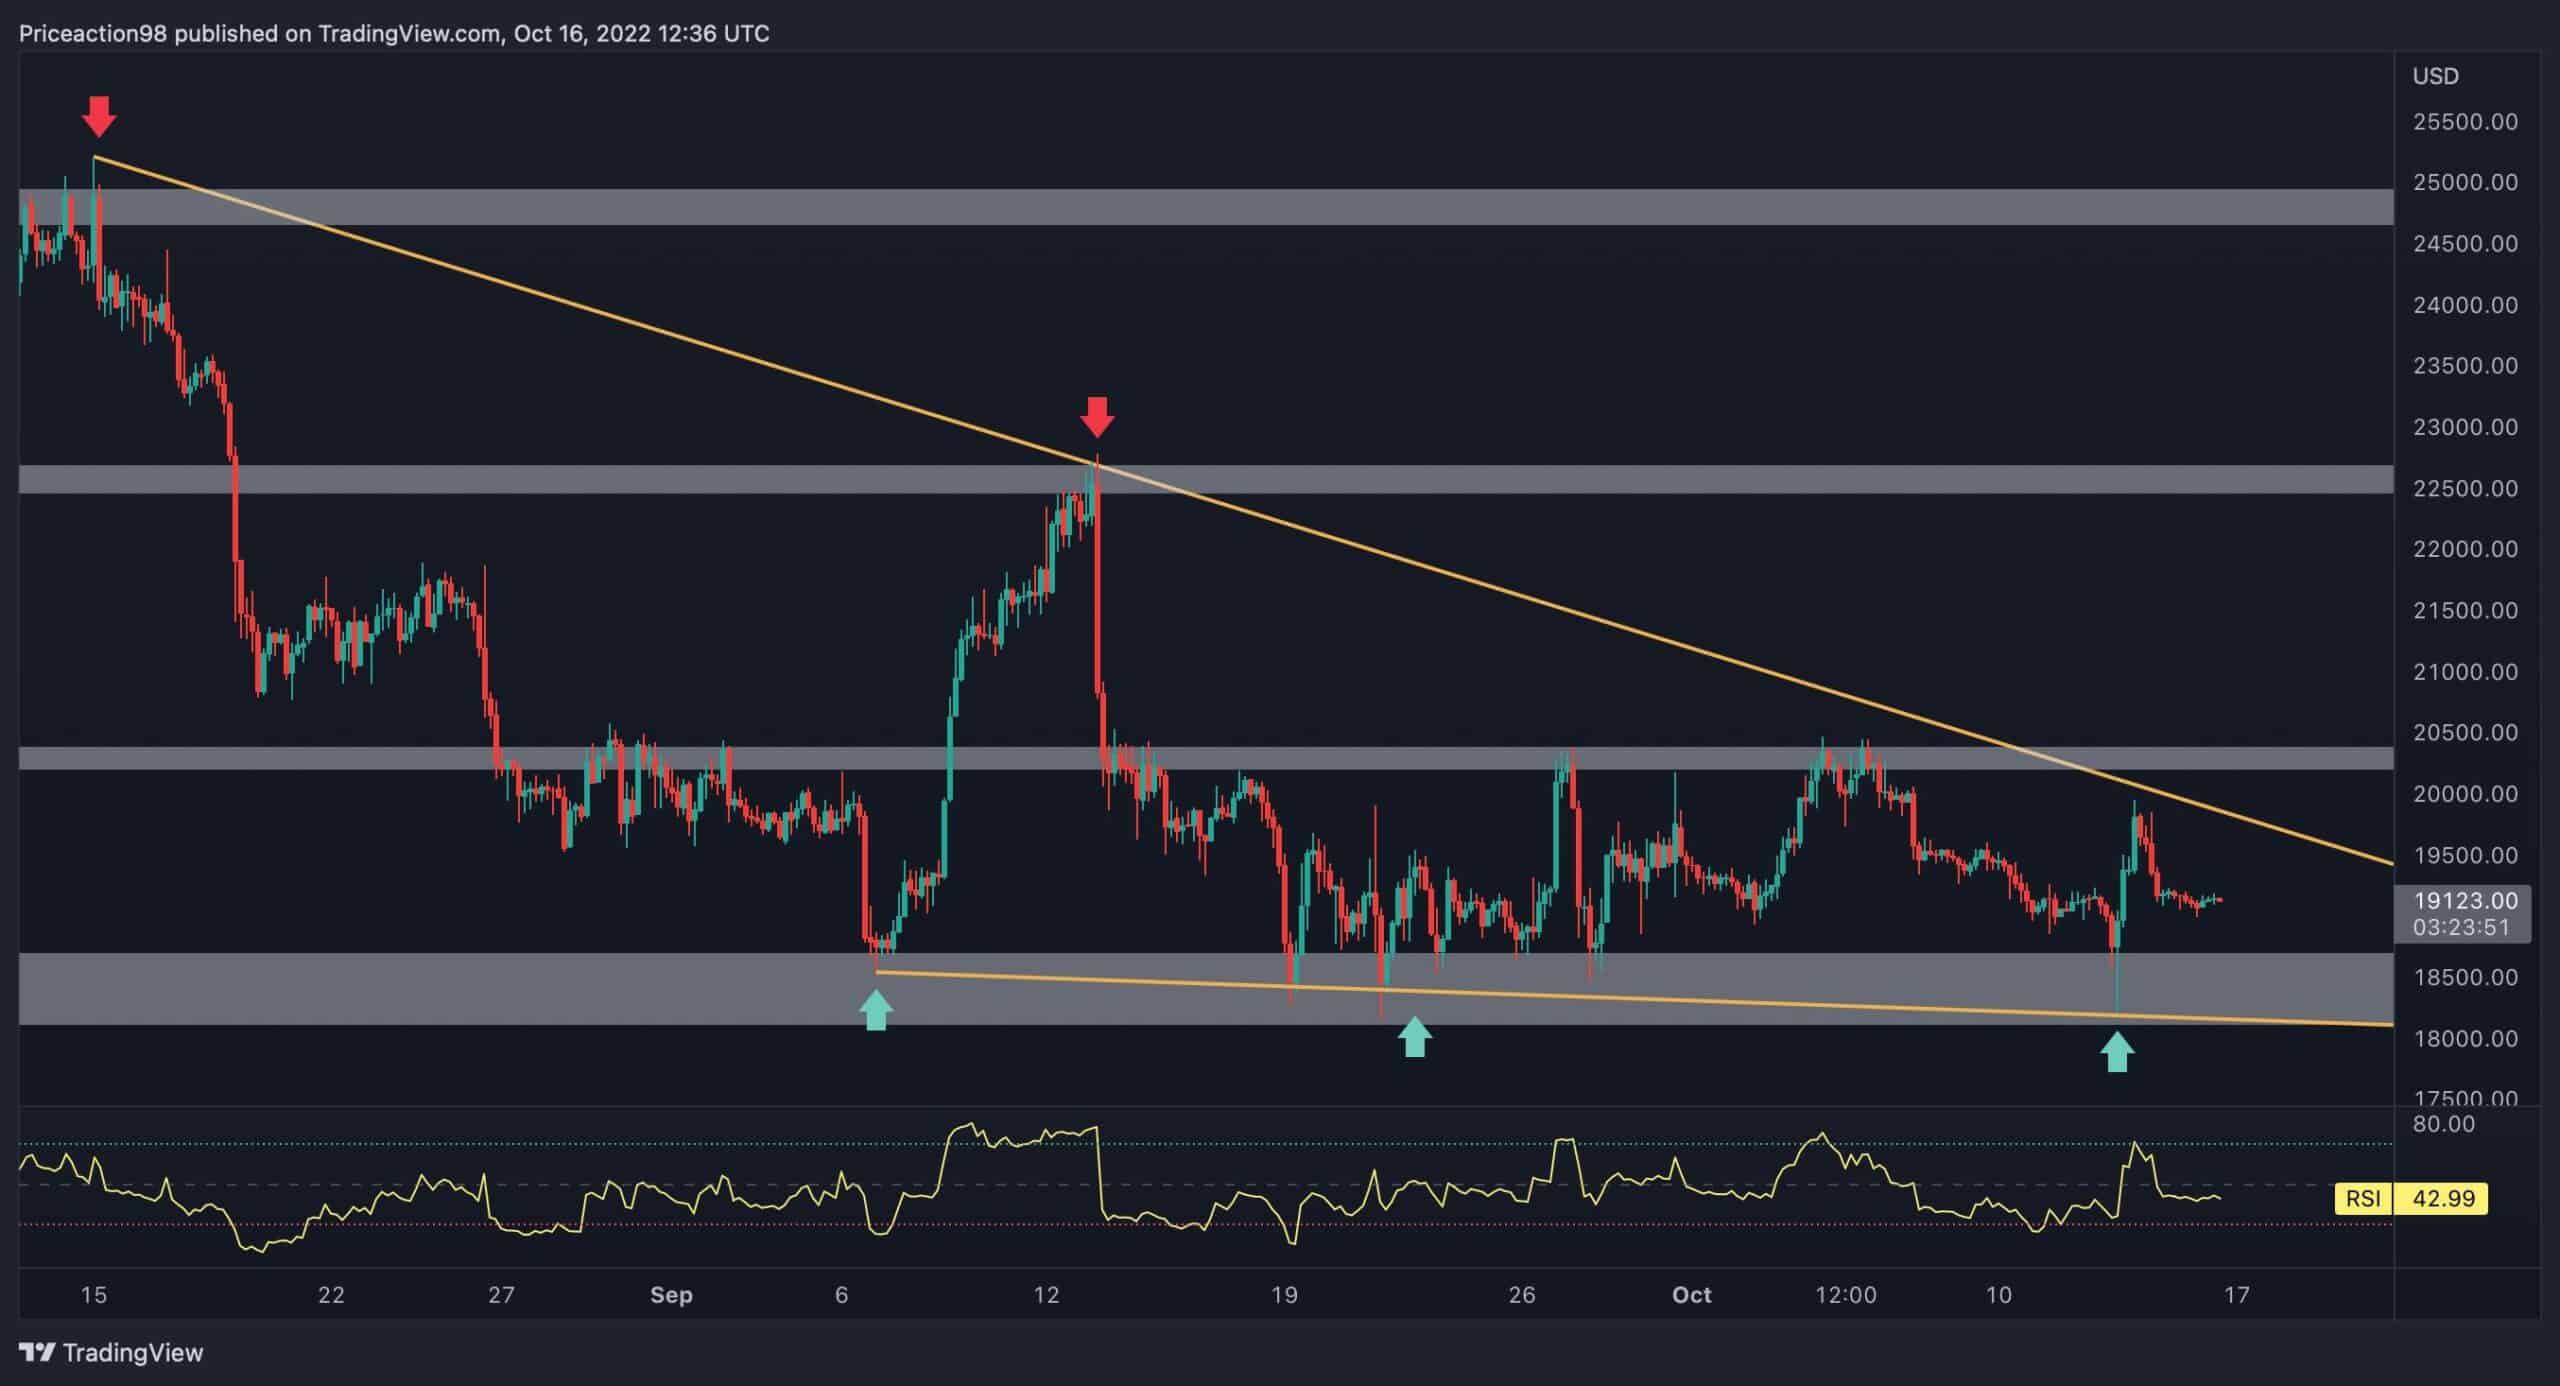
Looking on the shorter time frame, the price action has been trapped between $18K and $20.5K since mid-September. Meanwhile, Bitcoin has formed a bearish wedge pattern (as can be seen on the chart below).
After a steady decline from $20.5K, the price touched the wedge’s lower trendline and quickly bounced back on Thursday, amid the CPI data release.
Looking forward, the next direction of BTC will likely be determined by the breakout direction of the wedge. If a bearish breakout takes place, the market could fall to targets amid the $15K range. On the other hand, if the price breaks above the wedge, the market will potentially see a surge due to a huge short-squeeze event.
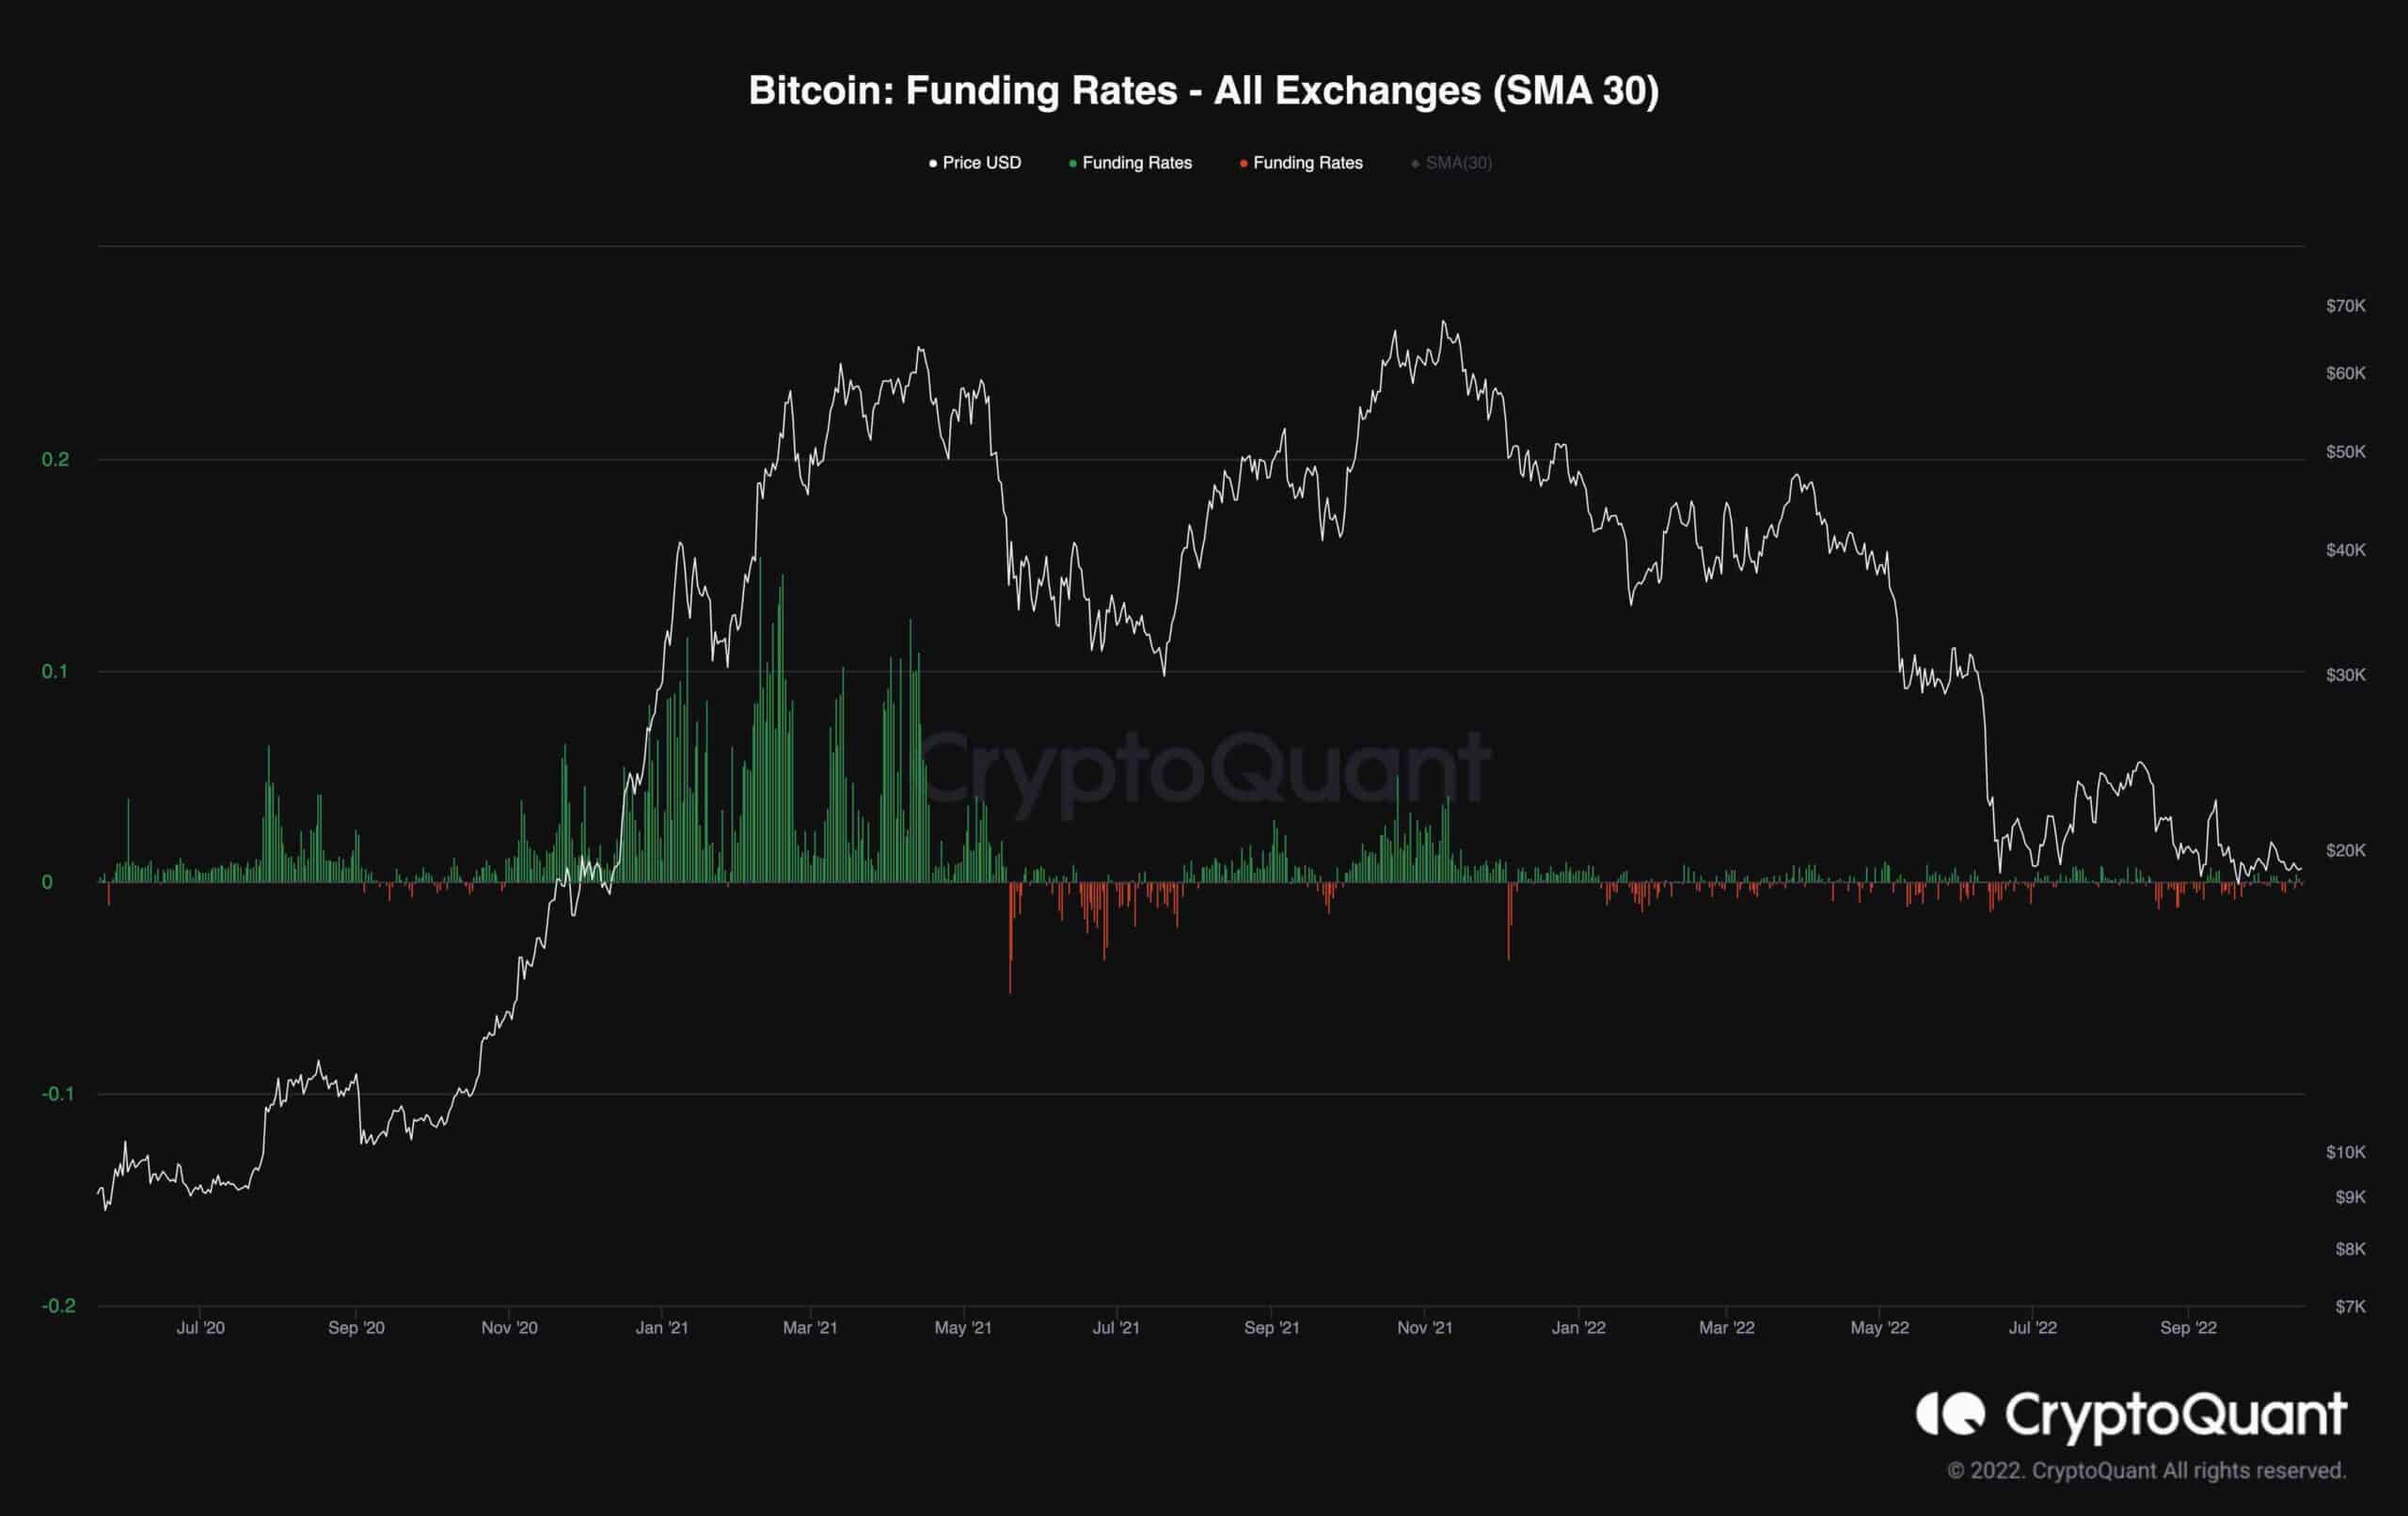
The perpetual futures market significantly affects the short-term price movement of Bitcoin. As a result, it could be beneficial to assess the sentiment of the futures market, and one of the best metrics to do so is through funding rates.
Simply put, the Funding Rates indicate whether futures traders are generally bullish or bearish on the upcoming price action of Bitcoin. Negative values indicate bearish market sentiment, while positive values signify a bullish sentiment.
Currently, the funding rates have turned negative once again, as the price has dropped from the $22K level and is consolidating on top of the $19K support. This suggests that the futures markets predict that Bitcoin will break to new lows.
However, the metric’s values are significantly low compared to years between 2019 – 2021. This indicates a massive lack of demand and activity in the futures market, and is typical to consolidation phases.
The metric should be tracked closely over the short term as possible extreme negative values increase the probability of a short squeeze, which could lead to a reversal in Bitcoin’s price sentiment.