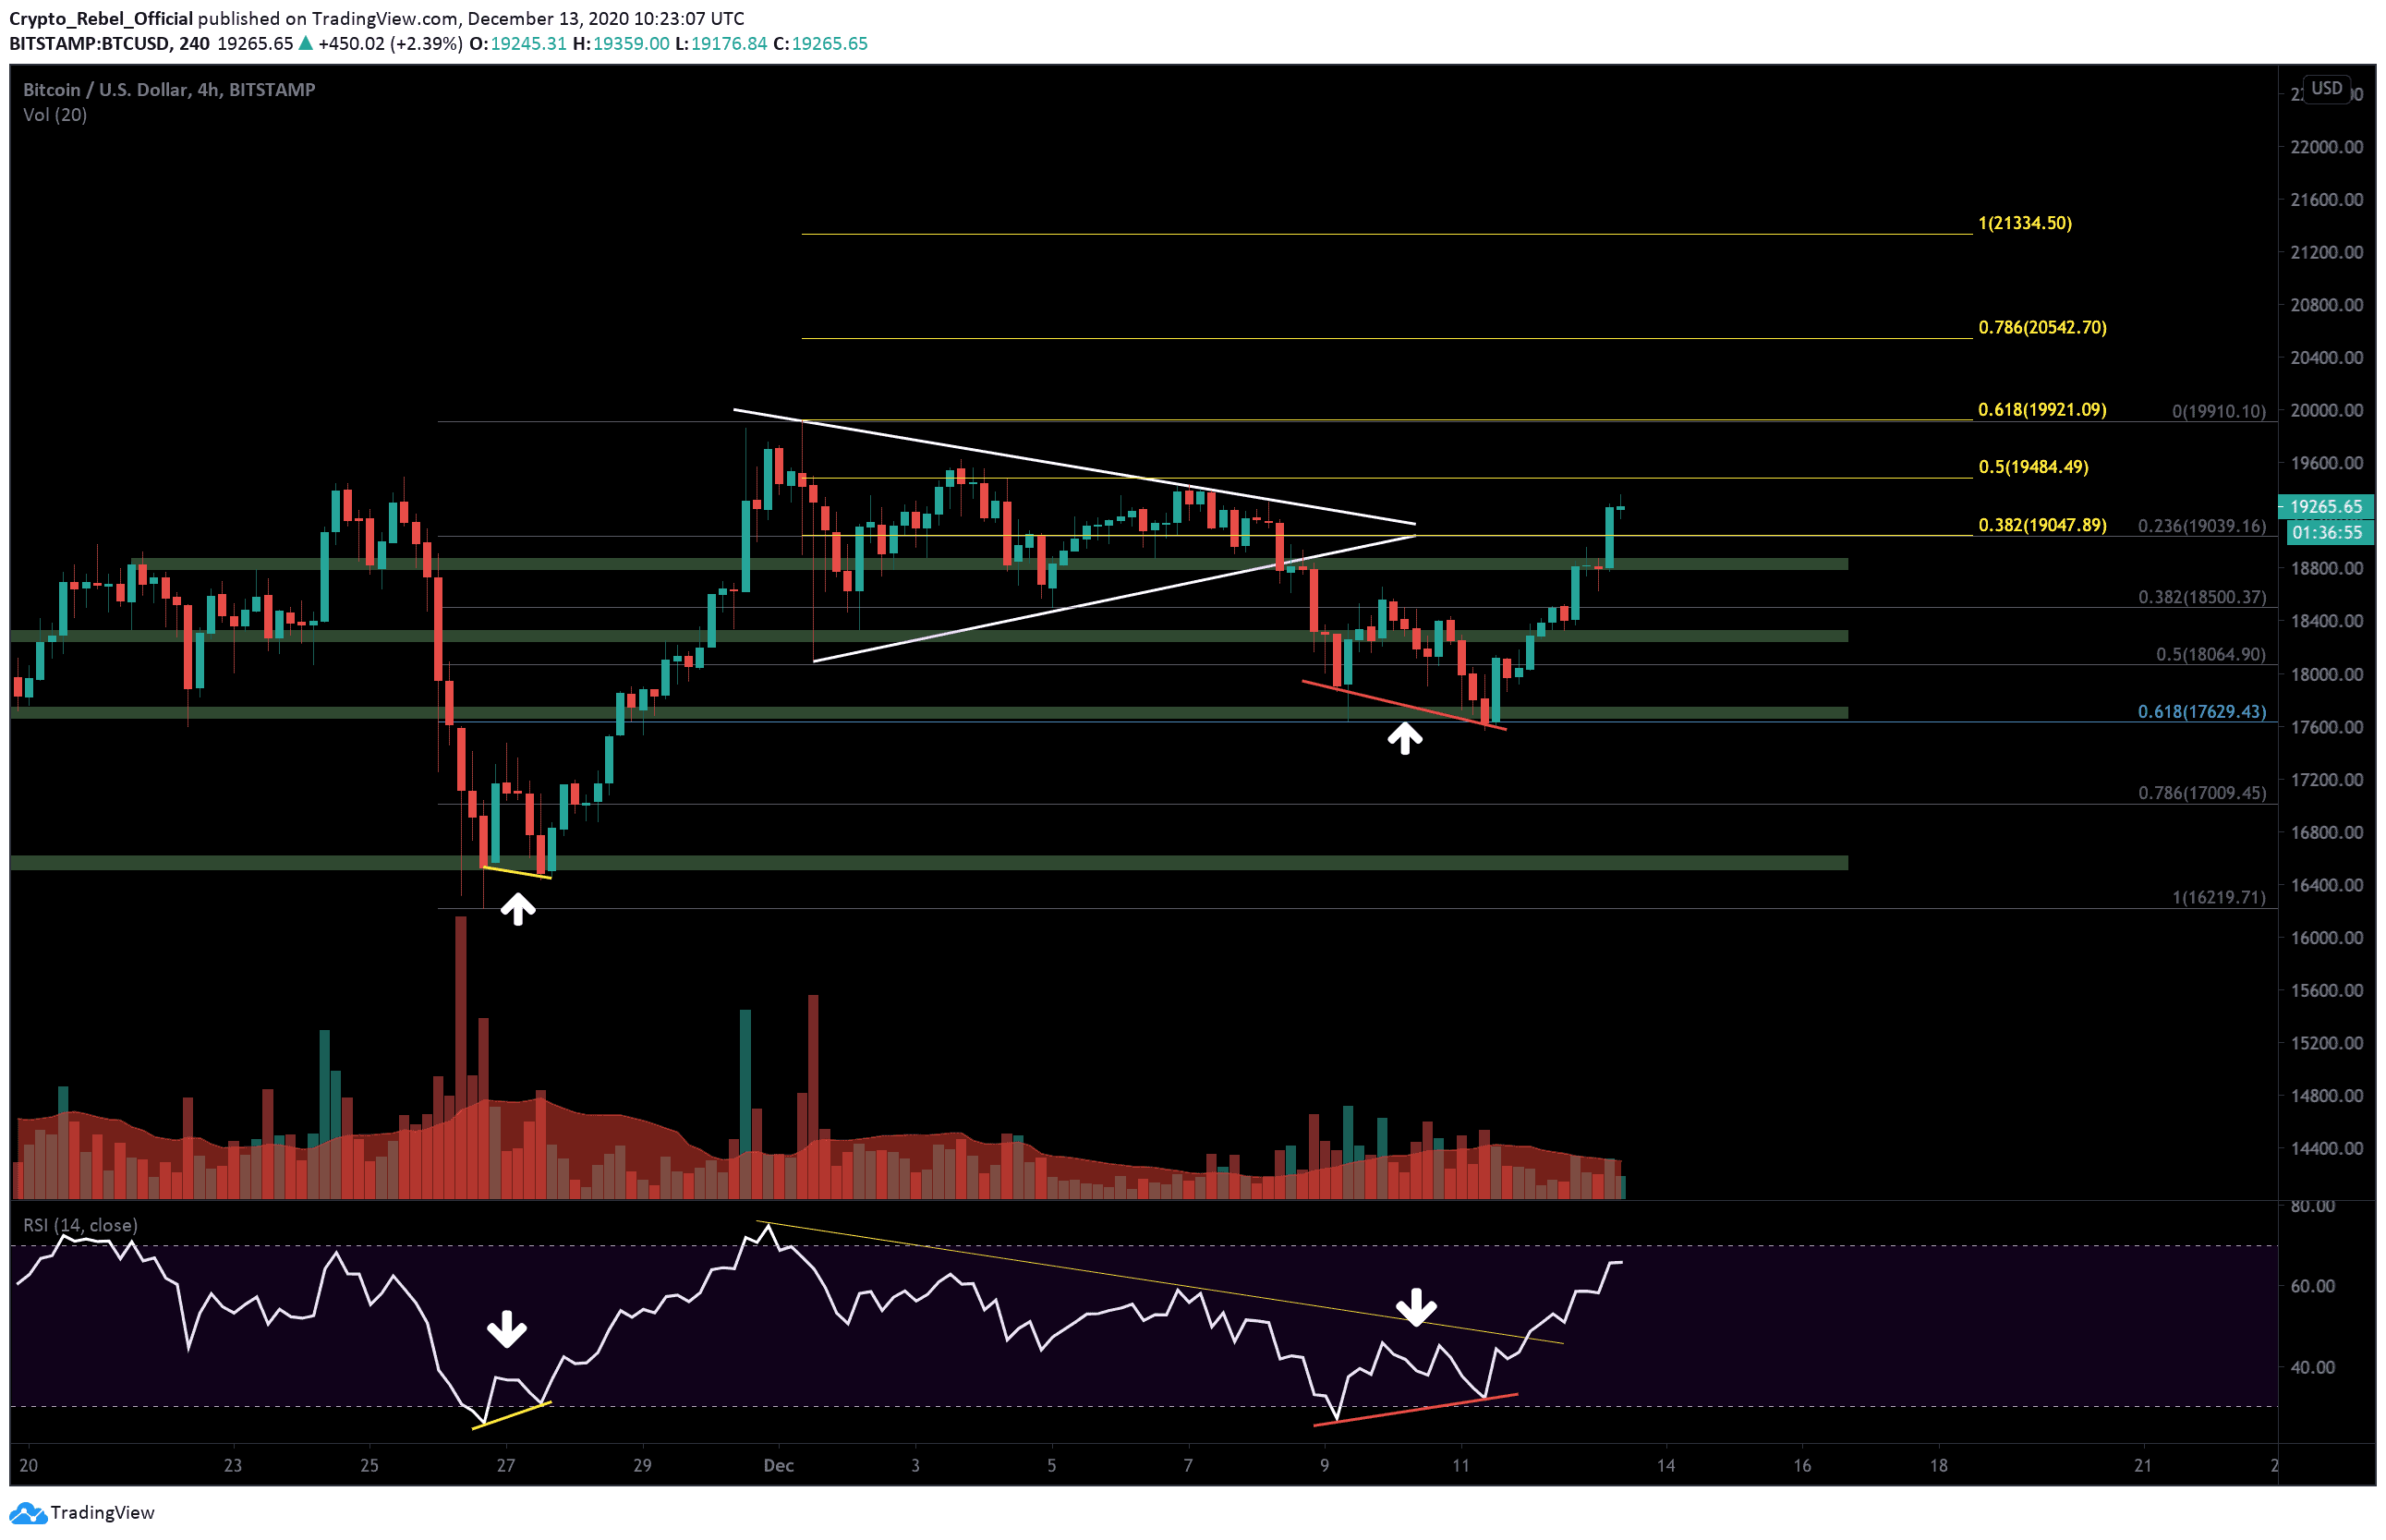
BTC/USD chart via Tradingview.
Bitcoin has successfully bucked the bearish trend that’s been suppressing prices for the past 10 days, following a strong bullish RSI divergence breakout that we predicted in the previous analysis.
After briefly dipping underneath the 200-MA on the 4-hour chart for the first time in over 60 days, strong buying momentum returned behind the asset and has since driven BTC up over $1,680 in under 48 hours.
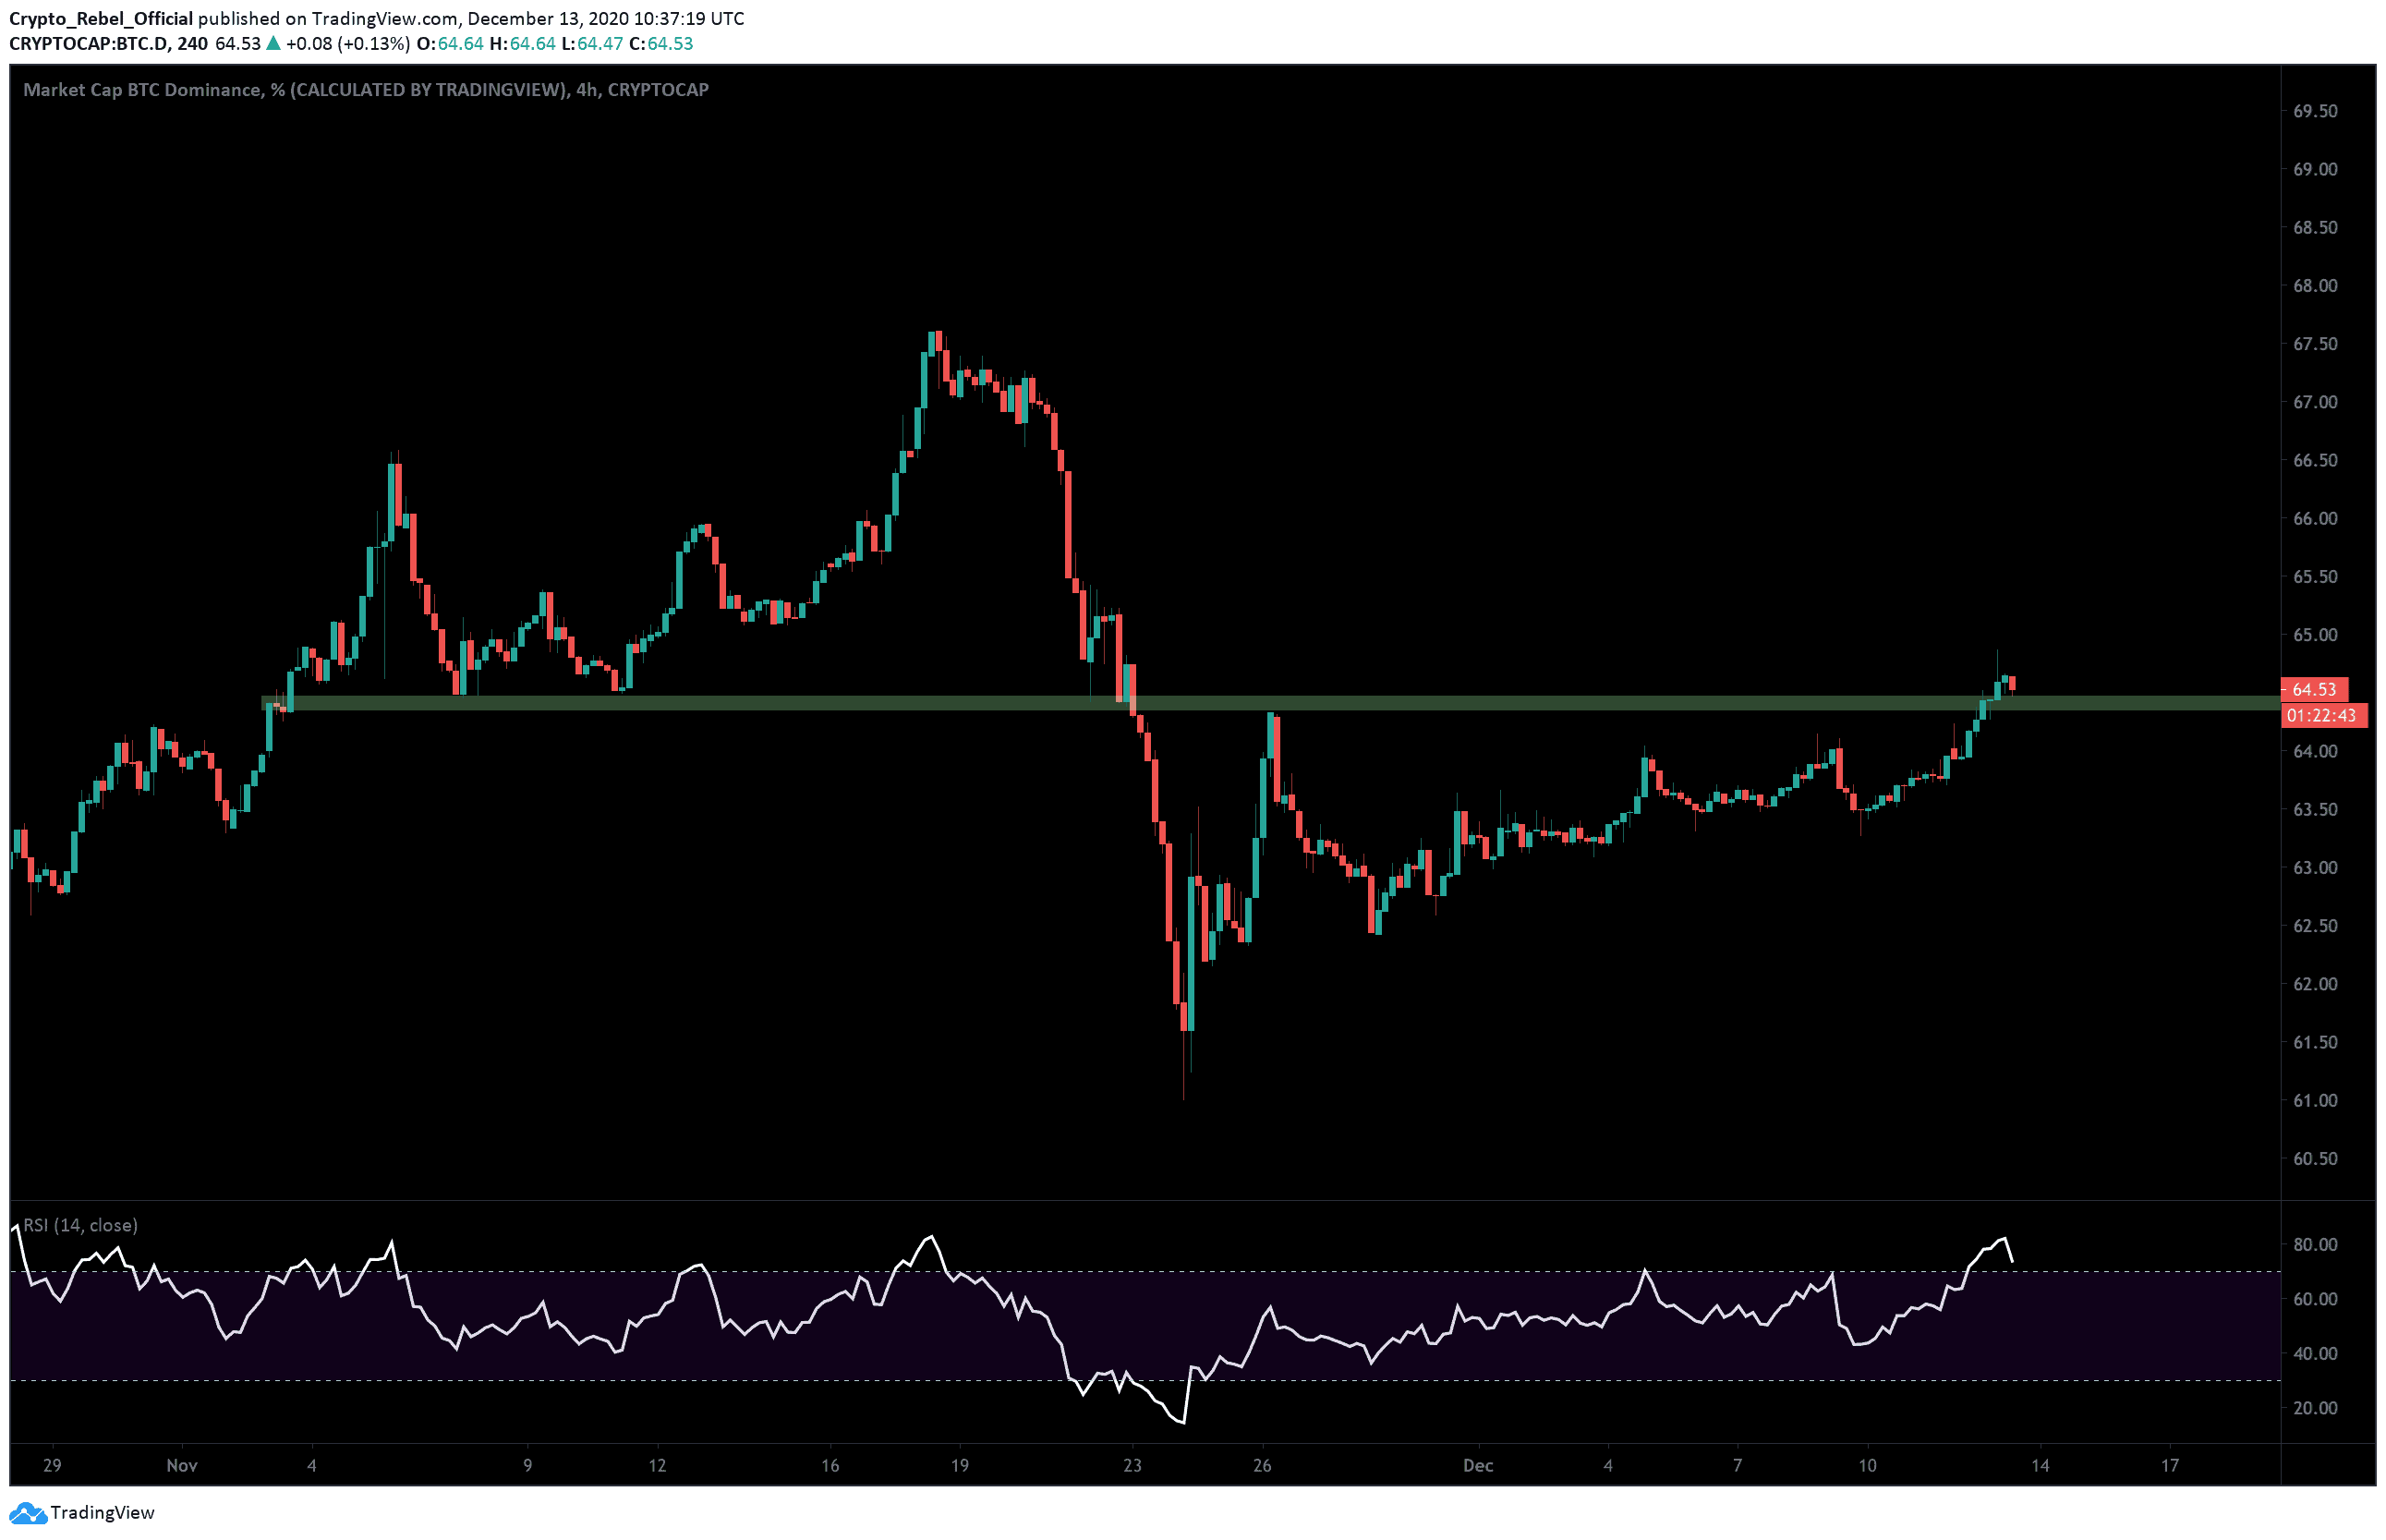
Over $40 billion has returned to the market since the trend reversal and has helped lift Bitcoin’s dominance back above a critical S/R level (green bar) on the BTC.D chart (see below). This is a healthy sign for Bitcoin and suggests more upside is likely in the short-term.
On the 4-hour BTC/USD chart, we can see that the leading crypto has overcome the first resistance at $19,140, which was the price point just before the pennant pattern rejection. BTC has also beaten the next minor resistance at $19,240 but is now stalling ahead of the stronger test at $19,400.
This particular level has defeated bitcoin buyers on several occasions in the last month. On November 24, this pricepoint stubbed out Bitcoin’s 80-day parabolic rise, and more recently, inside the pennant pattern, it prevented an early bullish breakout. This will be a key level to overcome in the short-term and one that will likely make or break Bitcoin’s chances of breaking back over $20K before the end of 2020.
If bullish traders manage to close above this area, we should expect the following levels to pose as areas of new resistance:
(1) $19,921 – 0.618 Fibonacci Extension level & current all-time high on Bitstamp’s chart.
(2) $20,542 – 0.786 Fibonacci Extension level.
(3) $21,334 – 0.1 Fibonacci Extension level.
Looking at the RSI right now, we can see that the current uptrend has catapulted the indicator line above the previous sloping resistance and is now less than four points away from breaking into the overbought region. This means we should expect to see a correction soon to allow prices to cool off before the uptrend’s next leg begins.
If bitcoin reverses at this point, however, and bears use the momentum of the overbought correction to push prices lower, then we should look to the $18,800 (green bar) level first as the most likely short-term support. From there, we also have $18,500 and $18,300, as well as $18,000, which should prop up prices against further decline.
Total market capital: $571 billion
Bitcoin market capital: $357 billion
Bitcoin dominance: 62.6%
*Data by Coingecko.