Chart by TradingView
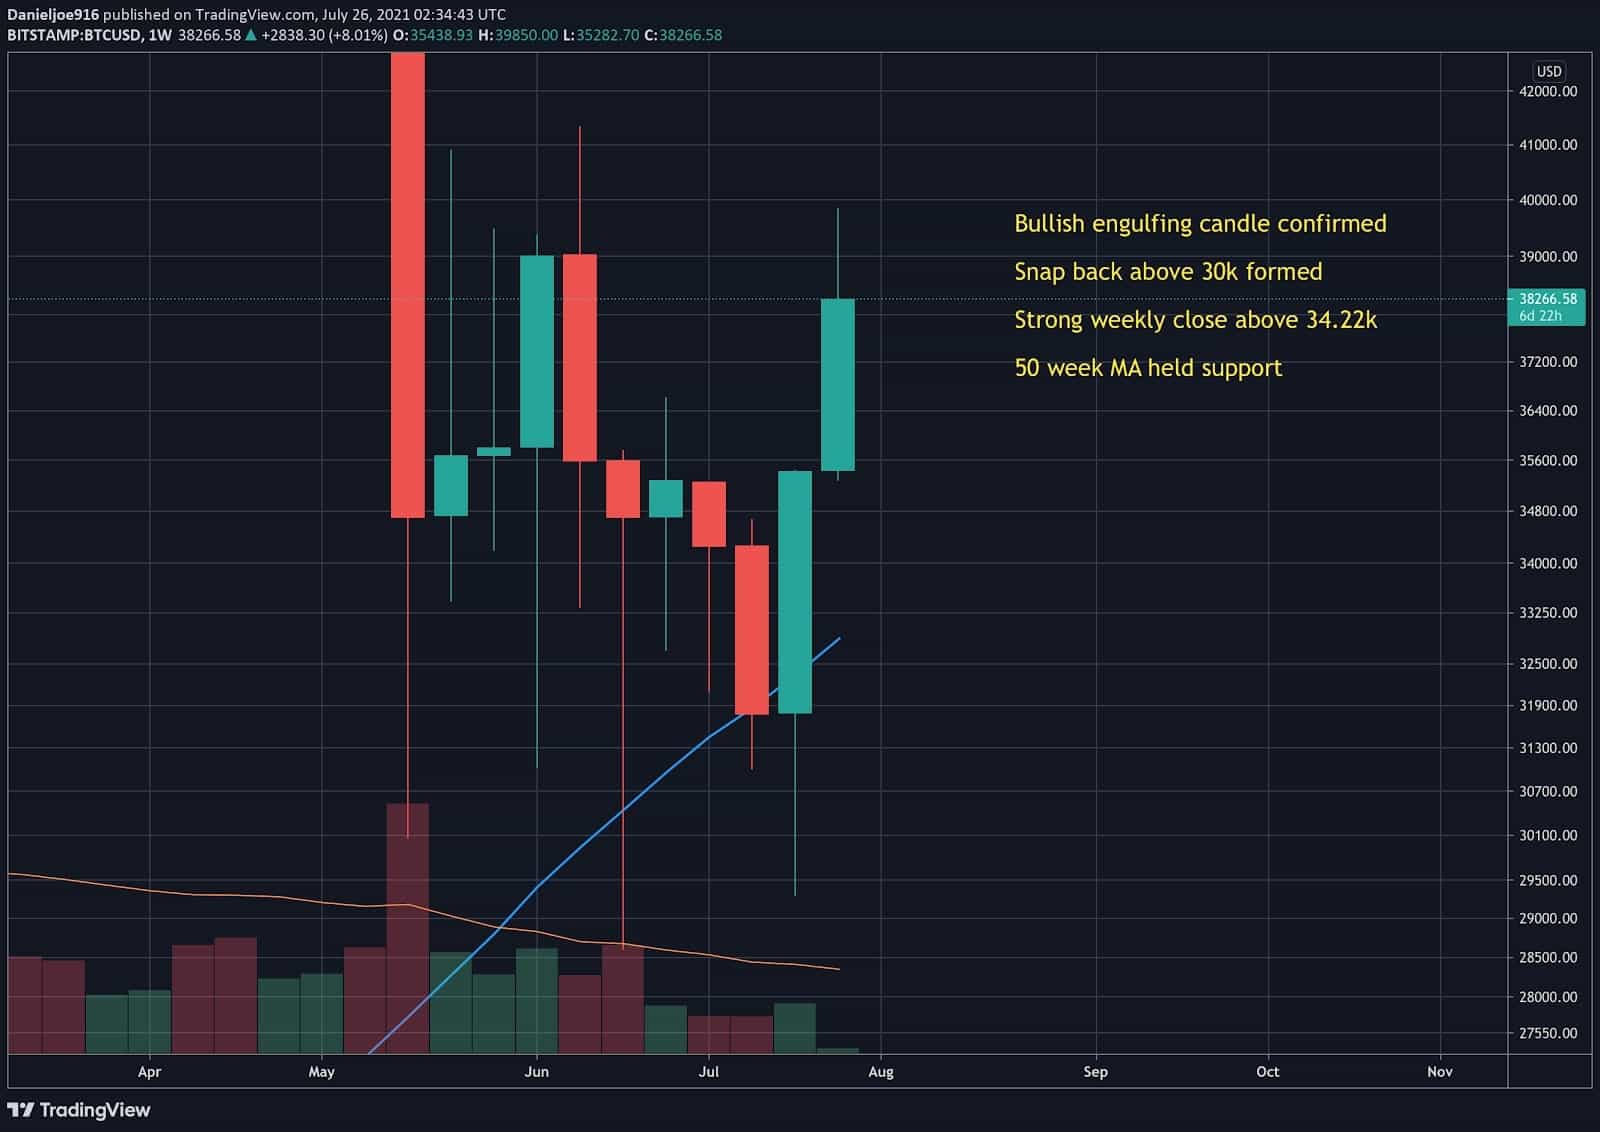
BTC may have printed one of the most important weekly candle closes of the entire year, which could potentially lead to the start of a trend reversal.
The previous week started with a false breakdown and snap back up, trapping bears who shorted the potential bottom at $29.2k. BTC then pushed above the near-term resistance at the 21-day MA – a successfully backtested support, and began a powerful rally, leading to what could be the strongest weekly close in a long time.
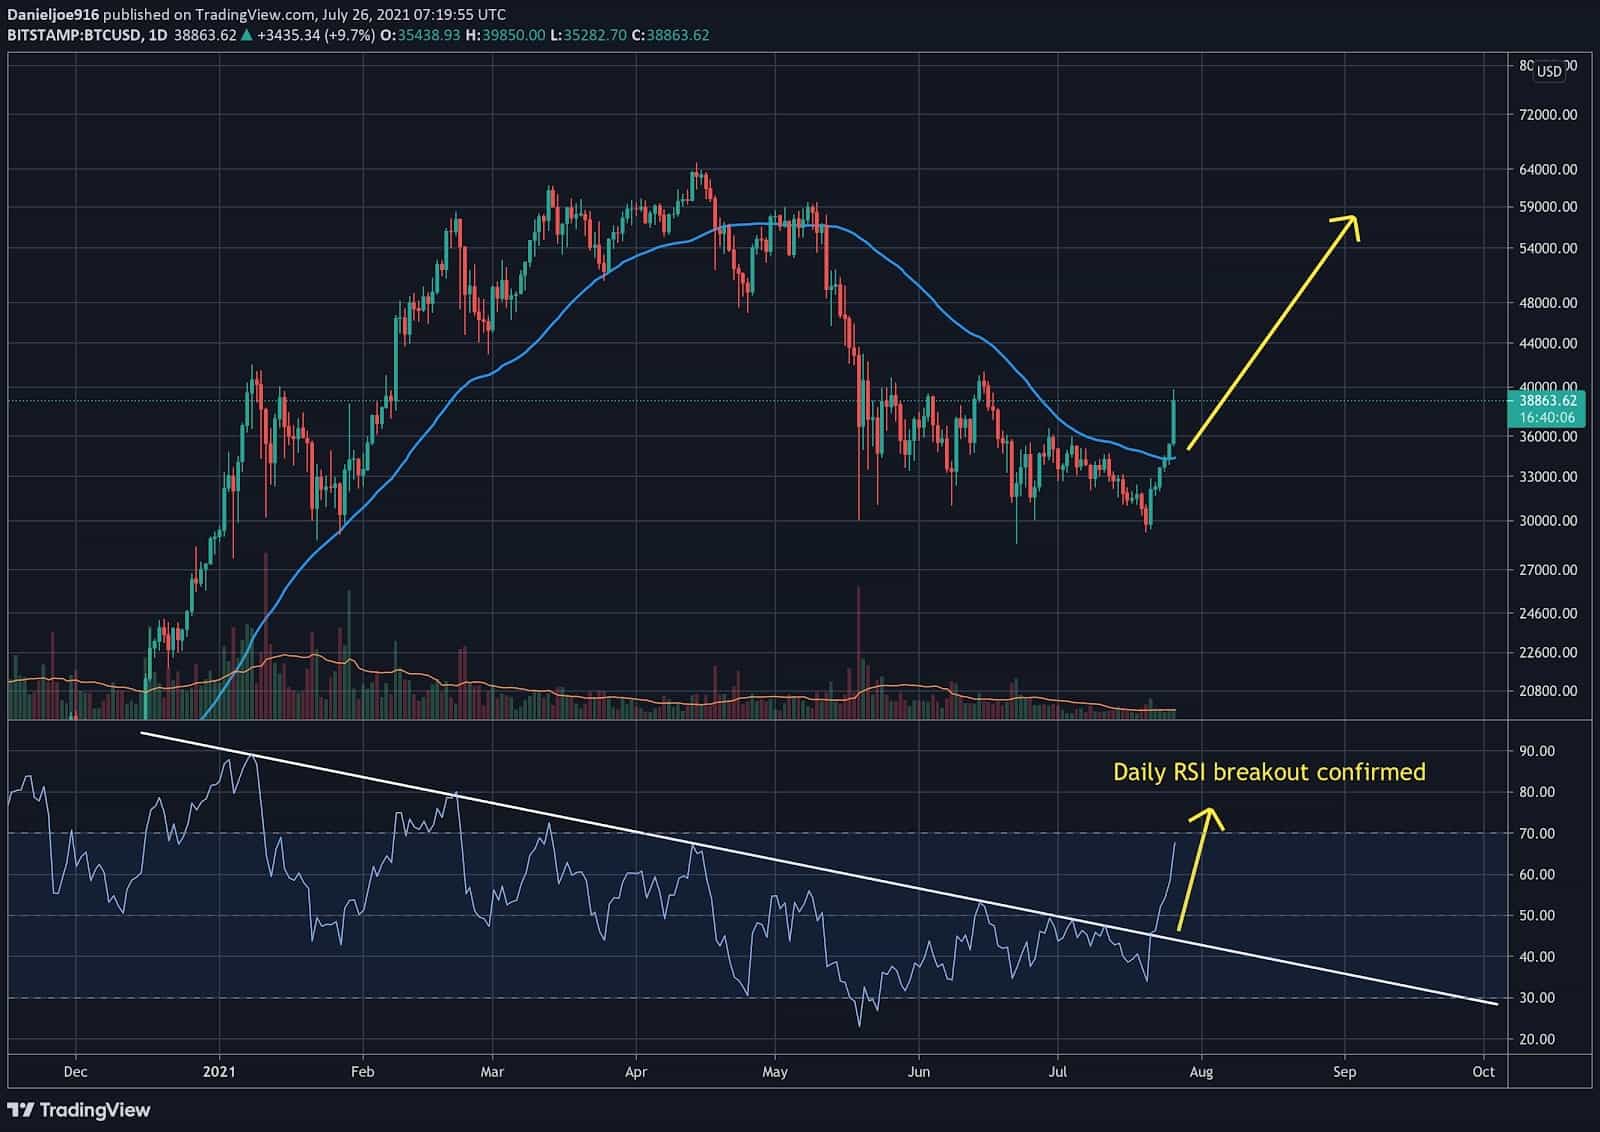
A key highlight of the week for BTC was the 7-month downtrend on the daily Relative Strength Index being broken, followed by a daily close above the 50 day MA with follow-through higher.
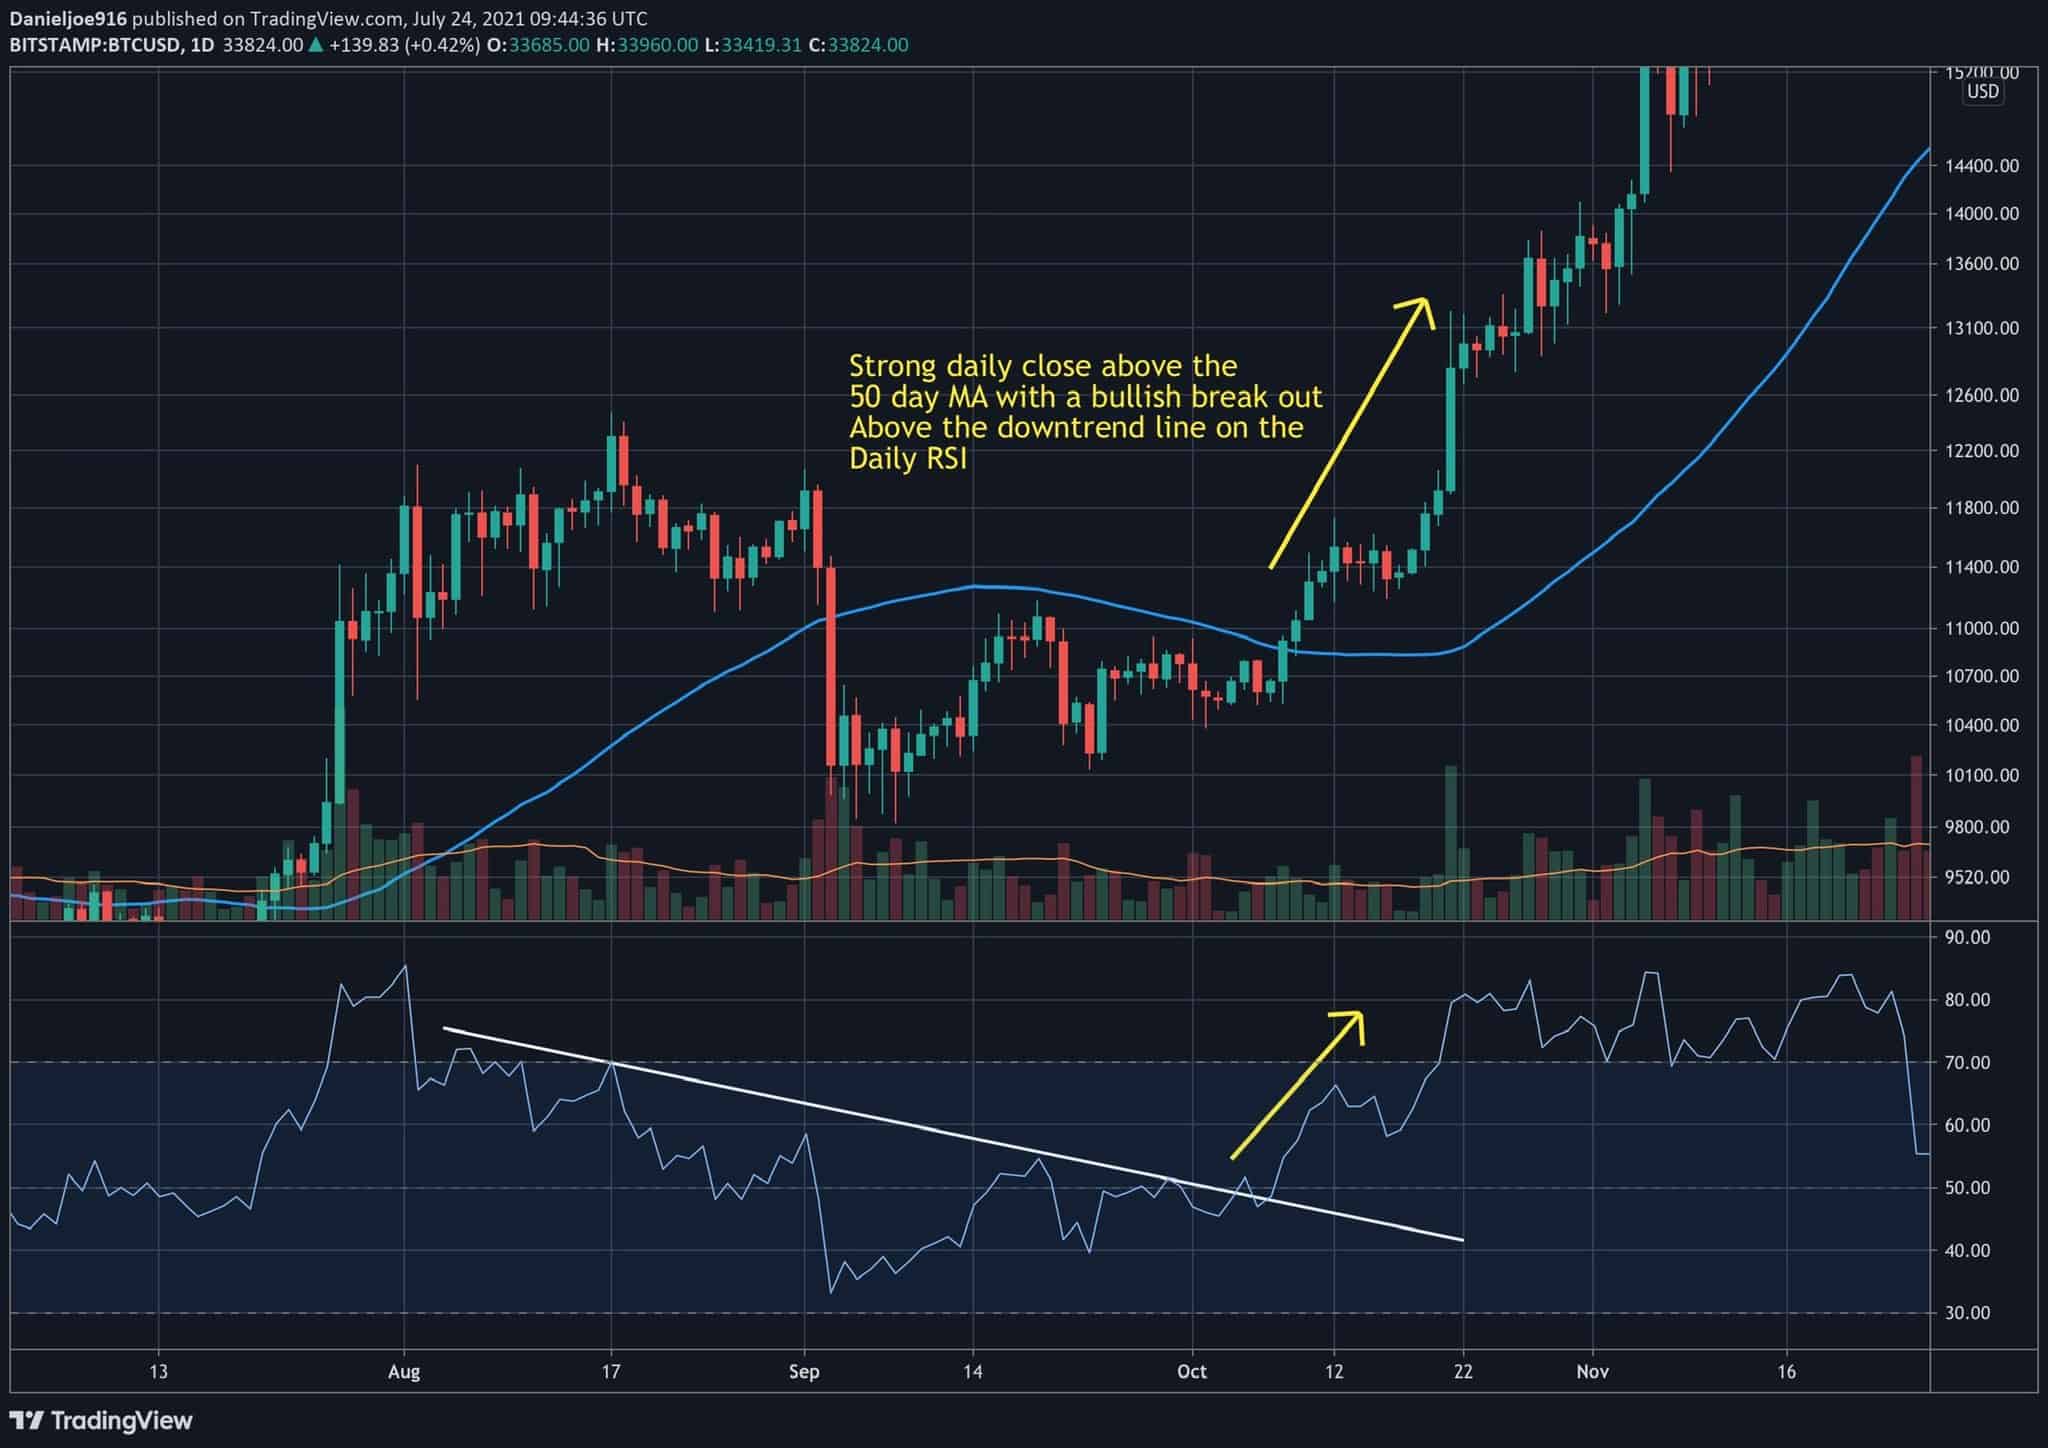
Previous price action suggests significant upside for BTC whenever a downtrend in the daily RSI is broken and BTC closes above the 50-day MA after spending some time below the key level.
The chart below shows BTC back in October 2020, closing above the 50-day MA and breaking the downtrend on the daily RSI, causing a massive breakout to the upside.
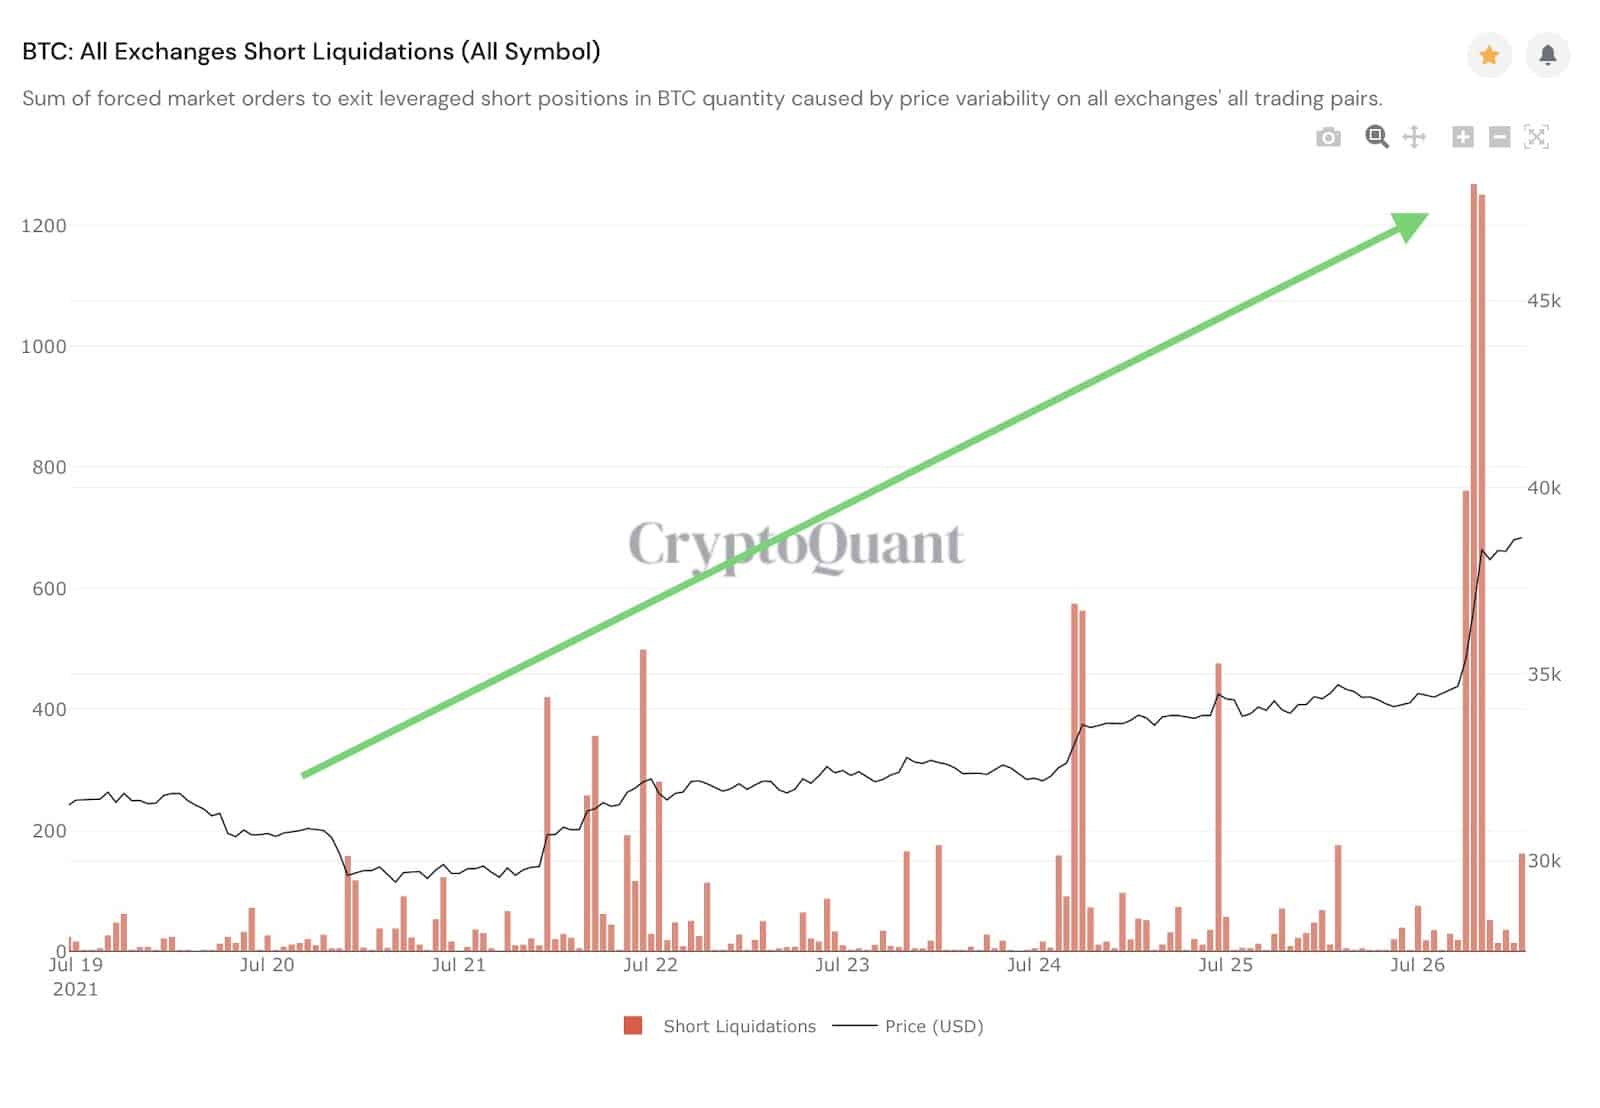
Through last week and currently, BTC shorts continue to get liquidated. Earlier today, 3278 BTC shorts were liquidated in a 3-hour window, making last week’s liquidations look small in comparison. It appears the bears are in denial of this rally as they continue to pile on shorts.
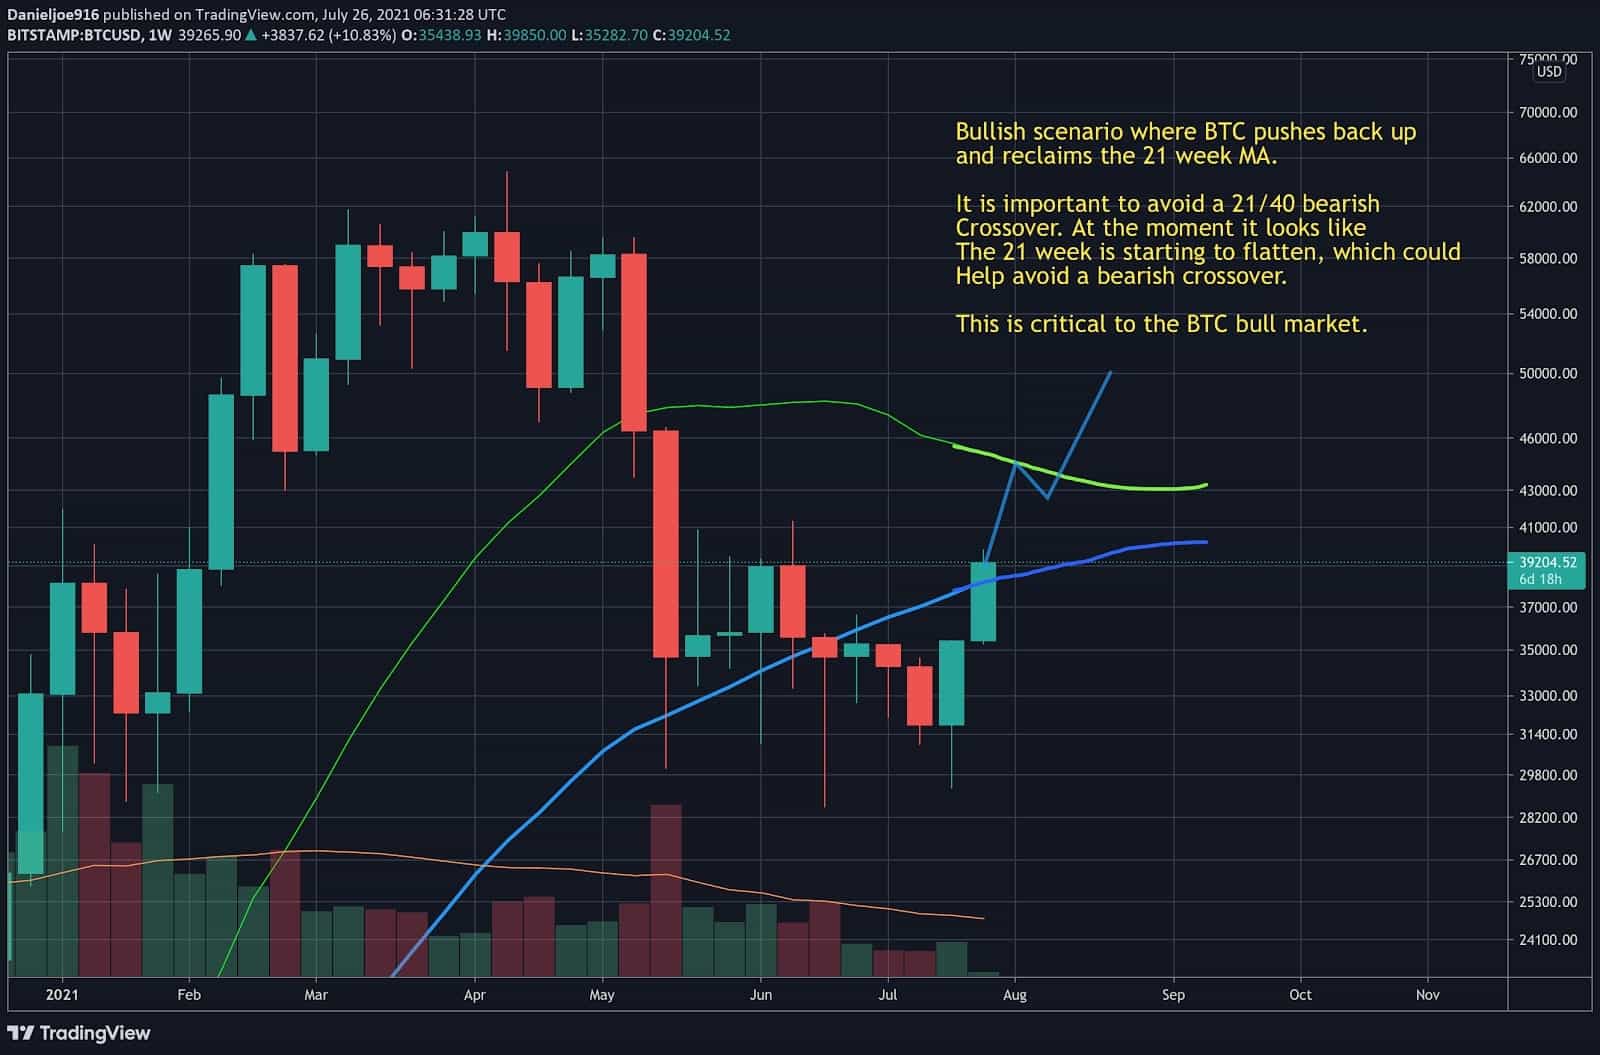
BTC made a strong weekly close, forming the snapback above $30k, formed a bullish engulfing candle, printed a massive hammer candle, and held the 50-week MA as support. This type of close signals a potential bottom and trend reversal for BTC, as major bottoms in pullbacks tend to form these kinds of candles.
This week, it is very important for BTC to follow through to the upside to validate the bullish hammer candle printed. At the time of writing, BTC soared to an intraweek high of $39.8k, finding initial resistance at the top of a 2-month long trading range at $40k.
The recent strength in BTC can be seen as a validation of the bullish on-chain signals that have been flashing during its consolidation. In short, large entities holding large amounts of illiquid supply continued to accumulate and hold BTC while smaller entities such as retail, small miners, and traders continue to sell BTC at losses. As more BTC is being added to the illiquid supply, there will eventually be a point where a supply shock hits the market as short-term holders reach capitulation, confirming selling pressure has been exhausted.
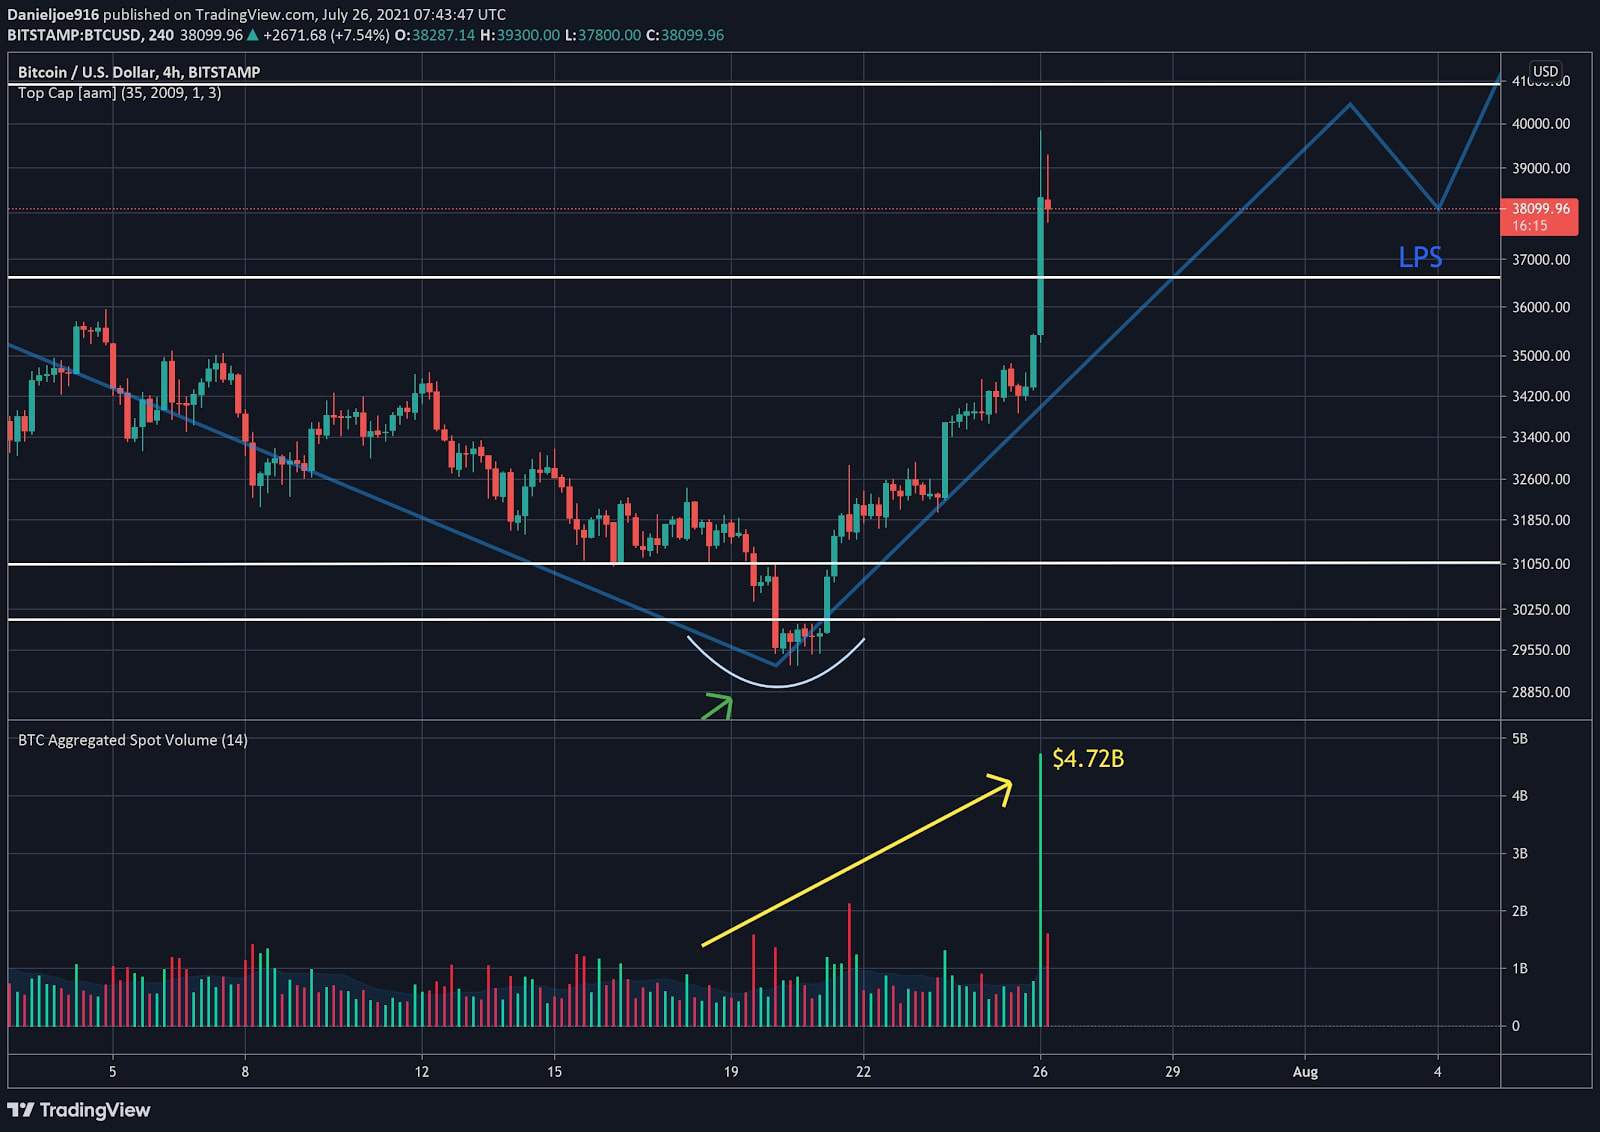
When the market reaches supply exhaustion, it is common to see very low volume on drawdowns and low volume as price pushes higher. Upon supply exhaustion, it does not require as much effort to push prices higher. Going forward, we will need to see volume increases at critical breakout points such as the $40k to $43k and at the 21-week MA.
So far, we see very strong volume as BTC pushes above near-term resistance at $36.6k, a level we have been watching closely. The strong 4 hour close above $36.6k registered an impressive $4.72 billion in aggregate volume.
It remains to be seen if BTC can hold onto the gains this week. If BTC follows through higher this week, continues to hold above the 50-day MA, and closes at the highs of the week, this will validate the weekly hammer and set BTC for further upside.
Bullish technicals, increasingly bullish momentum, a spike in volume, and positive on-chain data suggest further upside for BTC in the coming weeks as it appears the long-anticipated supply shock could be arriving.