Good things don’t come up so quickly. This is what happened with Bitcoin, following the first time in four months that the coin had crossed the $10,000 mark.
Two days ago, following the 10K break, we saw it rising a bit more but getting rejected before the next critical resistance price level at $10,300 – $10,400.
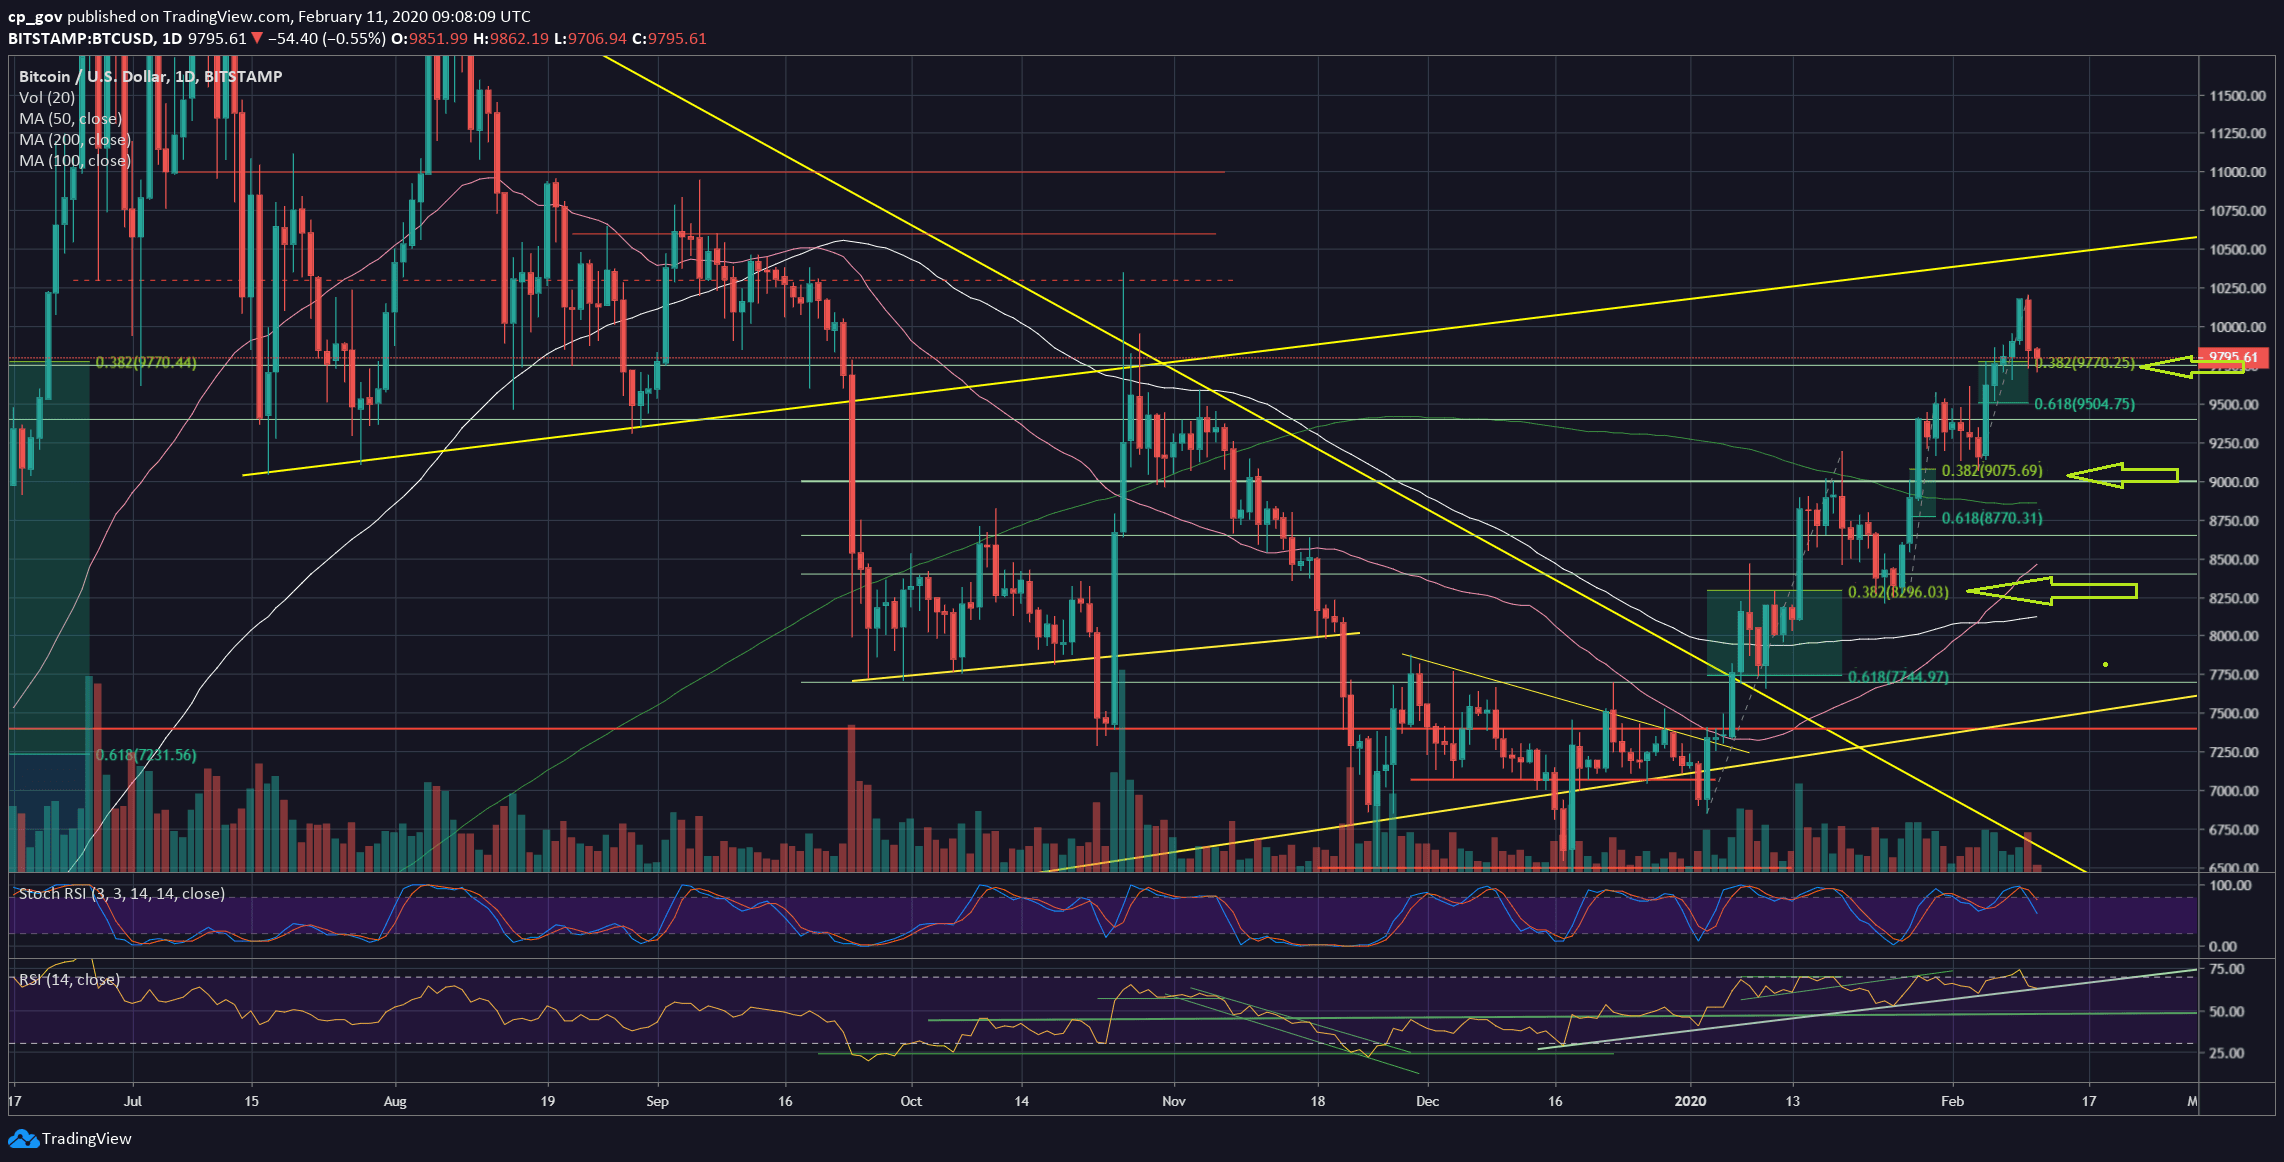
The positive is that everything is healthy so far. Looking at the following daily chart since the beginning of 2020, you can see three mini-rallies (including the most recent one from Sunday, all marked by green arrows), where Bitcoin had corrected back to the 38.2% Fib retracement level.
As of writing these lines, Bitcoin is testing the $9750 horizontal support, and guess what? This is accurately where the 38.2% Fib level of the most recent surge is at.
Besides, it’s not a surprise that the momentum indicator, the RSI, is also testing the mid-term trend-line at the same time – which, so far, is a decent higher-highs trend-line.
Total Market Cap: $281 billion
Bitcoin Market Cap: $178 billion
BTC Dominance Index: 63.3%
*Data by CoinGecko
– Support/Resistance levels: As mentioned above, if Bitcoin finds support around the current price levels (38.2% Fib retracement), then this can easily become the ground for a new 2020 all-time high very soon.
In case this level, together with the RSI, breaks down, then the next possible support might be $9500, which is the Golden Fib of 61.8% correction. Further below lies the $9400 support.
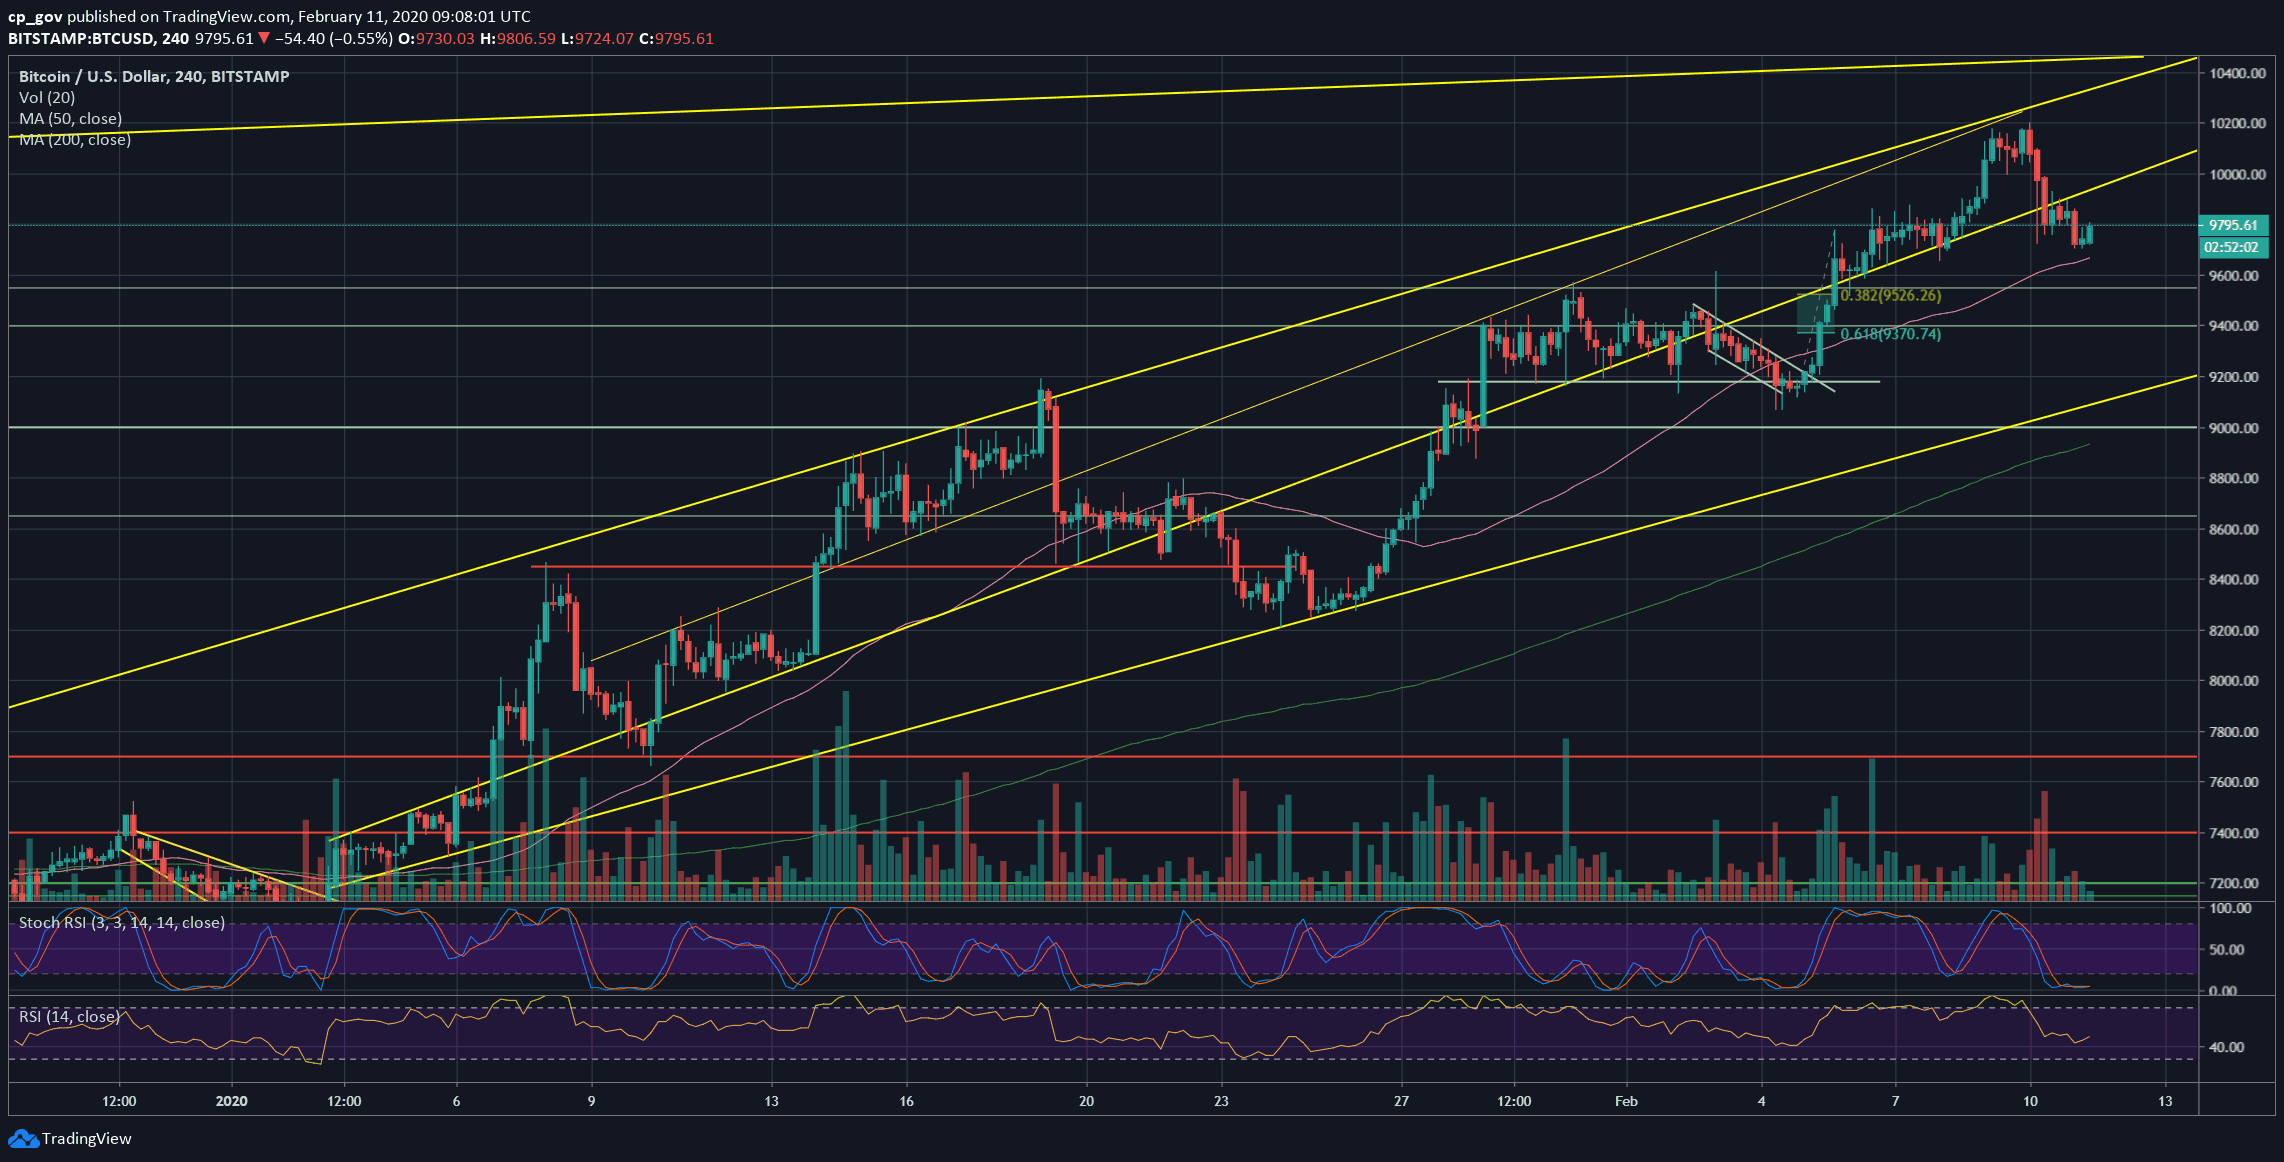
From above, after getting rejected, the first level of resistance is now around $9900, along with the middle-marked ascending trend-line on the 4-hour chart. As we can see on the following chart, Bitcoin broke down that line, and then confirmed it as new resistance by touching it and getting rejected at $9900.
The next significant resistance is the $10,200 area, which is the 2020 high that was reached during Sunday.
Further above lies $10,300 – $10,400. This old resistance contains the high that was reached during the “Chinese pump” on October 26 ($10,350), along with past horizontal resistance and the long-term ascending line as can be seen on both the following charts- 4-hour and daily.
– The RSI Indicator: Discussed above.
We can also mention here that the Stochastic RSI oscillator is under correction and points down (support the idea that there is more room to go down).
– Trading volume: We can see that yesterday’s drop carried a higher volume candle than Sunday’s candle following the price surge to $10,200. This might be a little bit tricky and not a positive sign for the bulls. However, both trading days’ volume candles aren’t very significant, and Sunday’s volume can be explained because of the weekend.