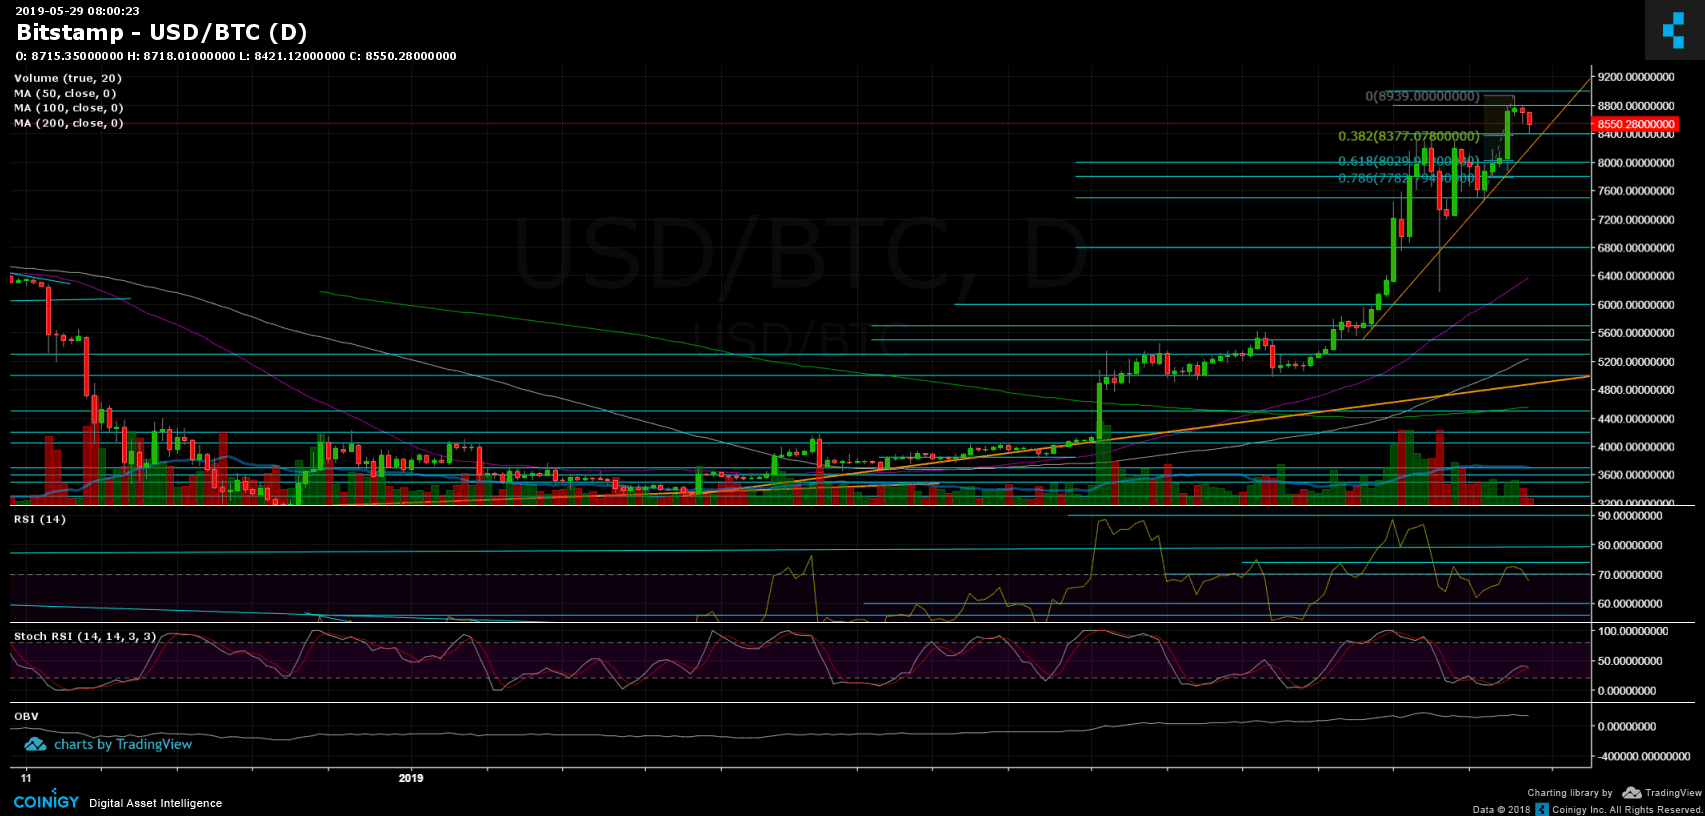
Let’s start from the bigger picture: As can be seen, Bitcoin had gone through a decent parabolic move since breaching the $6000 significant resistance. A parabolic move is always more fragile than a steady rise; we all know how it ended last time (Nov-Dec 2017).
Over the past three days, since BTC gained momentum quickly reaching the height of $9000, we saw a recent hours’ correction in the cryptocurrency’s price to $8400.
There is no such asset that only points upwards, and added to the written above, corrections are healthy in building a steady growth. As can be seen, the recent hours’ correction had reached past resistance of $8400 (now being confirmed as support), as well as the 38.2% Fibonacci retracement level.
Should the bulls get panic? Very early to say so.
Total Market Cap: $268 Billion
Bitcoin Market Cap: $151 Billion
BTC Dominance: 56.6%
– Support/Resistance:
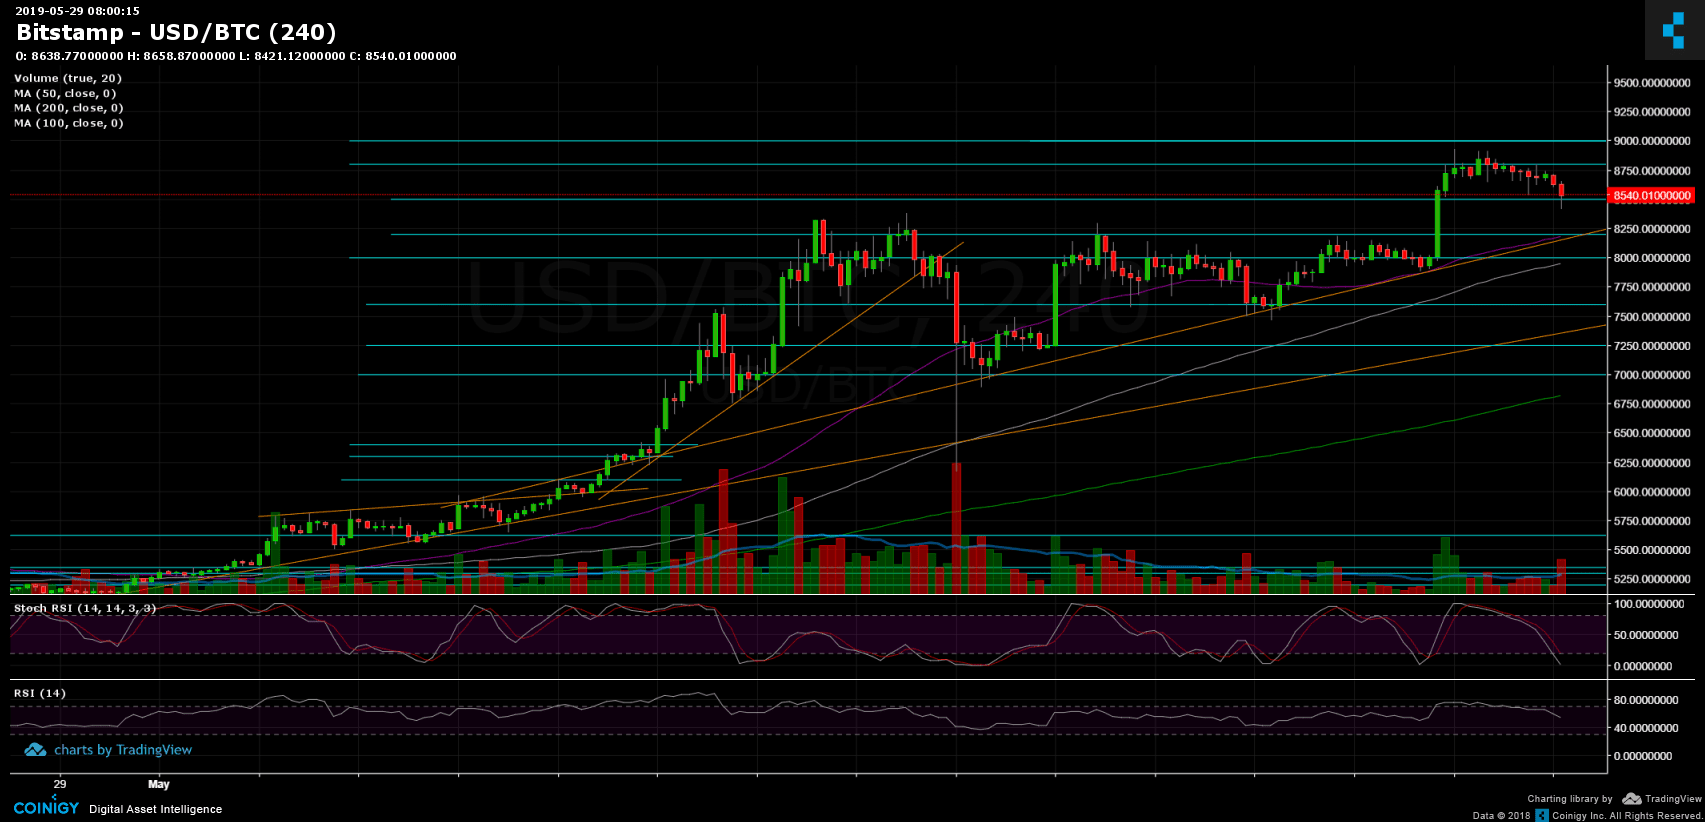
From below and as mentioned above, $8400 is the closest support level. Below lies the short-term ascending trend-line, along with the $8200 support area. Further below lies $8000, $7800 and $7600 (this week’s low along with the mid-term ascending trend-line).
From above, the $8800 – $9000 had turned into a substantial resistance area. Above lies the $9000 resistance mark and previous 2019 high, then $9200 – $9300 zone, before reaching the $9700 – $9800 area which was the highest of May 2018, and that is the last barrier before BTC reaches $10,000.
– Trading Volume: The volume of the previous surge wasn’t as strong as the moves before, could be because of the weekend. However, the past few days the volume is around average, as in comparison to the last month.
– Daily chart’s RSI: In our recent BTC analysis, we mentioned that the RSI is now facing the 74 resistance. As can be seen, the RSI had turned around facing down, shortly before the coin had lost momentum. However, the RSI is still in the bullish territory.
– BitFinex open short positions: Since our recent price analysis, there hasn’t been much change, whereas the open short positions number stands around 20 K BTC positions.