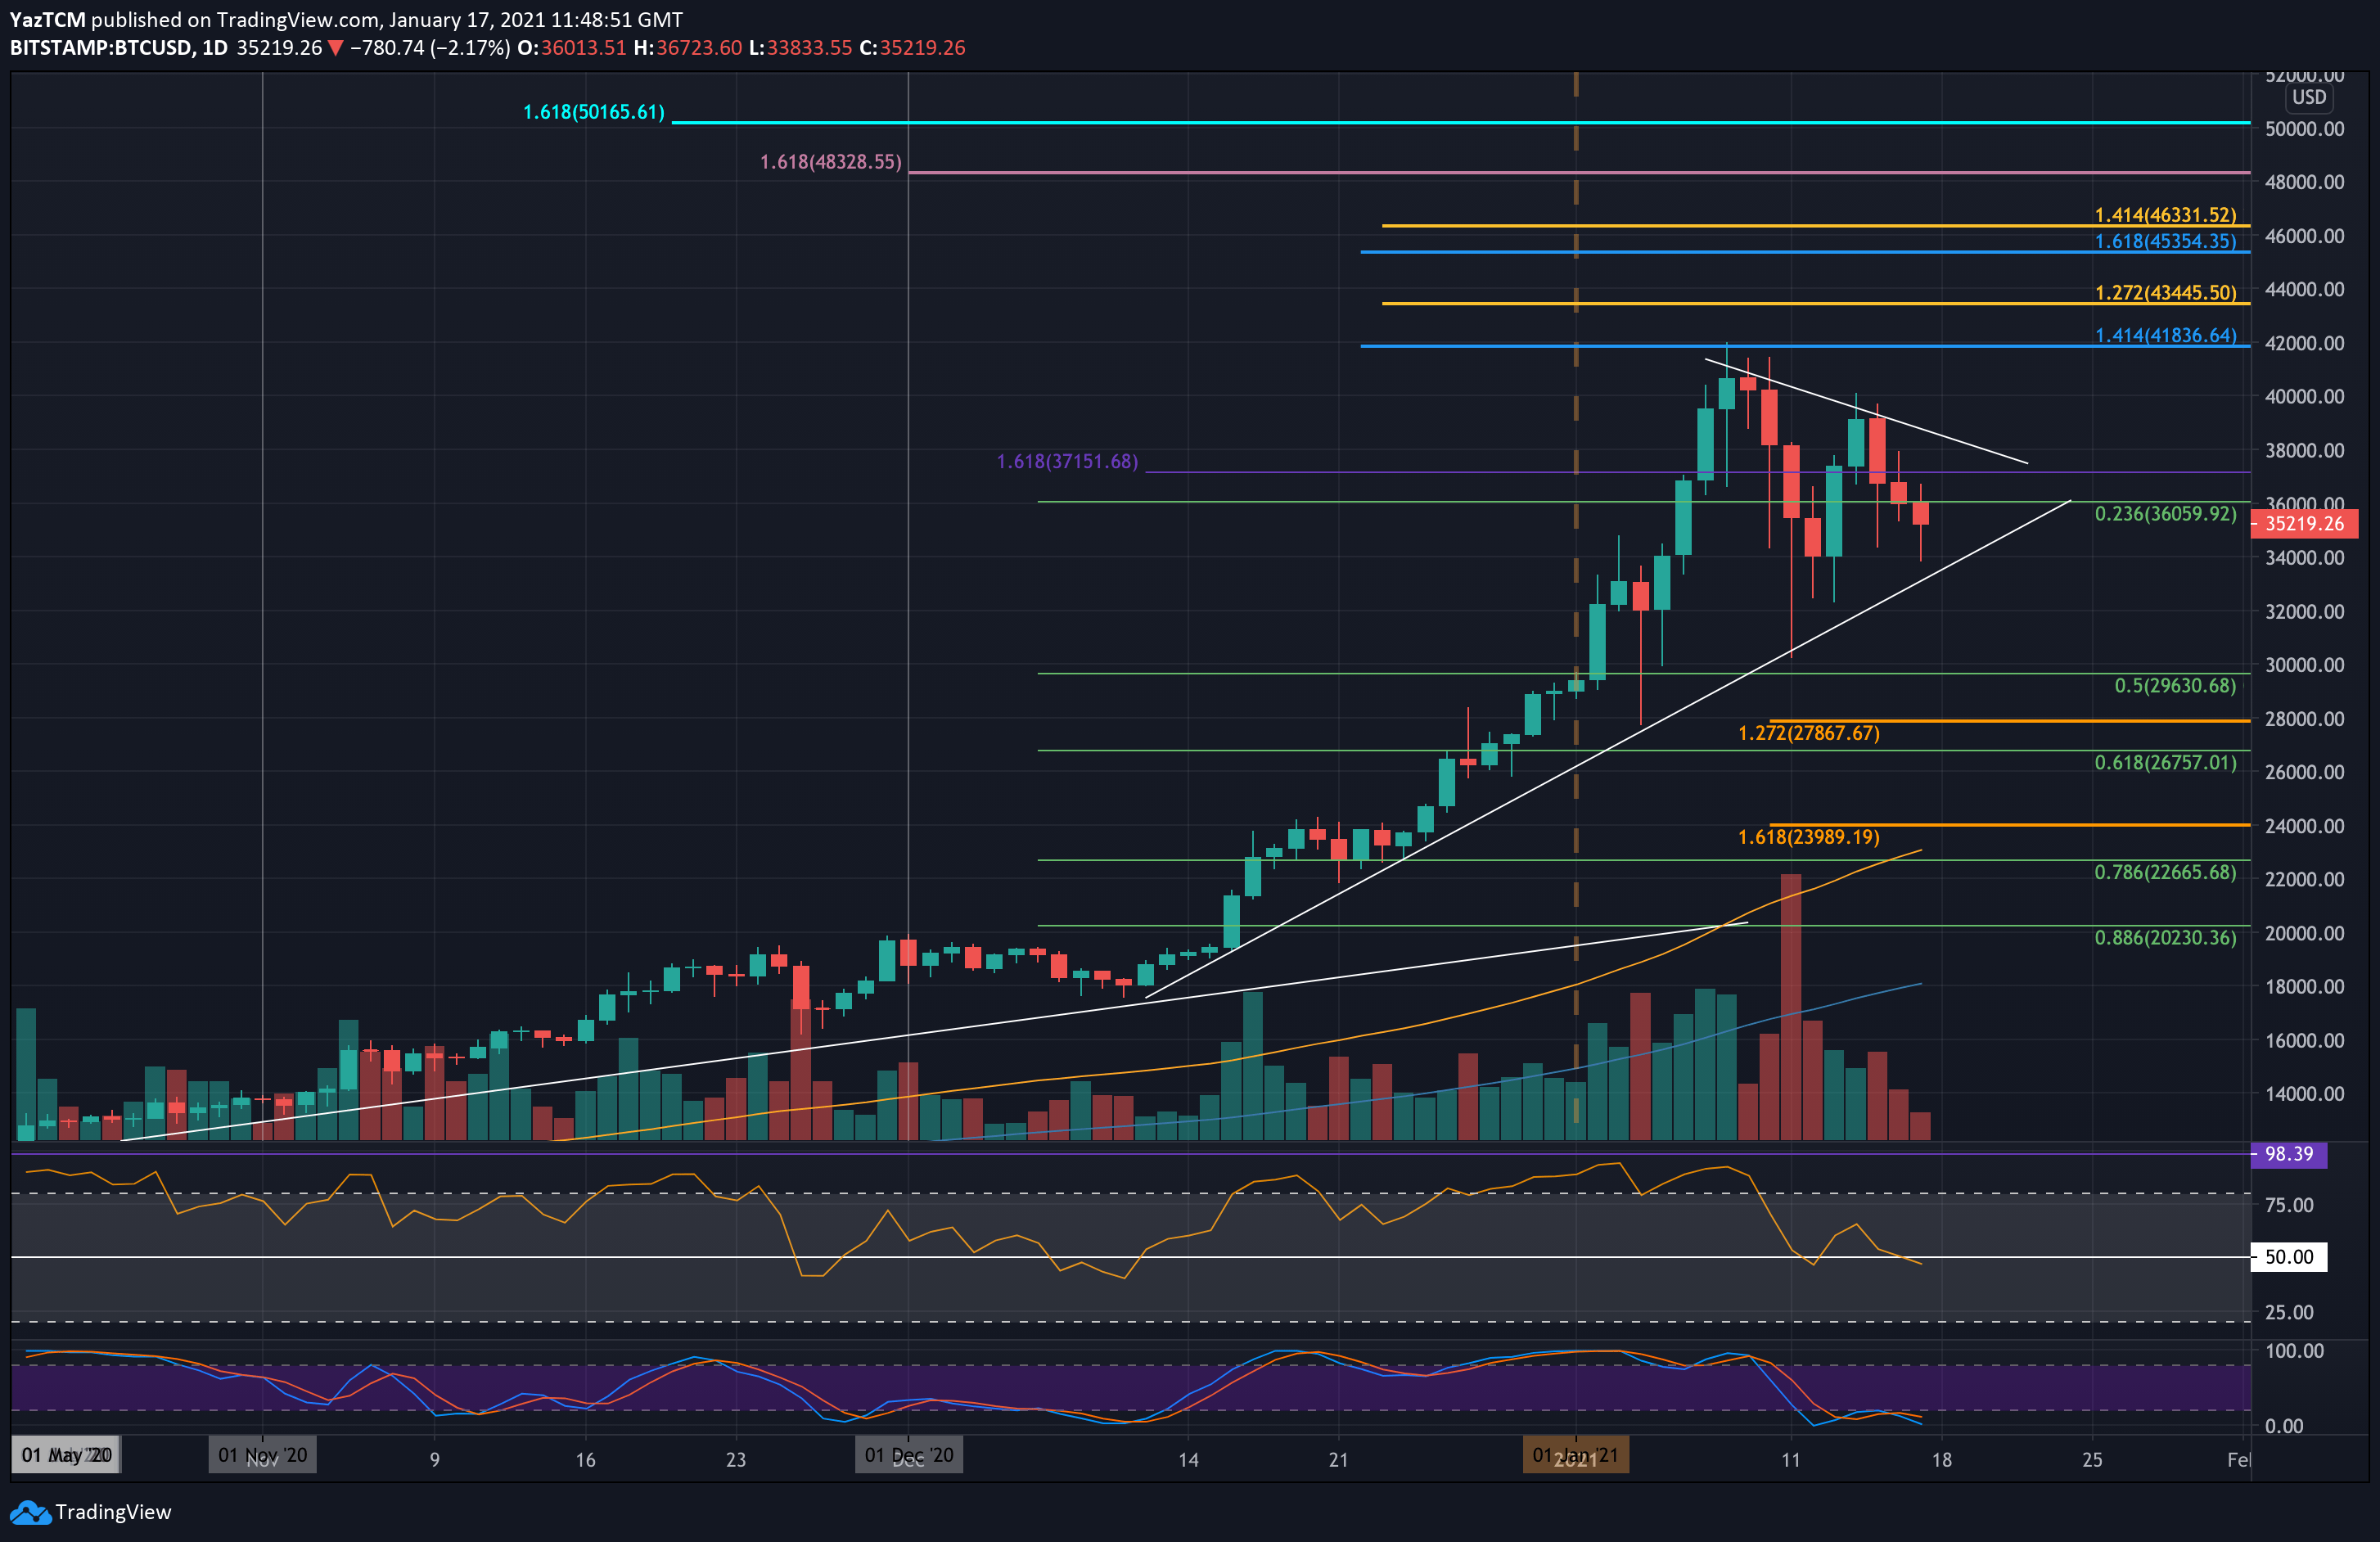
BTC/USD Daily Chart. Source: TradingView
Another volatile weekend: the Bitcoin price is down by 7% over the past 24 hours after losing critical support at $36,000. Only three days ago, the cryptocurrency pushed over $40K but failed to close above the benchmark level.
After failing at $40K, BTC started losing altitude on Friday as it broke beneath a short term rising price channel. It then dropped into support at $34,800 (short term .5 Fib Retracement) and rebounded sharply, but couldn’t overcome resistance at $38K ($37,940, bearish .618 Fib Retracement) as of yesterday.
Looking at the following 4-hour, after it provided support on two different occasions, the MA-50 line got broken down and, moreover, tested earlier today, this time to confirm the line as support-turned-resistance (around $36K).
As of writing these lines, Bitcoin found support upon the same ascending trend-line that stopped the bloodbath that took place on Monday. This time the daily bottom was $33,800, according to BItstamp.
Keeping in mind that it’s Sunday today, the CME Futures Friday’s closing price was $35,625. At the time of this writing, we do not expect any major price gap as we had during the past weekends.
Key Support Levels: $34,800, $34,000, $33,400 – $33,130, $30,750, $30,000.
Key Resistance Levels: $36,000, $36,700, $38,000, $39,700, $40,000.
Looking from the bearish side, if the sellers break down the support at $34,800 (short term .5 Fib), the next level of support lies at $34,000. This is followed by the ascending trend line currently around $33,400 (the same line that Bitcoin found last Monday’s bottom), $33,130 (short term .618 Fib), and $30,750 (short term .786 Fib) – and also the weekly low recorded on Monday.
On the other side, the first level of resistance lies at $36,000. This is followed by $36,700 (bearish .5 Fib & 4-hour 50-MA line), $38,000 (bearish .618 Fib), and $39,700 (bearish .786 Fib).
The daily RSI set a lower high and is in the process of creating a lower low, which might indicate a short-term bearish trend. Additionally, it is struggling to stay on top of the mid-line and not to enter the bearish territory.