Source: TradingView
POsitive market sentiment abounds in the past couple of days. This has enabled BTC to return to the major resistance at $45,000 for the third time and the question remains: will it finally break above it?
By: Edris
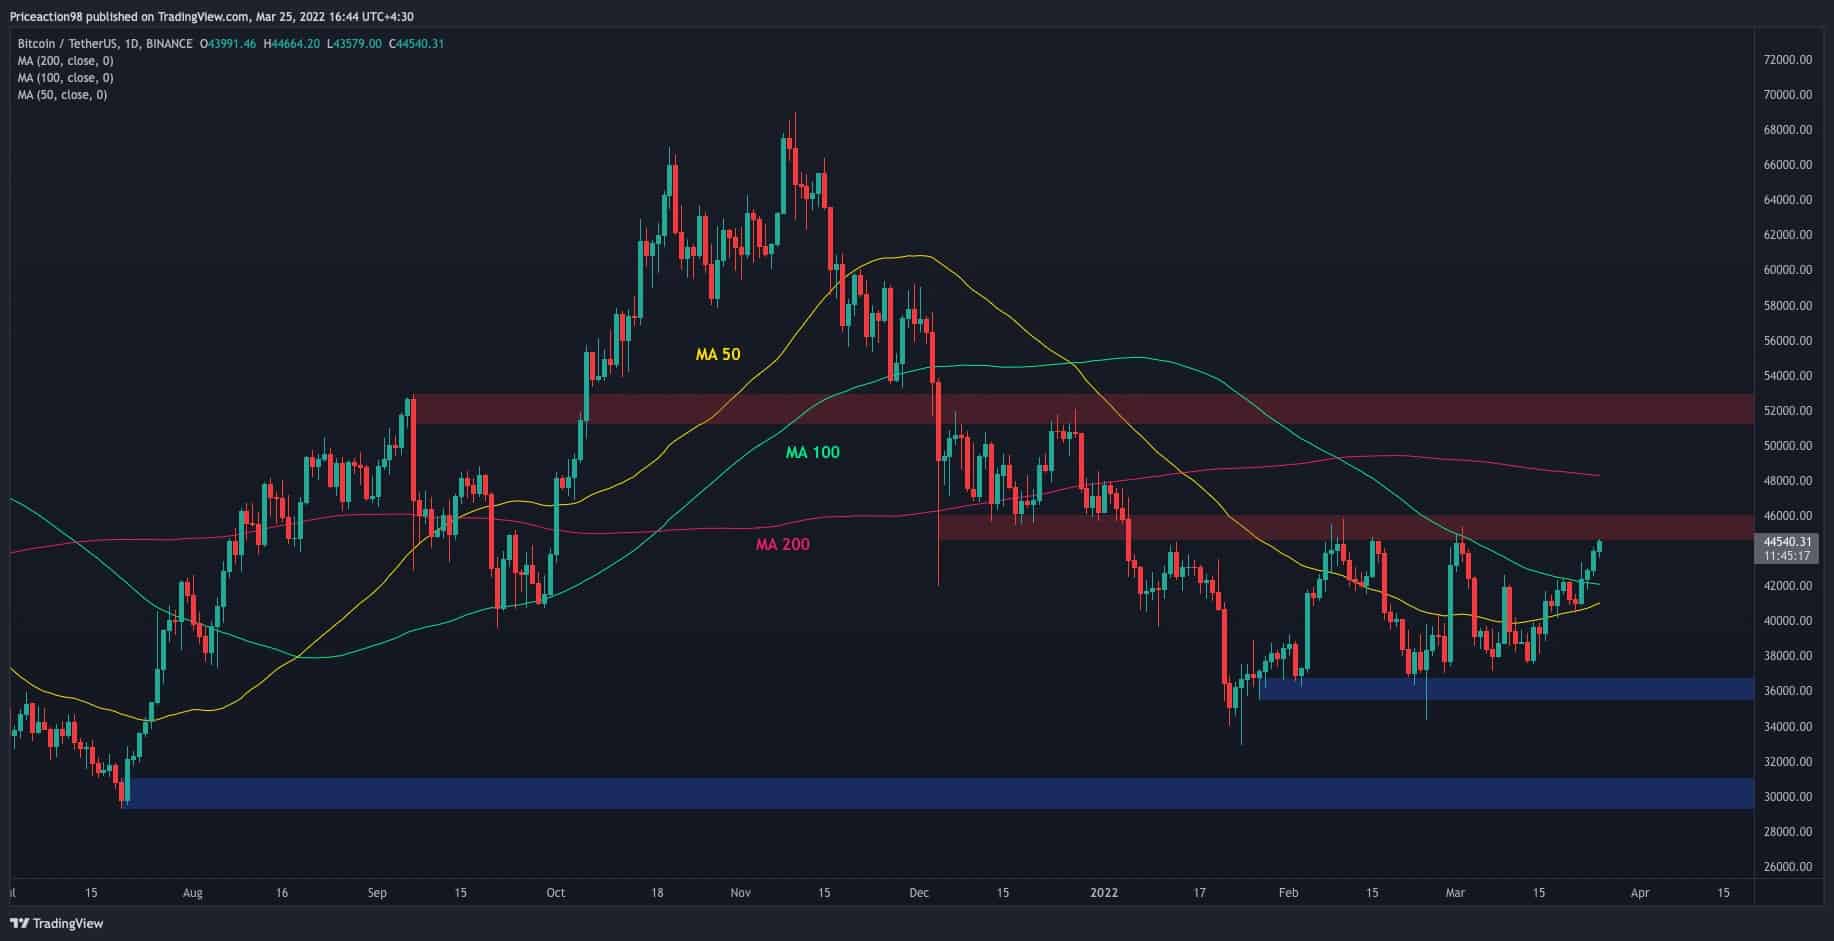
Daily timeframe:
Bitcoin has reached the major $45K resistance zone once again following a bullish rally in the past few days. The price first broke above the 50-day moving average, and after a successful retest, it has now broken the 100-day moving average to the upside.
Currently, the $45K resistance level is the major obstacle, and if the price is able to break above it, the next major resistance would be the 200-day moving average. On the other hand, if BTC gets rejected to the downside, the 50-day and 100-day moving averages could act as support and stop a potential correction.
Furthermore, it seems like the 50-day moving average is going to cross the 100-day MA to the upside in the next few days, which could be a bullish signal.
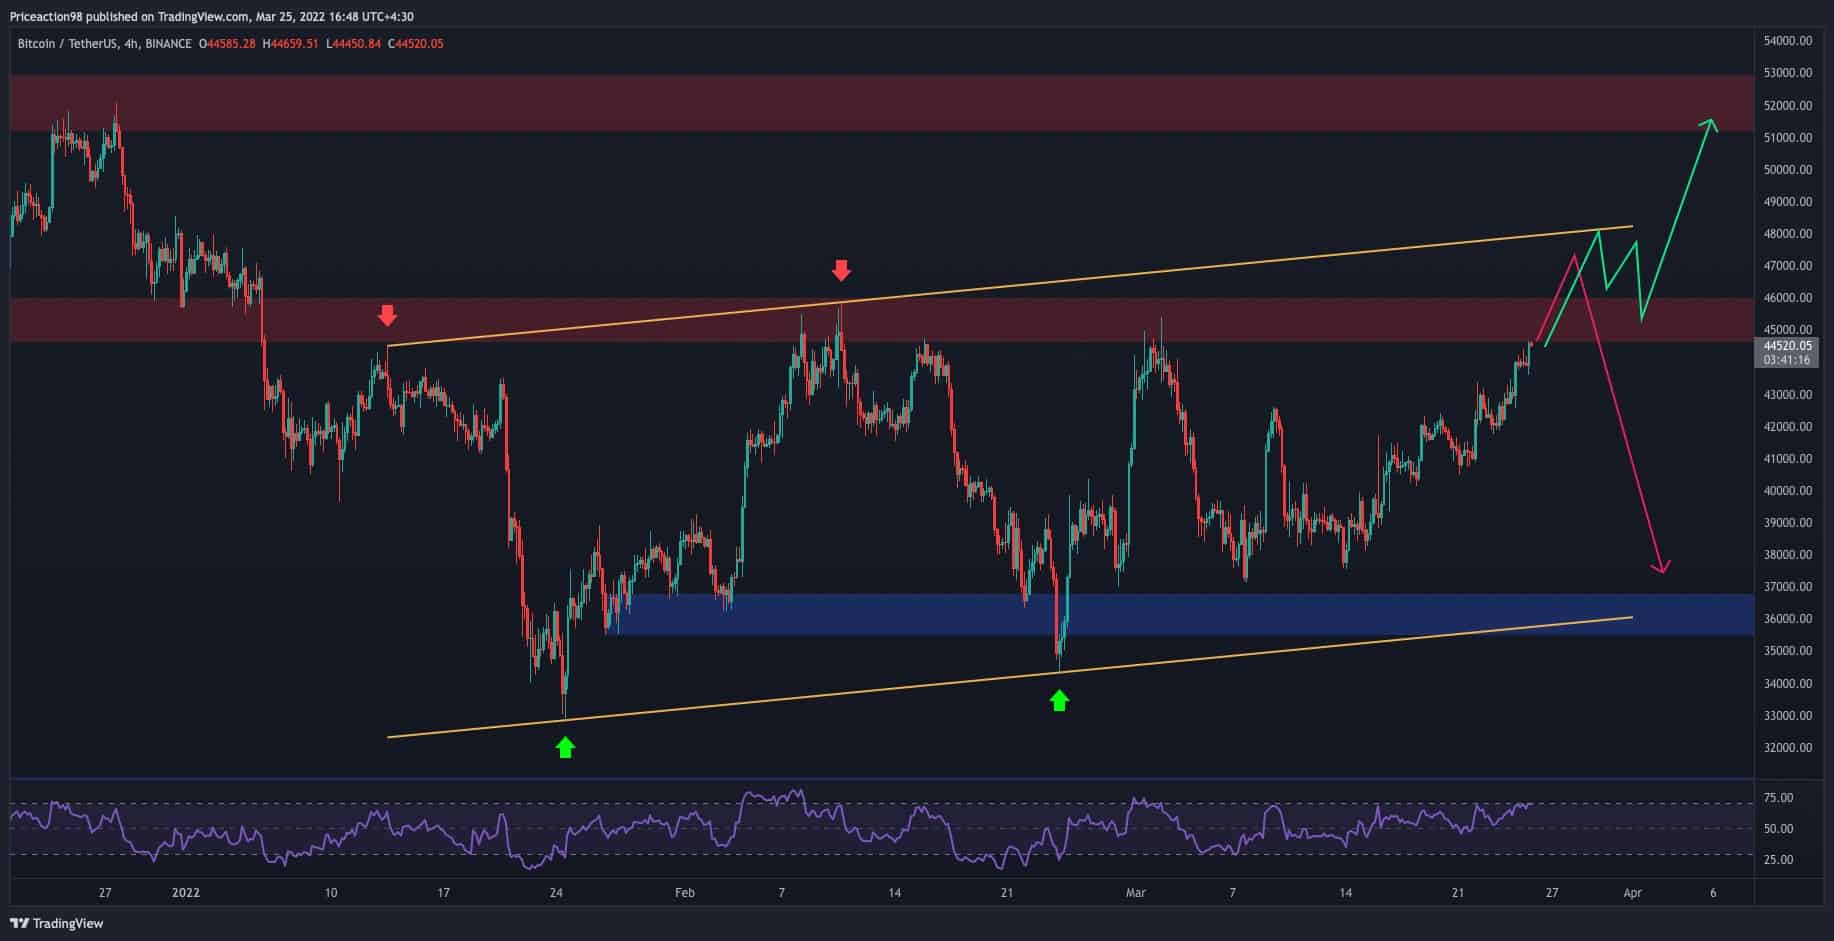
4-hour timeframe:
On the 4-hour time frame, it is evident that the price is still in a large bearish flag pattern and is currently approaching its higher boundary. If the bulls get exhausted, the BTC would be hammered down again after a potential third touch.
This would trigger a bearish continuation scenario towards the $30K demand zone. On the contrary, if the bulls are able to push the price above the flag and a valid bullish breakout occurs, the bearish pattern would be considered invalidated, and the price could target the $52K resistance zone and even beyond. The RSI indicator is also signaling that BTC is entering the overbought area (above 70), and a correction or consolidation may be expected in the short term.
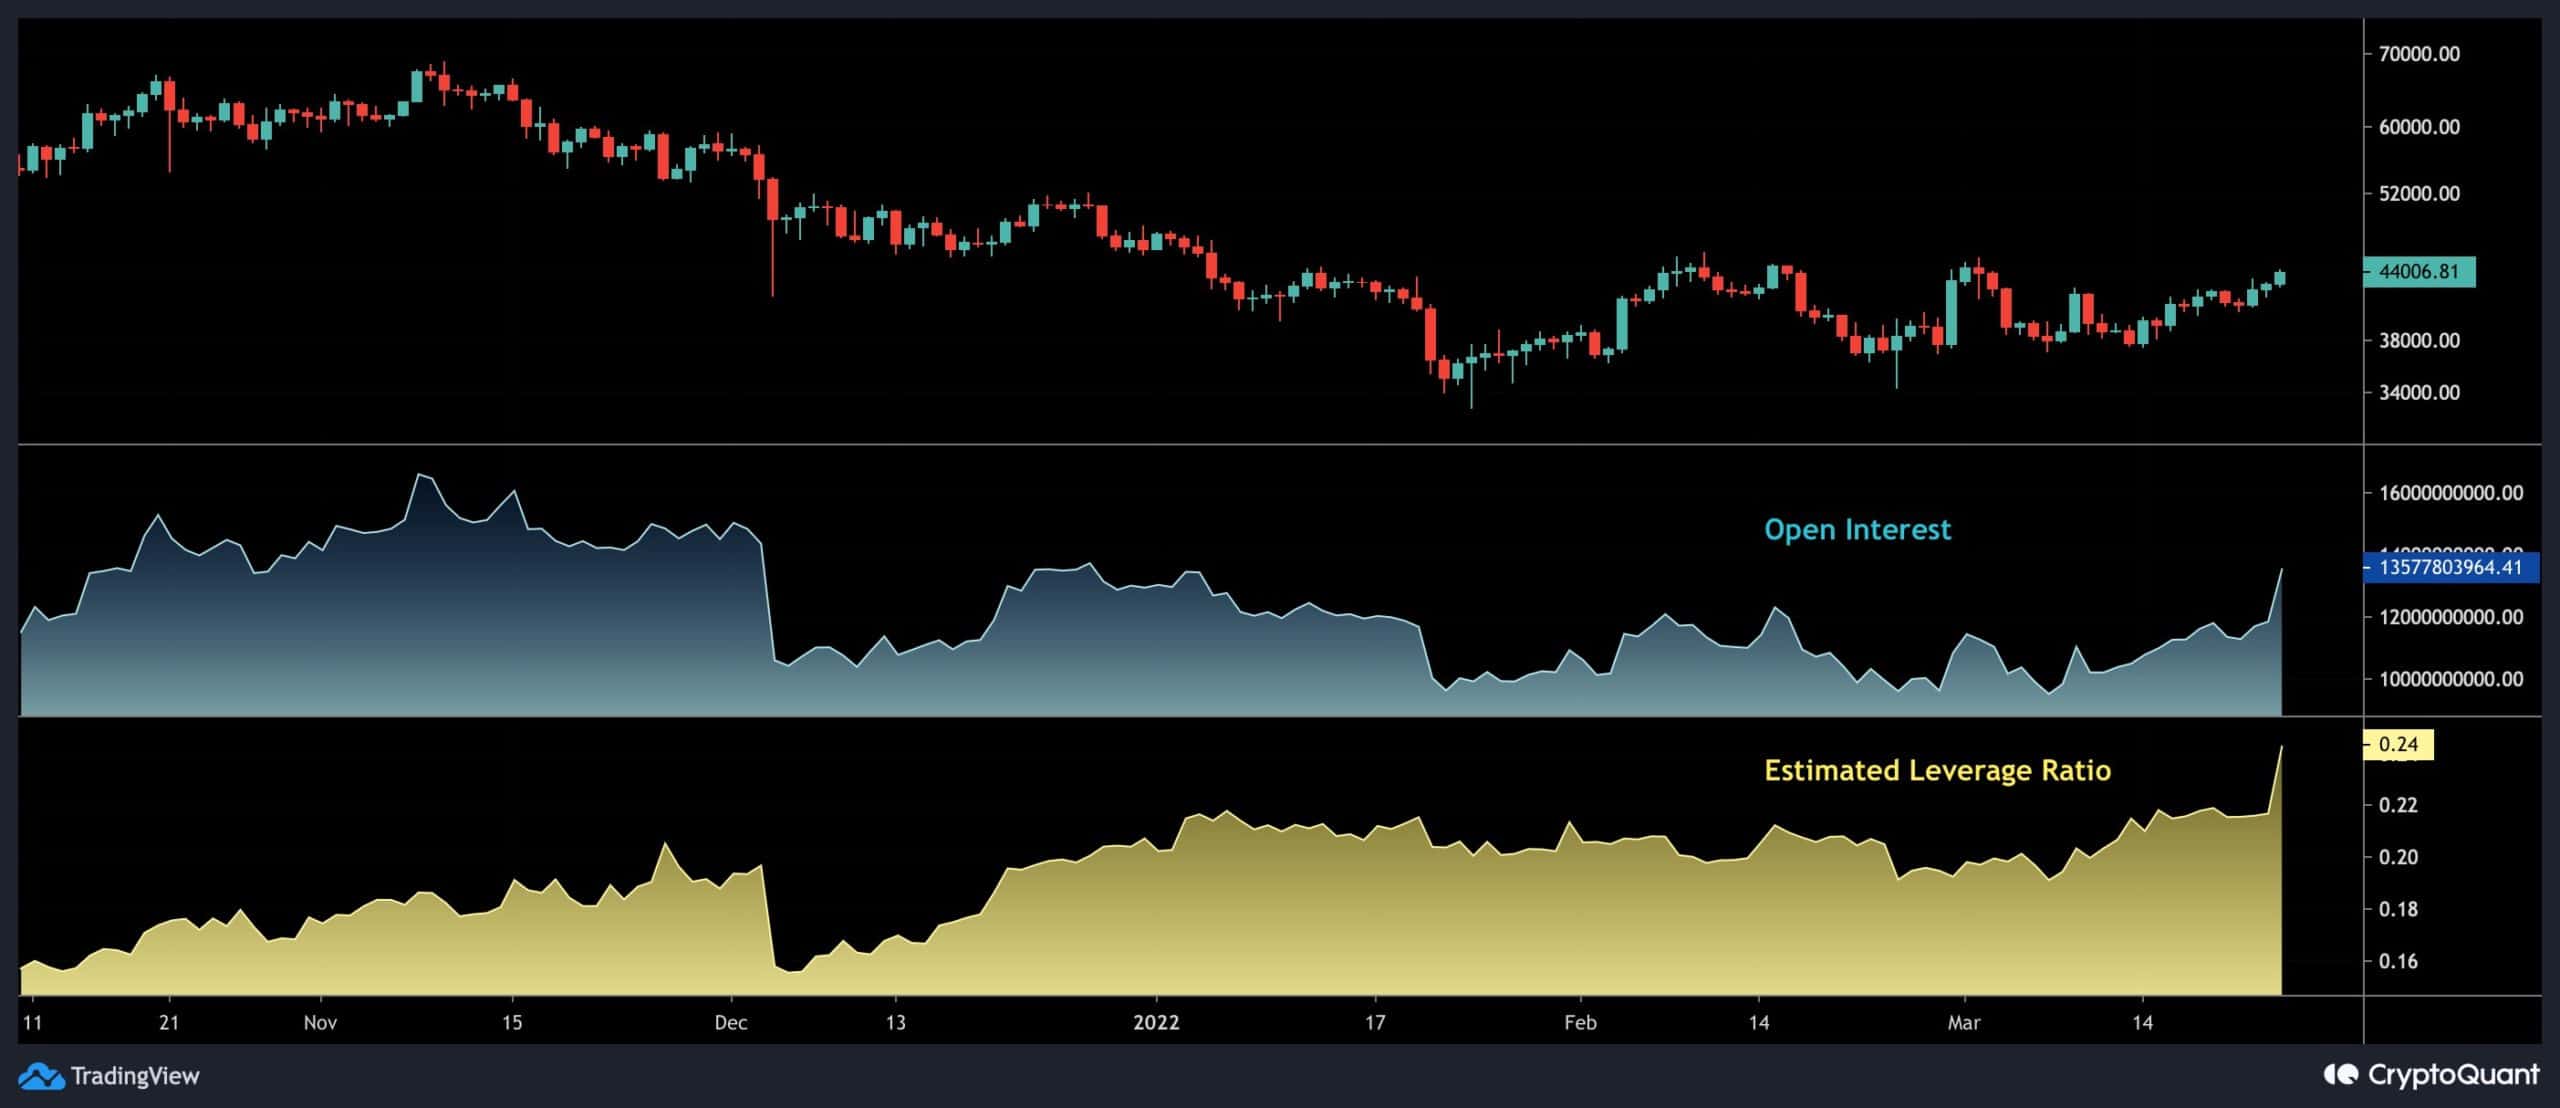
After Bitcoin surged and hit its previous high at $44K, it was rejected and began another bearish move, causing the Open Interest to drop.
Yesterday, BTC went through significant price volatility, resulting in a large Long/Short liquidation. These are necessary for the market to temper down the level of leverage being employed in futures trading. After yesterday’s volatility, the Estimated Leverage Ratio and Open Interest have fallen, as seen in the chart.
Open Interest is already around multi-month lows, raising the chances of Bitcoin restarting its positive trend. However, the market’s Estimated Leverage Ratio remains high, indicating that it needs to be deleveraged in order to proceed in a healthy direction.