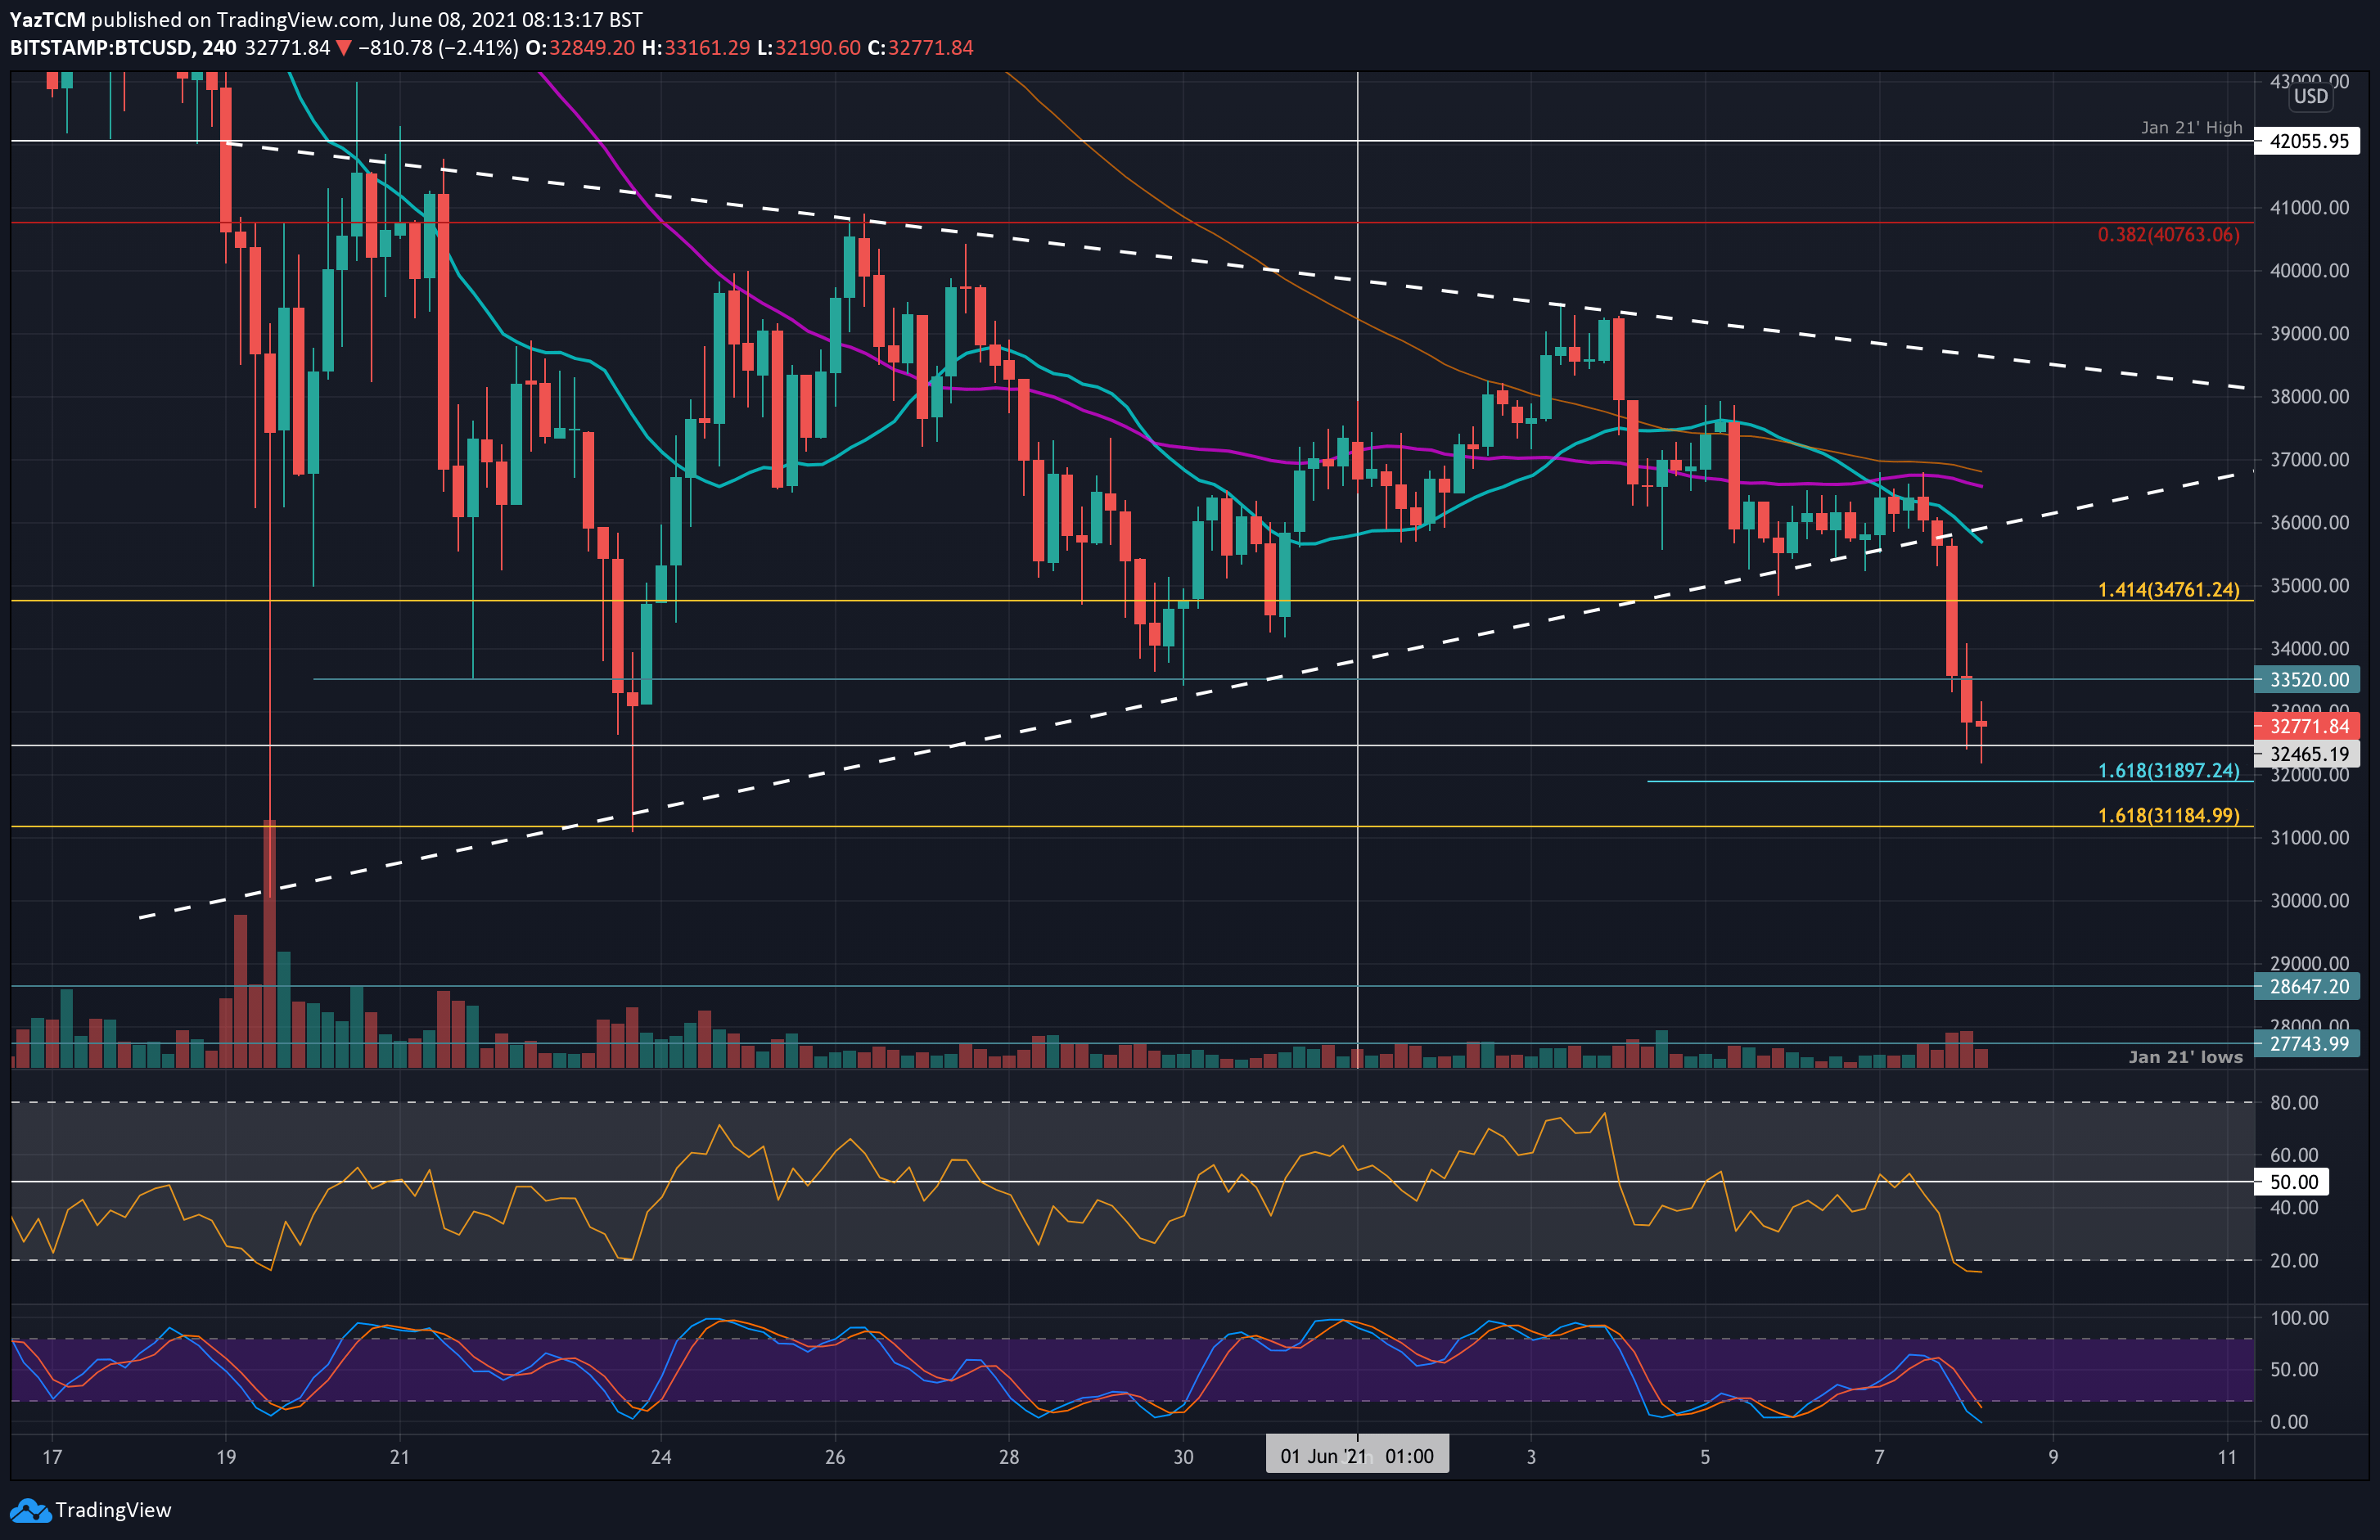
BTC/USD 4-Hour Chart. Source: TradingView.
Bitcoin fell by a sharp 10% today as it lost over $5000 over the past 48 hours. The primary cryptocurrency was trading inside a symmetrical triangle pattern since the market capitulation took place in mid-May when BTC fell by 50% from a high of $59,600 to a low of $30,000 in just nine days.
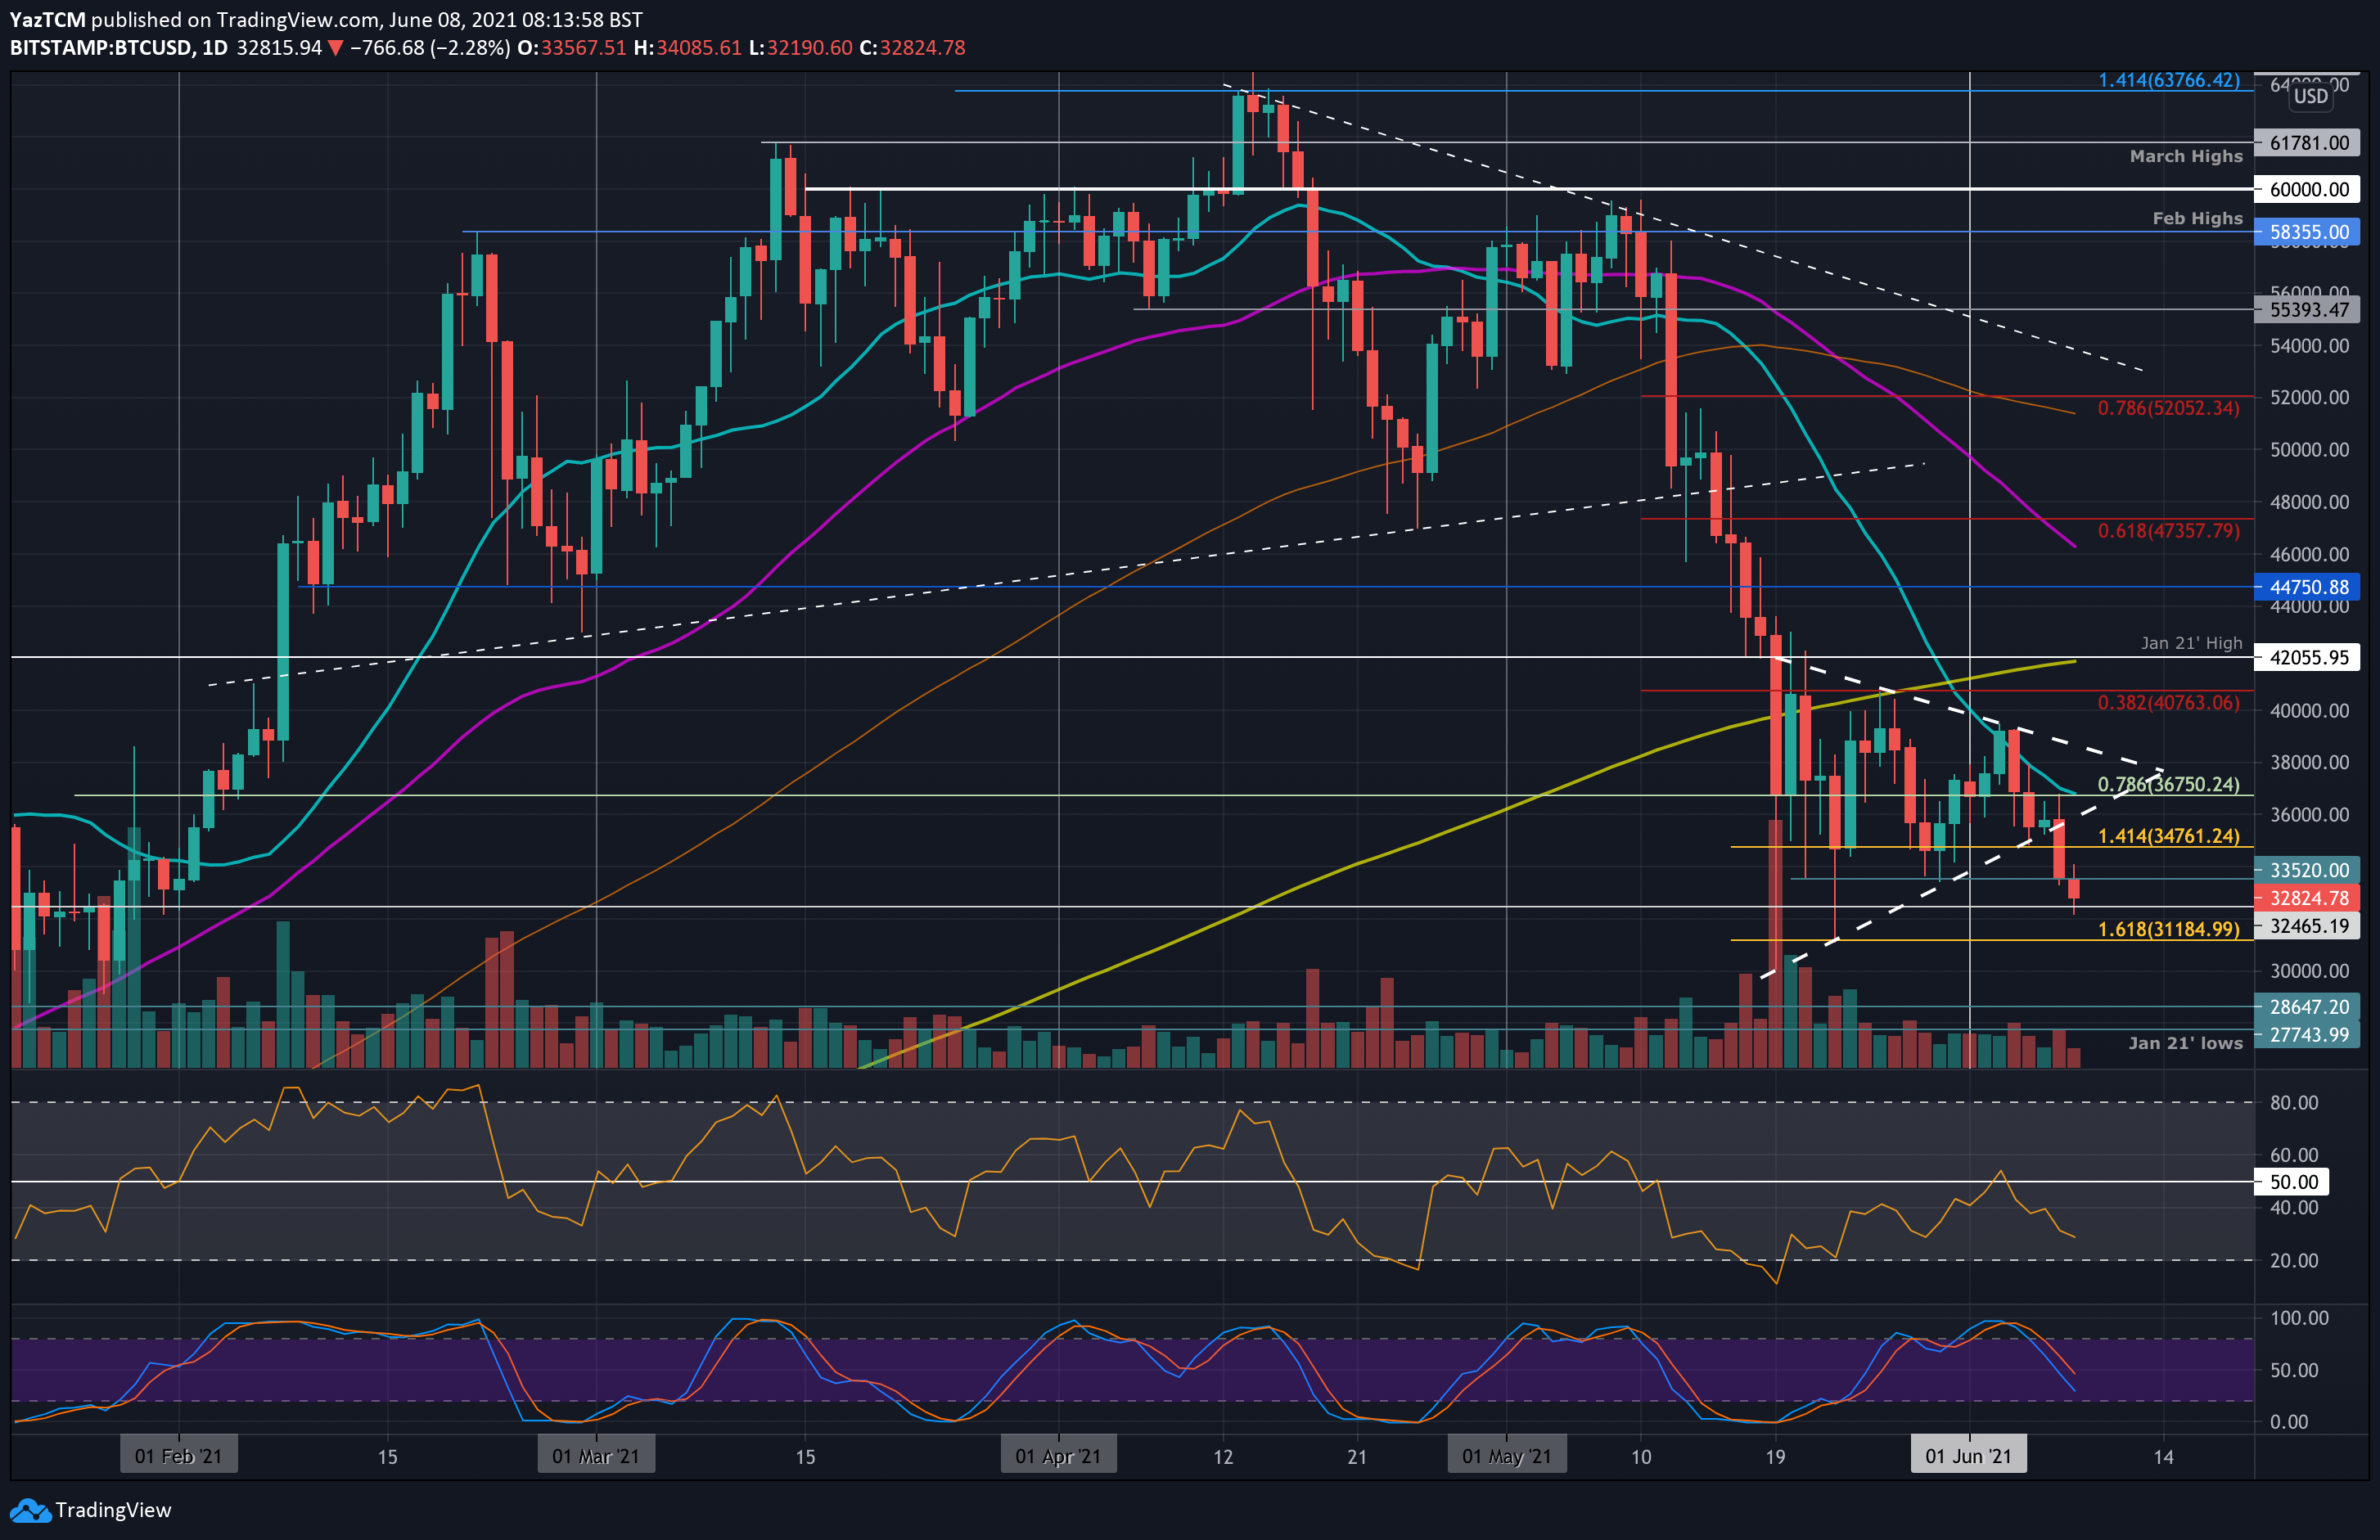
Since then, BTC traded inside the consolidation phase for a total of eighteen days until it broke the lower boundary of the triangle yesterday. This can be clearly seen on the following daily chart. BTC then closed yesterday’s candle at $33,520 (bearish close below the triangle’s boundary around $35k) and continued lower today to reach $32,190 (as of now).
The decline also caused BTC to spike beneath crucial support is at $32.5K (as of writing these lines BTC rebounded). This level provided both strong support and resistance during January. A daily close beneath it is likely to drive BTC lower into the $30,000 region next.
One critical indicator to note is the 4-hour RSI which is currently at extremely oversold levels that have not been seen since before the market capitulation in May. This could suggest a possible temporary correction or relief following the recent bloodbath. However, the market is not showing any signs of reversal so far, so we can expect the bearish action to continue.
The key level is $30K, which is also May’s lowest recorded on May 19.
Key Support Levels: $32.5K, $31,900, $31,185, $30,000, $28,650.
Key Resistance Levels: $33,520, $34,000, $34,760, $36,000, $36,750.
Looking ahead, the first support lies at the mentioned $32.5K support. This is followed by $31,900 (short term downside 1.618 Fib Extension), $31,185 (downside 1.618 Fib Extension & late May support), $30,000, and $28,650.
On the other side, the first resistance now lies at $33,520. This is followed by $34,000, $34,760, $36,000, $36,750 (20-day MA), and $38,000.
As mentioned, the 4-hour RSI is extremely oversold. However, the daily RSI is not near oversold conditions, indicating that the sellers still have room to push BTC lower toward $30,000 before becoming exhausted.