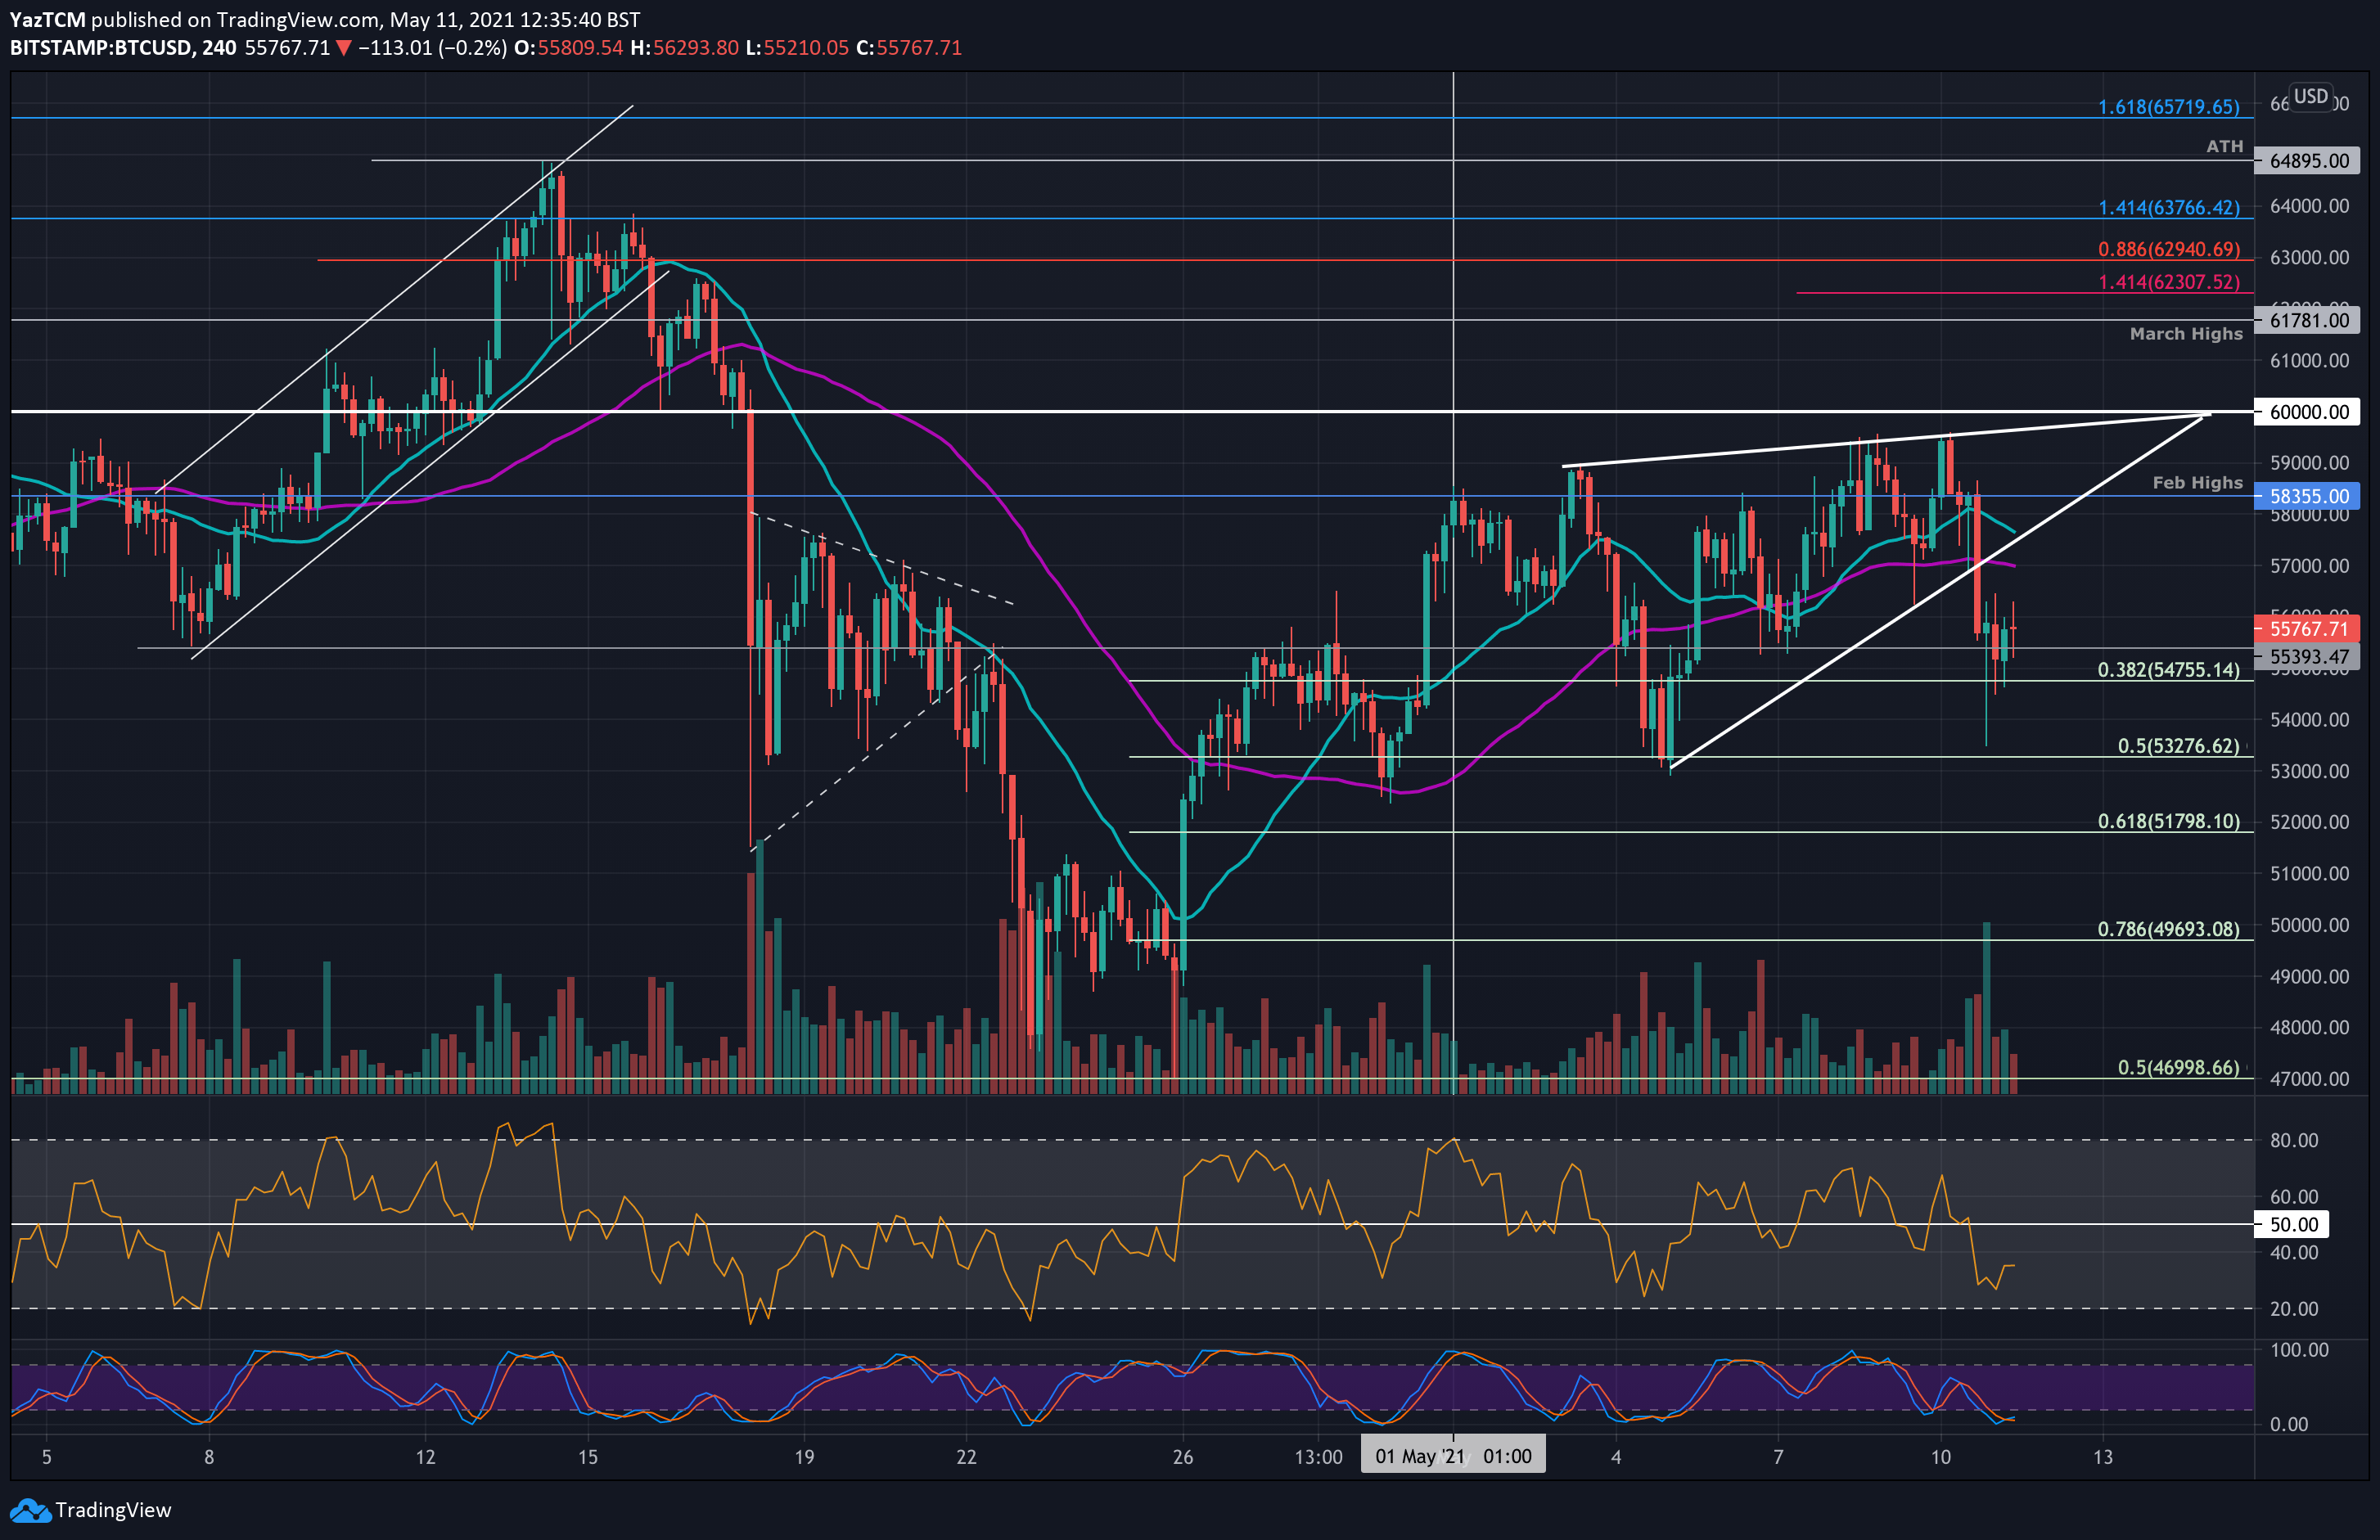
BTC/USD 4-Hour Chart. Source: TradingView
Bitcoin is down almost 5% today as the primary cryptocurrency broke below a rising wedge formation. BTC reached as high as $59,600 yesterday, touching the upper boundary of the wedge. However, the steep dive started from there.
As mentioned yesterday, bitcoin was trading inside a rising wedge pattern, which in most cases tends to break to the downside. This is what happened this time as well.
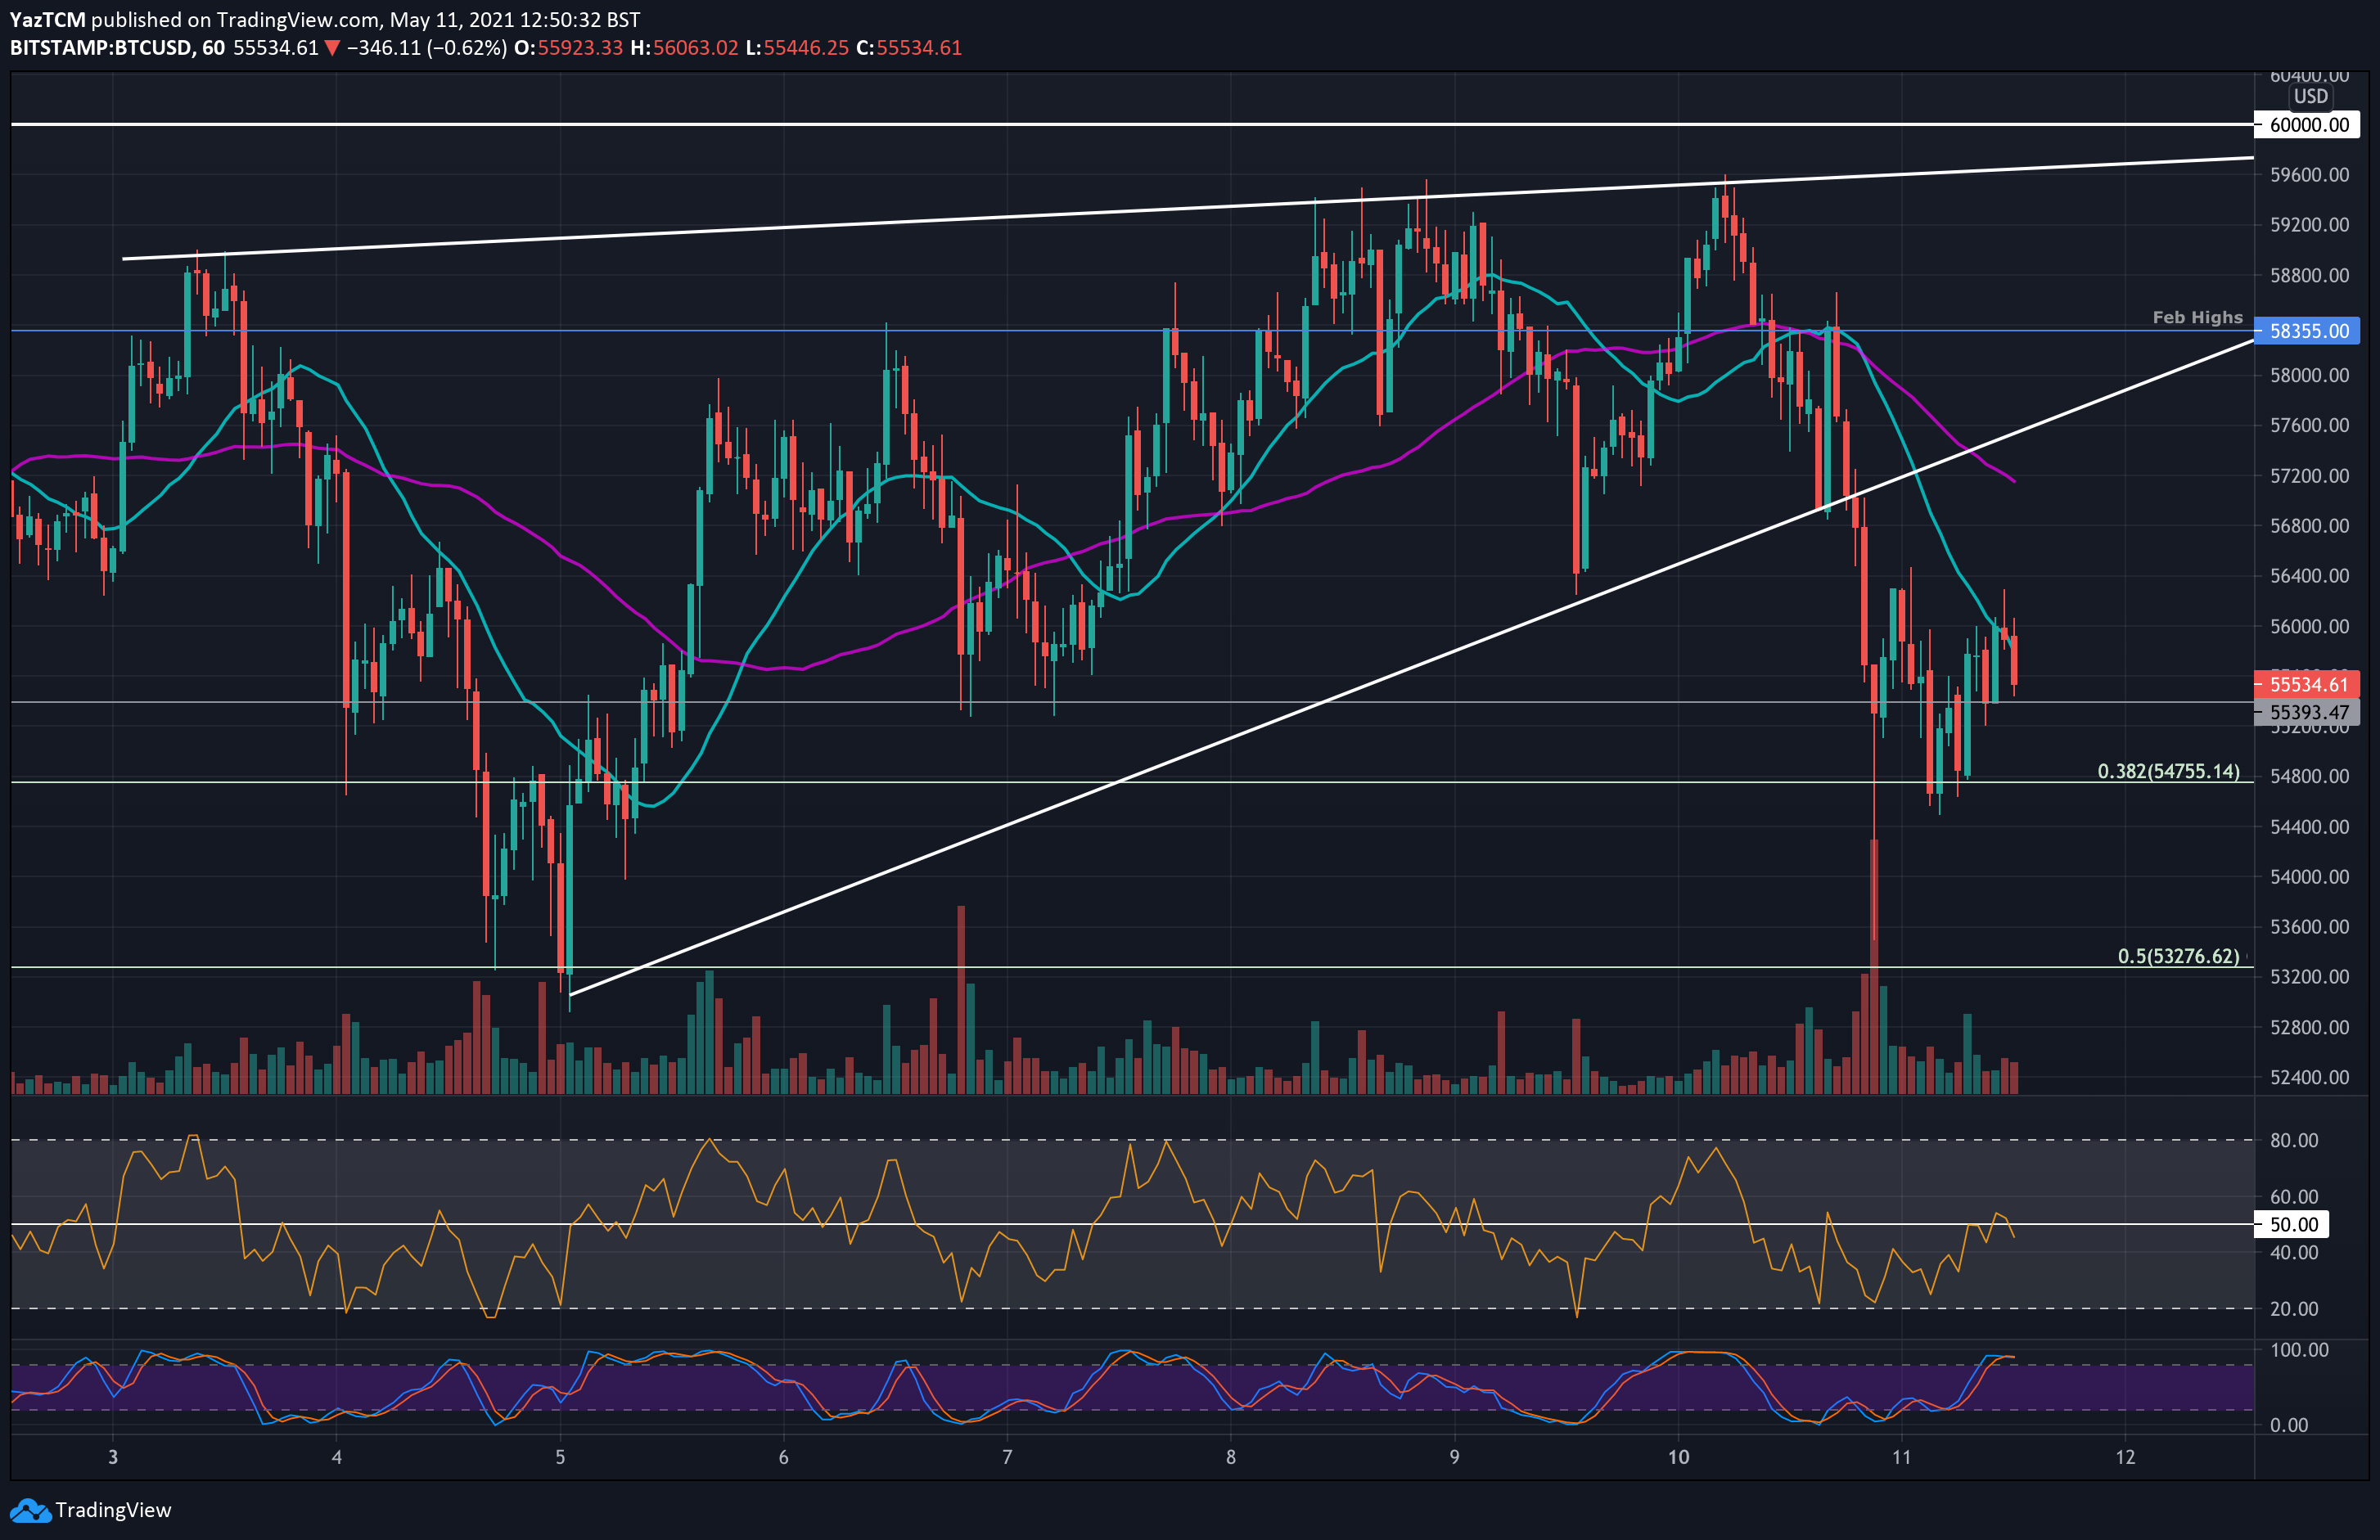
After breaking toward the bearish side, BTC continued to plummet but managed to find solid support around the $54,755 (.382 Fib) level – best seen on the following 1-hour chart.
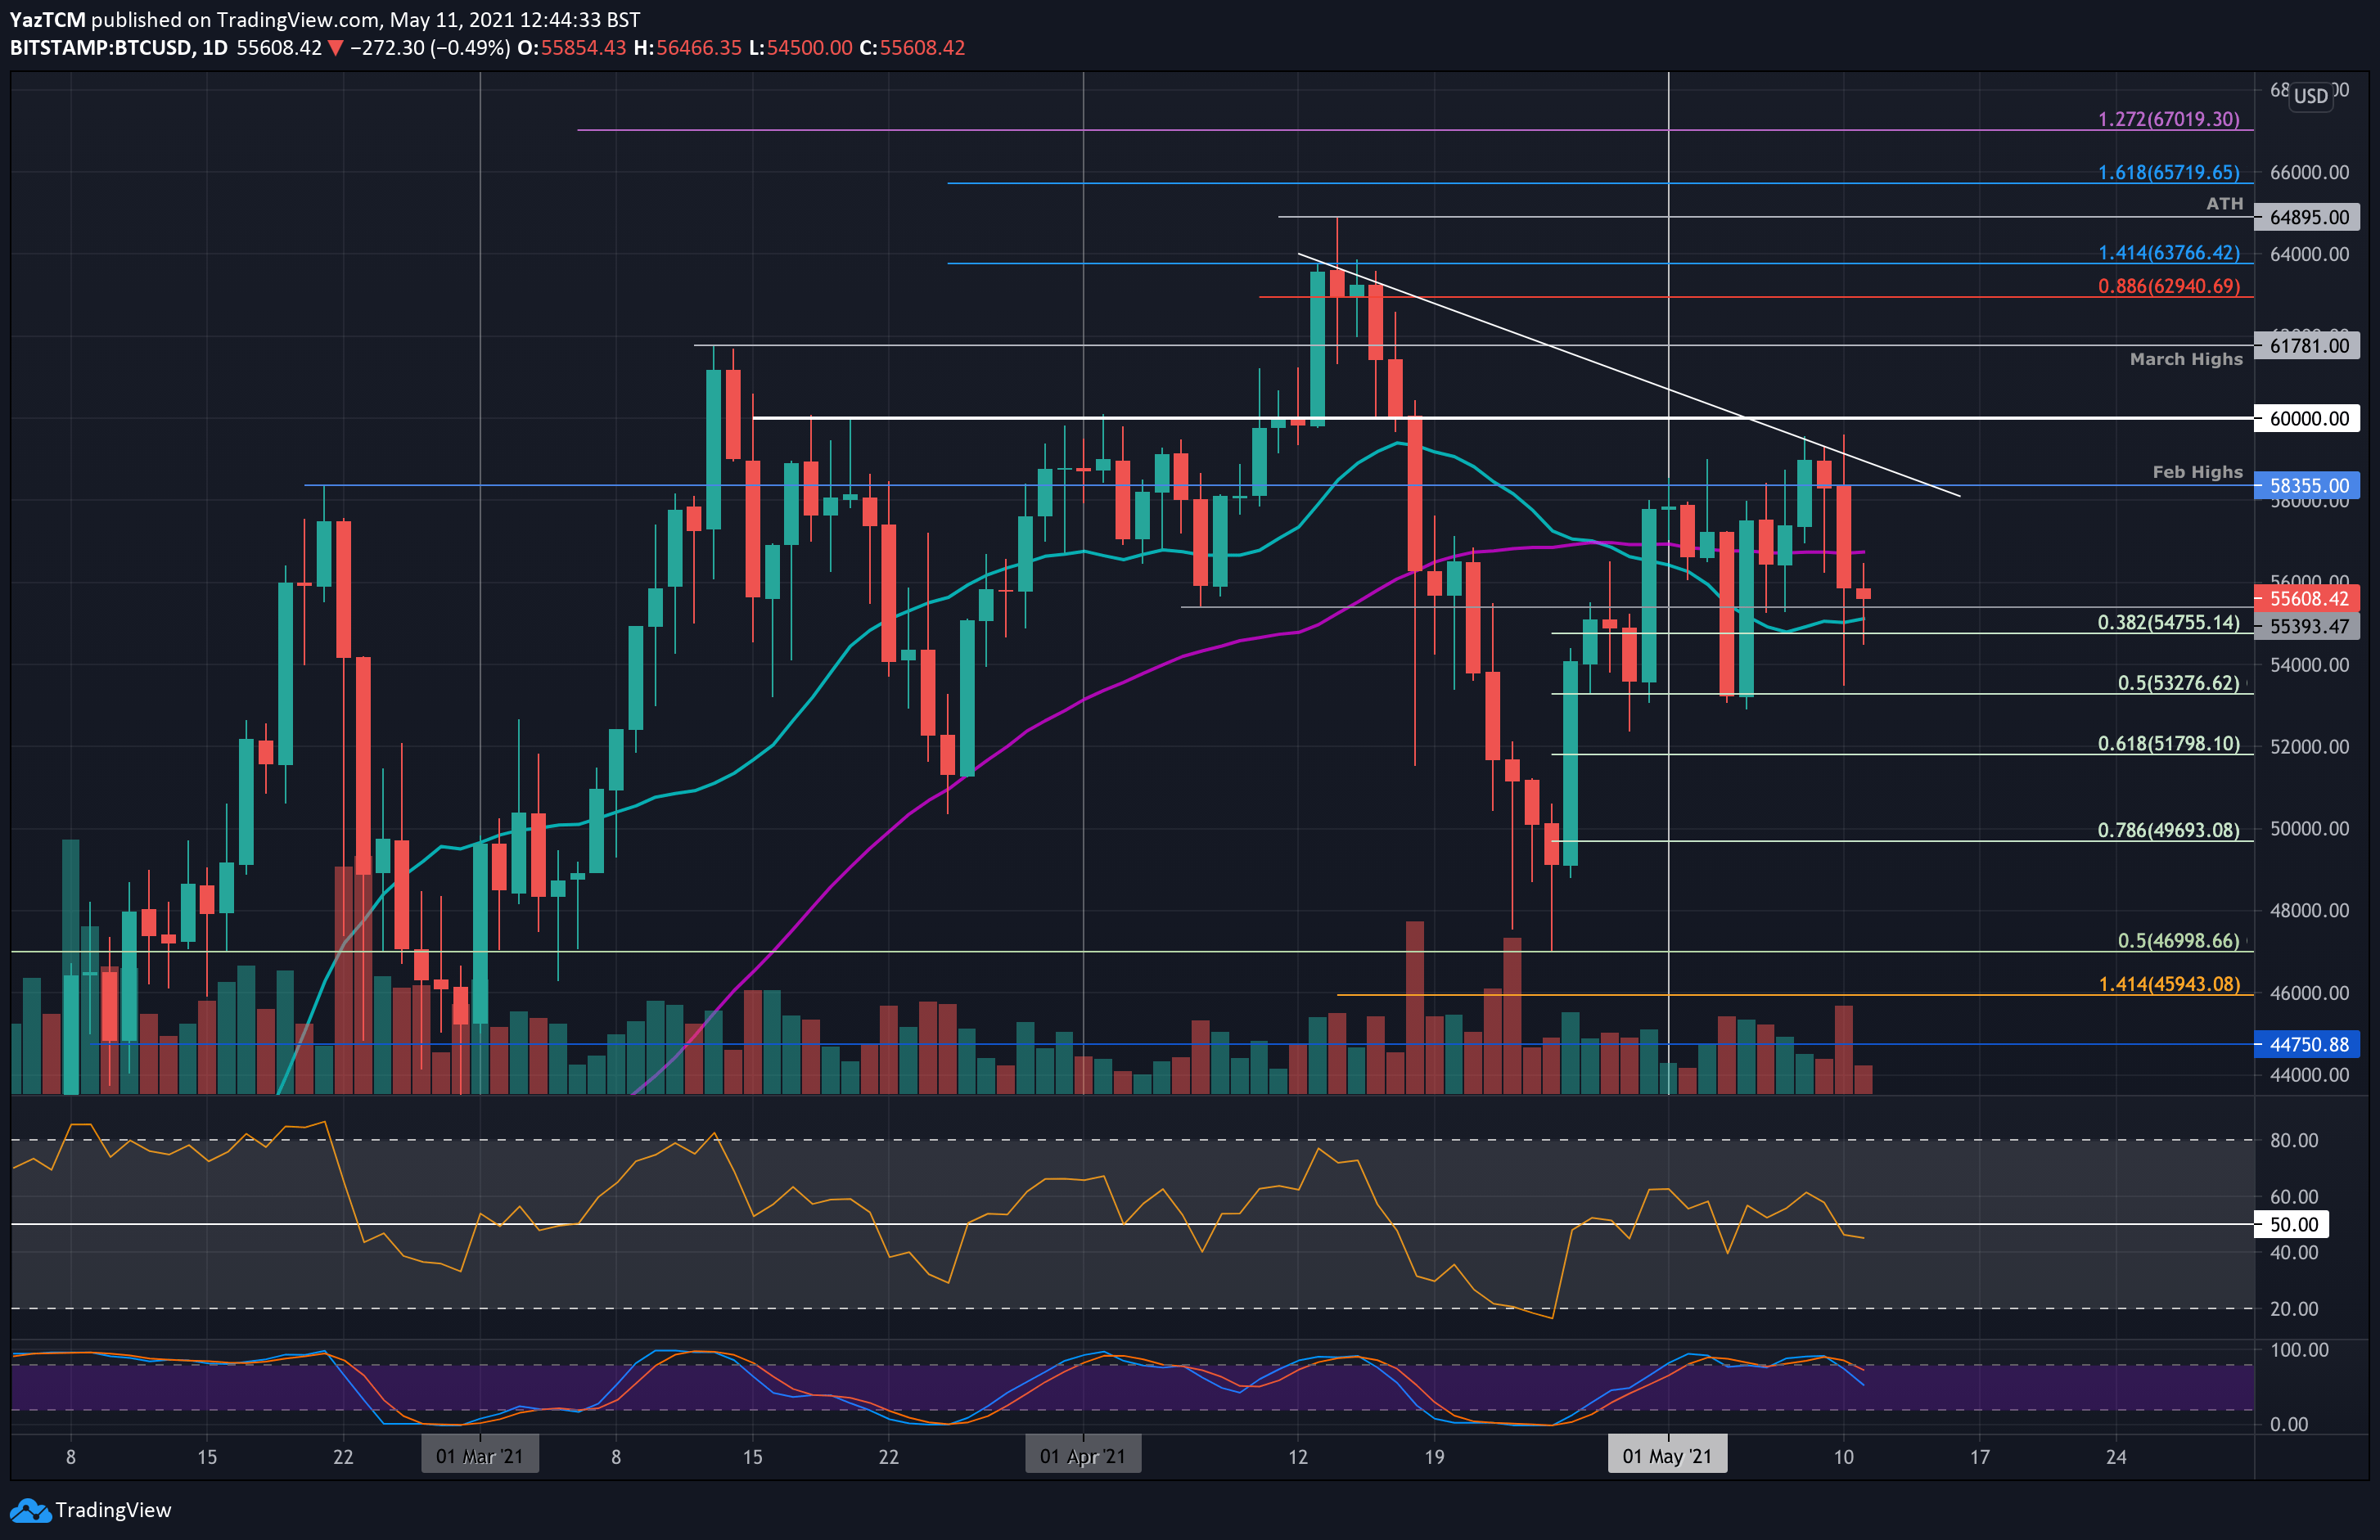
Looking at the longer-term chart, BTC still looks healthy, but it also appears to be struggling to stay above the 20-day moving average line. The last time bitcoin saw a full-body candle below the MA-20 line was mid-April, and it lost over 20% following the breakdown (reaching April lows at around $46k – $47k).
Once the rising wedge was broken, and together with the global markets’ 2-day bearishness, we might see bitcoin retesting lower support zones before the continuation of the uptrend.
Key Support Levels: $55,120, $54,755, $54,000, $52,375, $51,800.
Key Resistance Levels: $56,000, $56,750, $58,355, $60,000.
Looking ahead, if the bears push beneath $55,120 (20-day MA), the first support lies at $54,755 (.382 Fib). This is followed by $54,000, $52,375 (.5 Fib & April support), $51,800 (.618 Fib), and $50,000.
On the other side, the first resistance is expected at $56,000. This is followed by $56,750 (the significant level of the 50-day MA), $58,355 (Feb 2021 highs), the falling trend line, and $60,000.
The RSI has now slipped beneath the midline, indicating the bearish momentum is starting to increase. If it continues lower beneath 50, the bearish momentum is likely to drive BTC back toward $50,000.