Bitcoin as a commodity
In our recent analysis, we had concluded: “this is crypto, and anything can happen.” So not very long after, on Thursday night, the FUD around BitFinex and Tether were popping out, and Bitcoin lost $500 in under an hour in response to the negative news.
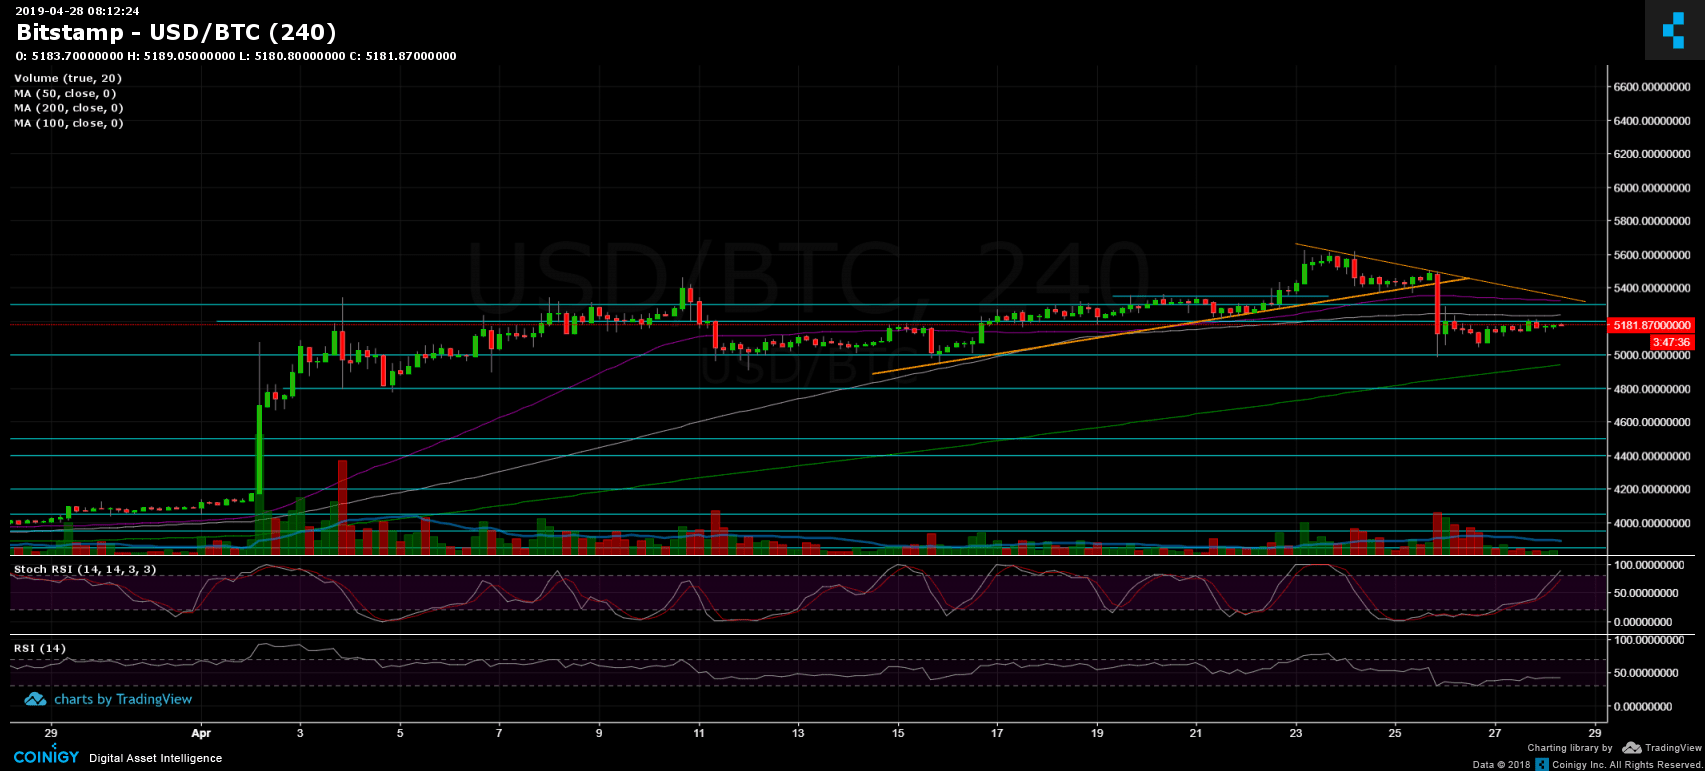
As could be seen on the charts, Bitcoin violently broke down the mid-term ascending trend-line and plummeted down to the lowest support level we had mentioned on our previous analysis, which is the significant $5000 support area.
Since then, Bitcoin is trading in the close range between the resistance of $5200 from above, and $5000 support from below.
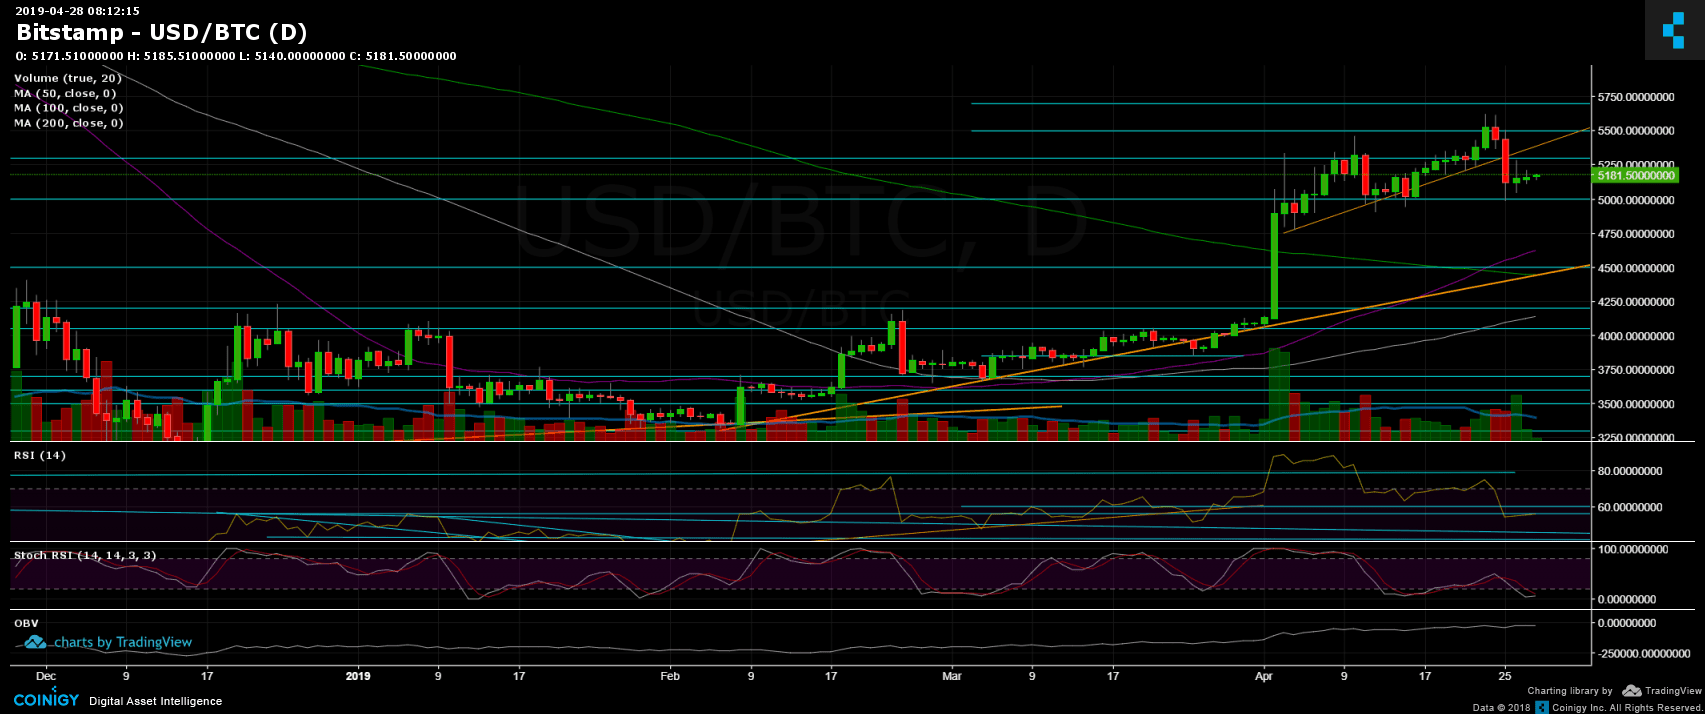
Some signs, such as the oversold RSI on the daily chart, are supporting a possible recovery. However, as in crypto, no one knows if the Bitfinex-Tether news will end up and evaporate.
Another exciting thing to watch is the Bitcoin’s market cap: Right before the sell-off, Bitcoin had failed to breach the legendary $100 Billion cap. As of now, Bitcoin’s market cap lies around $93.5 Billion.
Total Market Cap: $172 Billion
Bitcoin Market Cap: $93.5 Billion
BTC Dominance: 54.4%
– Support/Resistance:
Following the sell-off, BTC is hovering between $5000 and $5200. From below, lies strong $5K level, along with the 4-hour’s chart MA-200 line (marked in light green). Below is the $4700 – $4800 support area, before reaching the $4500 level. Further support lies at the $4200. The last is the level that got broken up when Bitcoin soared almost $1,000 on April 2nd.
From above, the next significant resistance is the $5200 mark. Higher resistance can be found in the support turned resistance $5300 – $5350 area, along with the 4-hour MA-50 and a descending trend-line on the 4-hour chart (marked in orange). Further resistance can be found then in the $5500 zone, before reaching the 2019 high around $5600.
– Trading Volume: looking on the volume candles, the recent sell-off wasn’t followed by high volume as could have been expected. This is definitely a positive sign for the bulls.
– Daily chart’s RSI: Along with the break-down, the RSI had broken down to its lowest level since March 26. As of writing this, the RSI is facing resistance at 56. Another positive sign could be coming from the Stochastic RSI as the oscillator is about to make a cross-over in the oversold area.
– BitFinex open short positions: the number of short positions continues surging – as of now the number stands on 30.2K BTC open short positions. This is the highest level since January 5, 2019.