BTC Analysis
6 years ago

Bitcoin Price Analysis April.12

Yuval Gov Apr 12, 2018 08:16

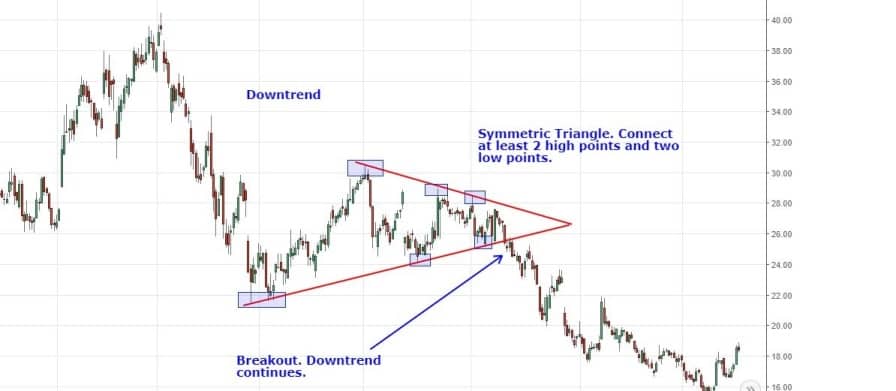
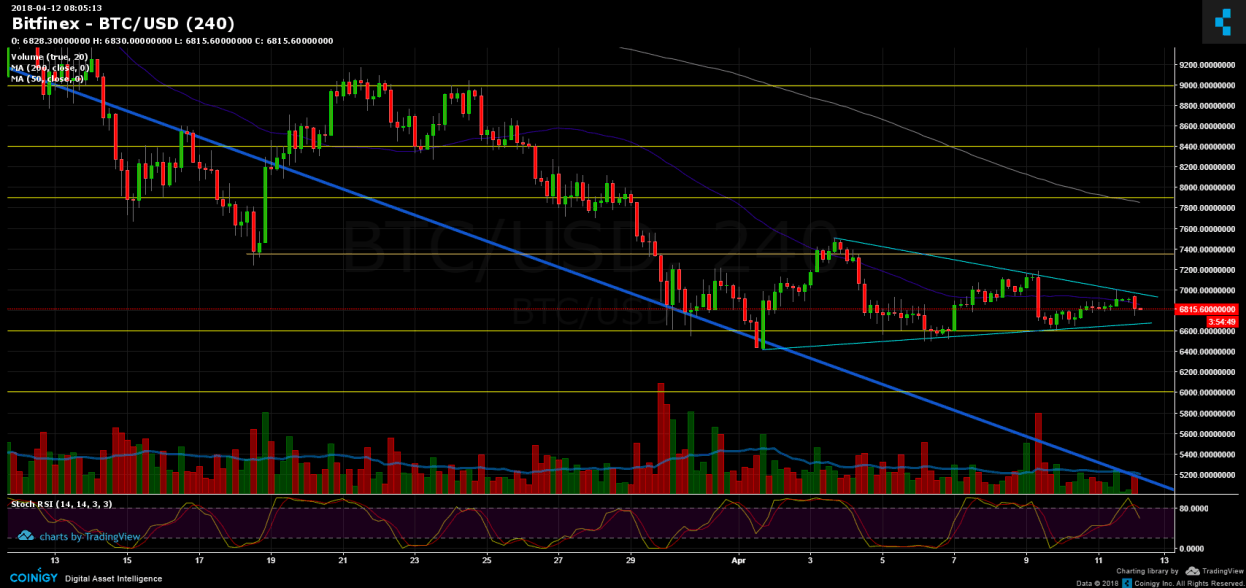
Days of consolidation usually are considered healthy during downtrend (as we have here since Jan.2018). After couple of days of consolidation between $6600 to $7000 and around the moving average 50 days line (marked in purple), the Bitcoin is forming a triangle structure as follows:

Source: http://www.investopedia.com/university/charts/charts5.asp

Usually these triangles, when they break, are not reversal to the major trend. Which in this case, the higher change we will see the triangle breaks down, instead of breaking up.

Fundamental conditions like the uncertainty and panic regarding possible attack in Syria could indeed push Bitcoin up.

Overall, the $6,600 area is still where the major support lies, besides lies the $5,900 zone which is the low from February 6.

Breaking up (lower change) the triangle at around $7,000 could lead a bullish move to next resistance area at $7,350, and afterwards the important resistance level at $7,800 where MA-200 lies.

BTC/USD BitFinex 4 Hours chart

SPECIAL OFFER (Sponsored)
Binance Free $600 (CryptoPotato Exclusive): Use this link to register new account and receive $600 exclusive welcome offer on Binance (full details).

LIMITED OFFER 2024 for CryptoPotato readers at Bybit: Use this link to register and open a $500 BTC-USDT position on Bybit Exchange for free!


Disclaimer: Information found on CryptoPotato is those of writers quoted. It does not represent the opinions of CryptoPotato on whether to buy, sell, or hold any investments. You are advised to conduct your own research before making any investment decisions. Use provided information at your own risk. See Disclaimer for more information.

Share This Article
Yuval Gov

Yuval Gov has over 15 years of trading experience in the stock exchange, graduated from TAU - Economics and Management. Fell in love with the crypto space. Does Crossfit to get away from FOMO. Contact Yuval: LinkedIn