Following yesterday’s analysis, a lot of price action took place in Bitcoin over the past 24 hours.
We’ve talked about the ascending triangle developing on the 4-hour chart. Hours after our analysis, and the triangle was breached to the bullish side. However, after reaching nearly $5500 resistance level, Bitcoin quickly turned down bearish again, dropping $400 down to $5116 on BitMEX.
In the end, and as of now, the breakout had turned out to be a false one: Bitcoin is back inside the triangle’s boundaries. However, as of writing this, the coin is fighting to stay on top of the ascending trend-line support level.
What could be said – This is crypto – unexpected and the whales control the markets after all. It did look very bullish, but now, breaking down the ascending line could easily initiate a deeper correction to the bearish side. Another red mark is coming from the Stochastic RSI oscillator (which is explained below).
Total Market Cap: $176.2 Billion
Bitcoin Market Cap: $91.6 Billion
BTC Dominance: 51.9%
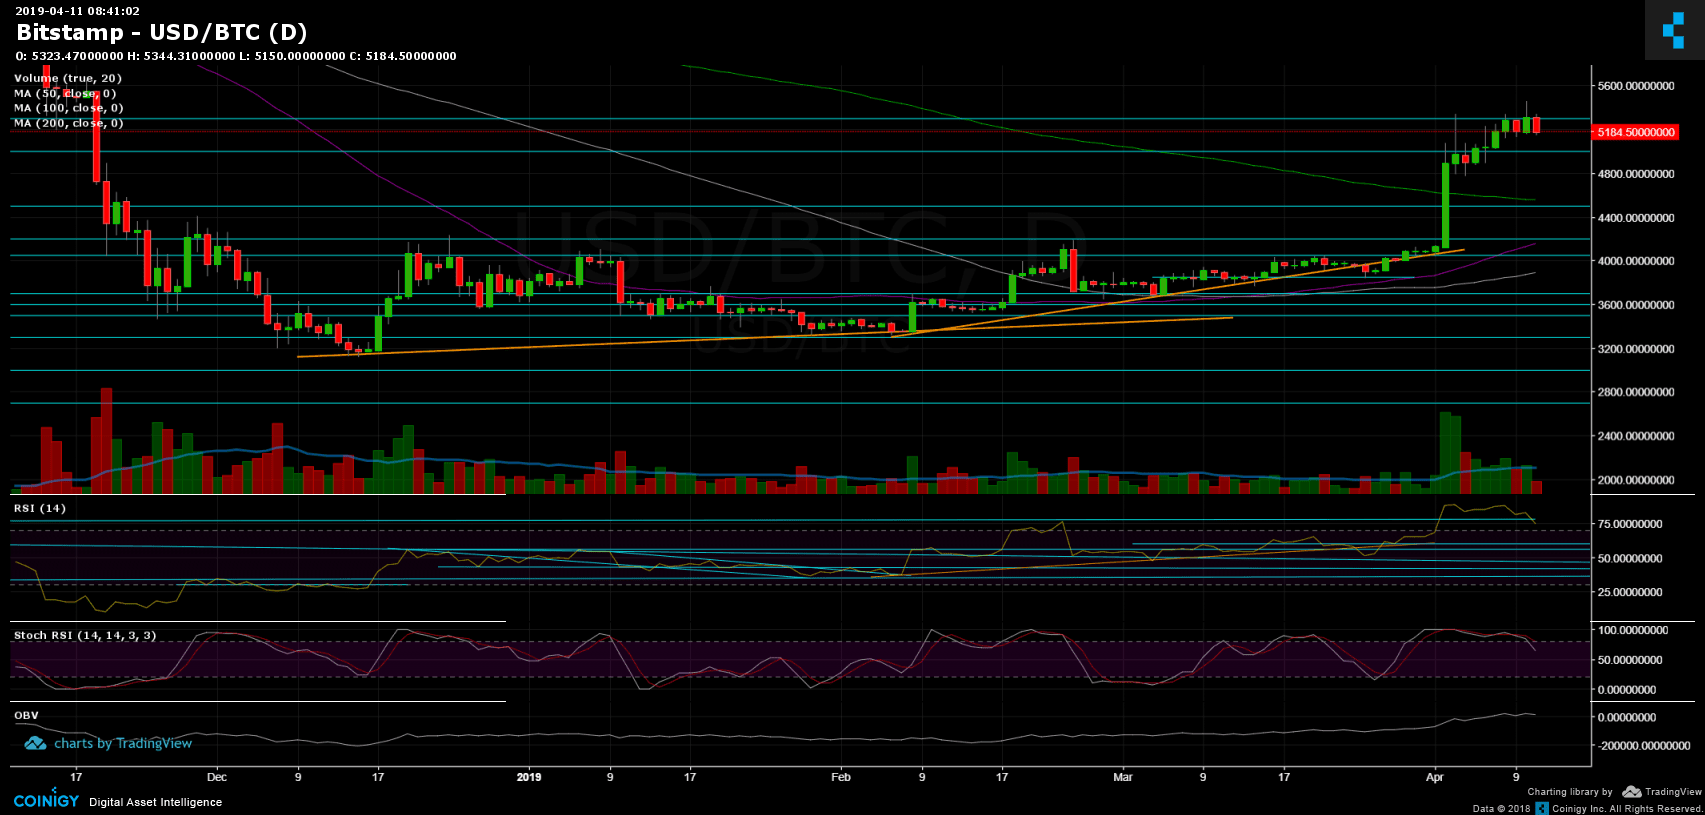
– Support/Resistance:
As mentioned above, breaking down the ascending trend-line might drive Bitcoin to visit old resistance turned support levels: the next significant support levels lie at $5000 and $4800. Below are the $4700 and the 200-days moving average line (1-day chart) which is now around $4550.
From above, $5200 has turned into resistance again, while the next resistance lies at the area of $5300 – $5350. Further above is yesterday’s high at $5500 before reaching the 2018 legendary support turned resistance line at $5700.
– Daily chart’s RSI: The Stochastic RSI oscillator had recently crossed over at the bullish territory and now pointing down. This might lead to a deeper correction.
– The daily trading volume: Looking at the last week’s volume level, we can see that the buyers are the majority of the volume. This is a bullish long-term sign. It will be interesting to see how today volume candle will close.
– BitFinex open short positions: Since yesterday, there was not a significant change in the open short positions, which rose to 18.8K BTC of open positions.
UPDATE 11:20 UTC: Bitcoin had lost the ascending trend-line support and sharply decreased to record it’s current low at $5000 support area.