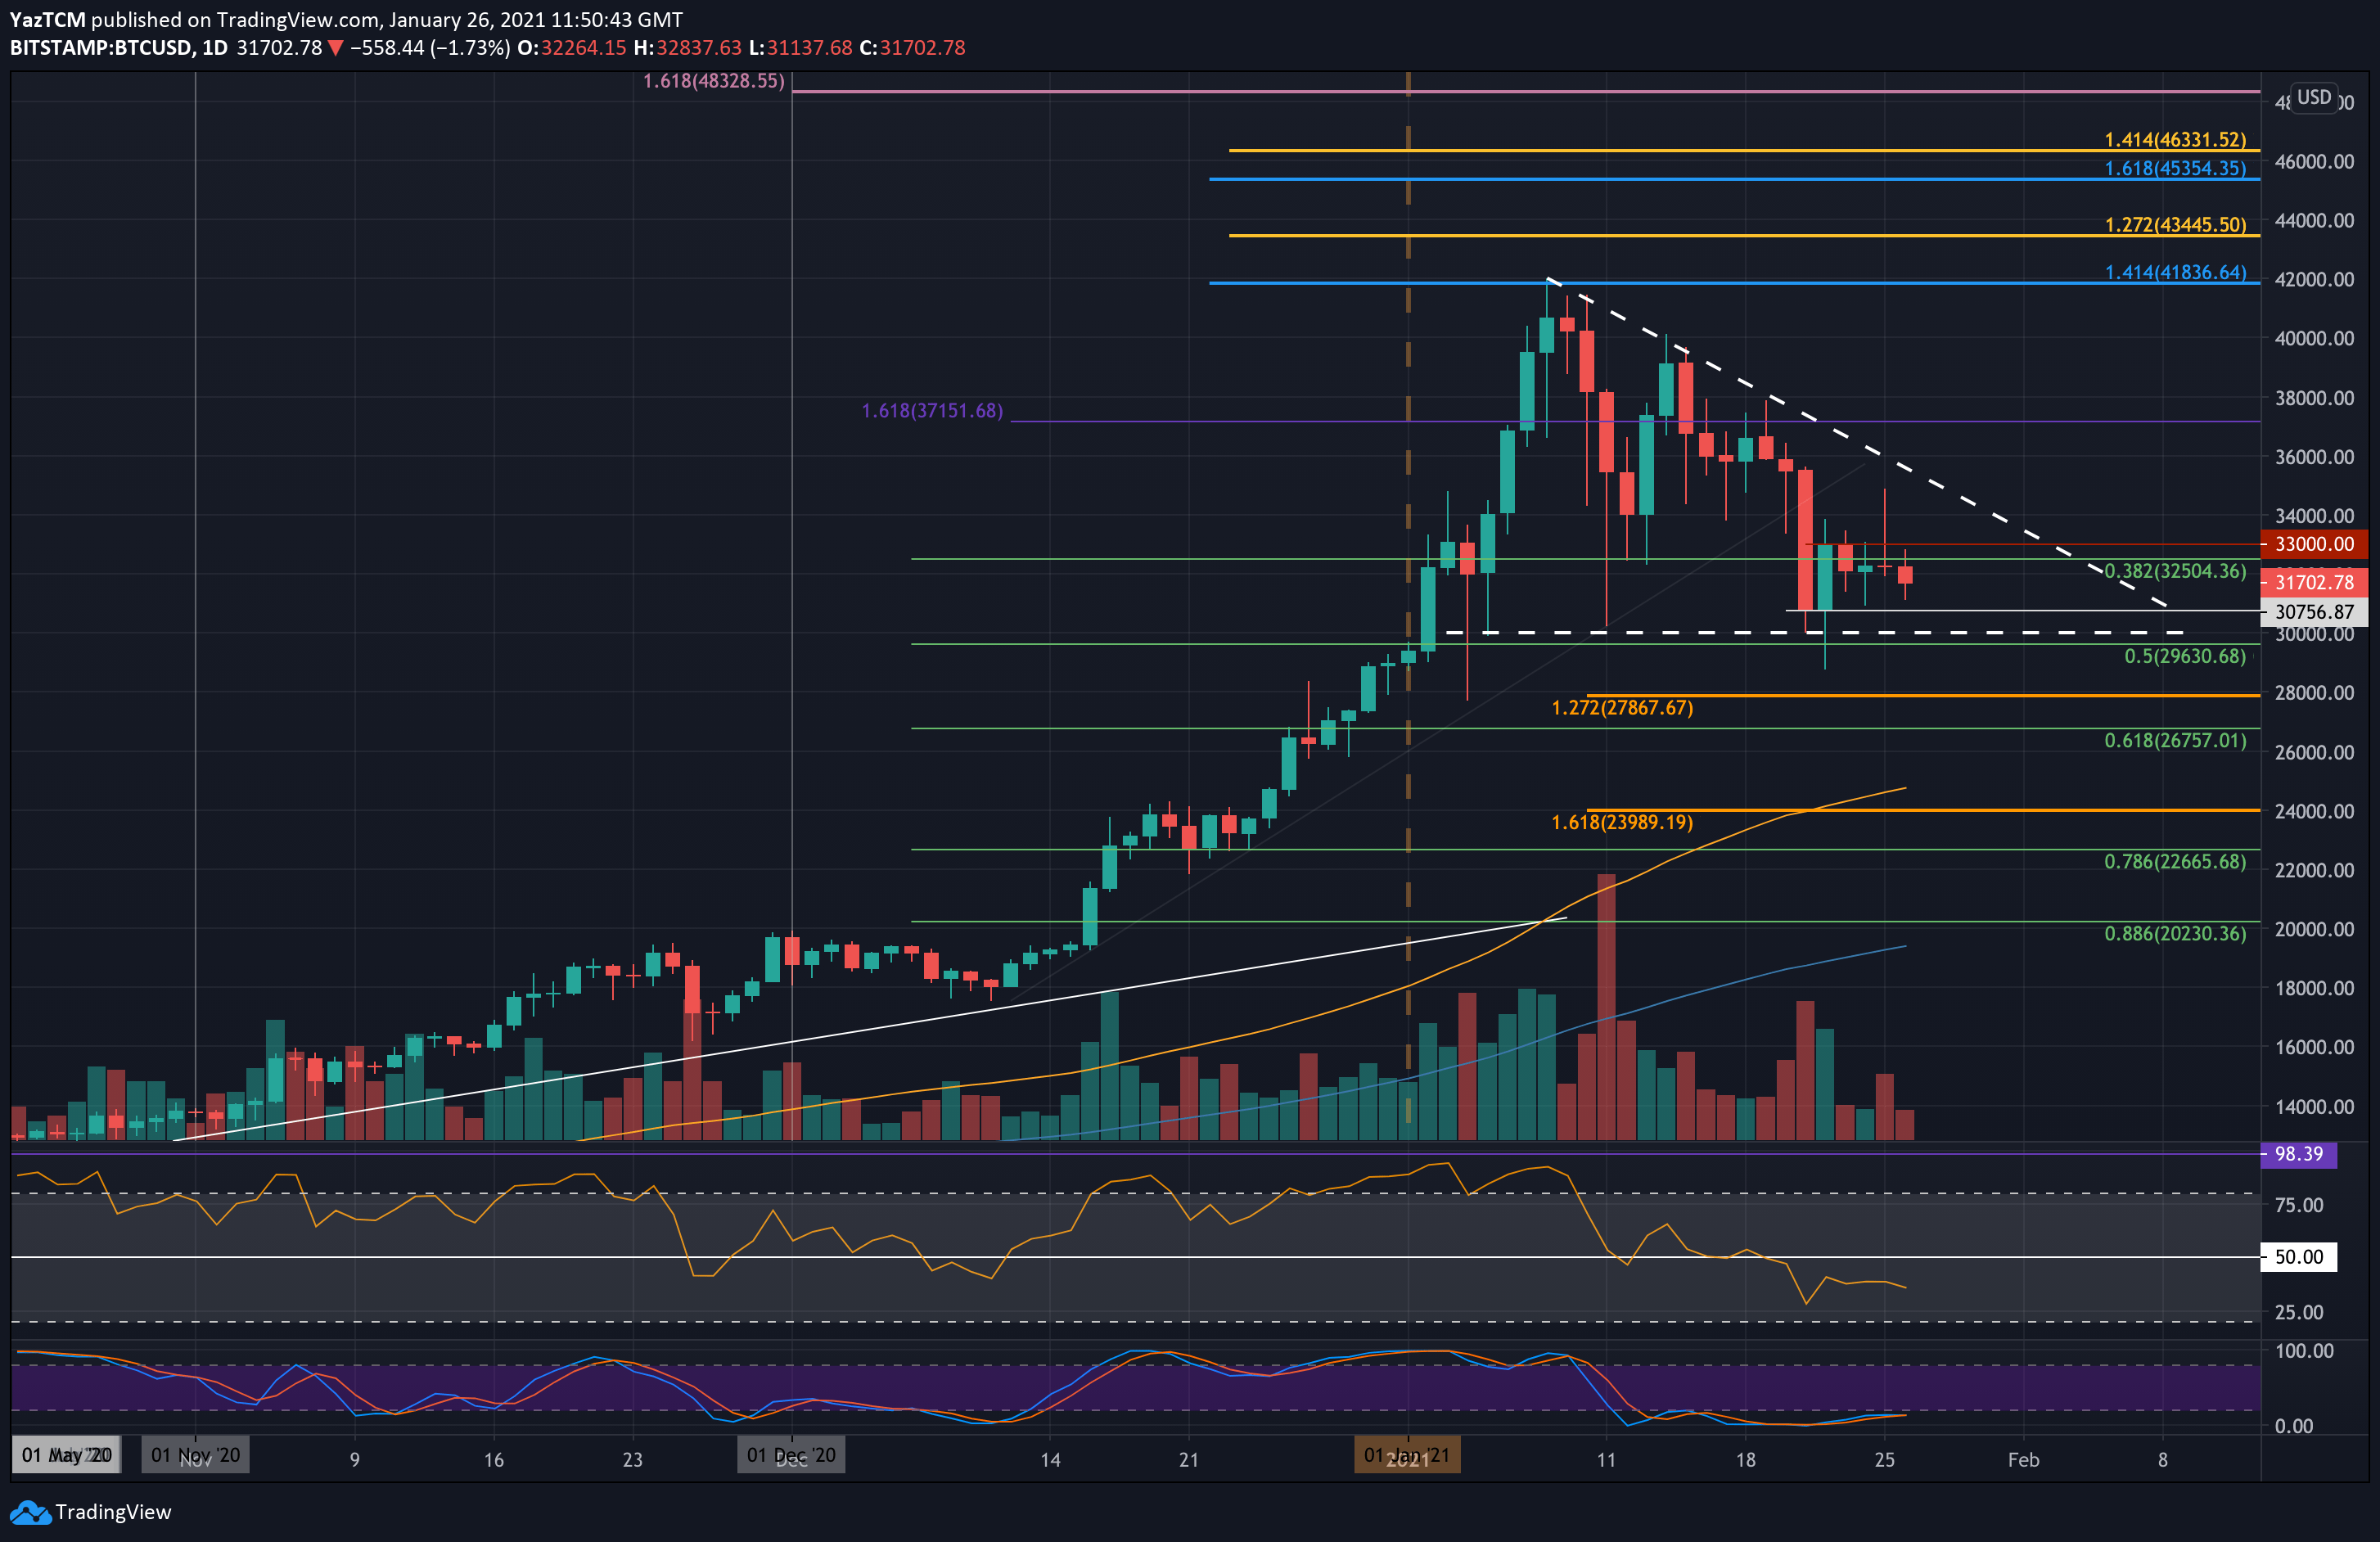
BTC/USD Daily Chart. Source: TradingView
Another Black Monday: Bitcoin dropped by a steep 9% after failing to overcome resistance at $34K – $35. As of writing these lines, the drop recorded a daily low at $31,130 earlier this morning, according to Bitstamp.
This doesn’t happen for the first time – the primary cryptocurrency found support, provided by a short-term rising trend line that dated back to late-December 2020. Since then, BTC had seen a rebound back to the $32K price area, where it is trading as of writing these lines.
So far in January, the coin has bounced three times from this support line over the past five days. Will it continue to hold? We have yet to see.
Looking at the bigger picture, Bitcoin price remains inside the boundaries of a descending bearish triangle pattern and has mainly been rangebound between $33,000 and $30,750 over the last five days of trading. One of these boundaries will need to break, on a daily timeframe, to dictate the next direction for Bitcoin.
Key Support Levels: $31,400, $31,000, $30,760, $30,000, $29,630.
Key Resistance Levels: $32,500, $33,100, $34,000,$34,450, $35,000.
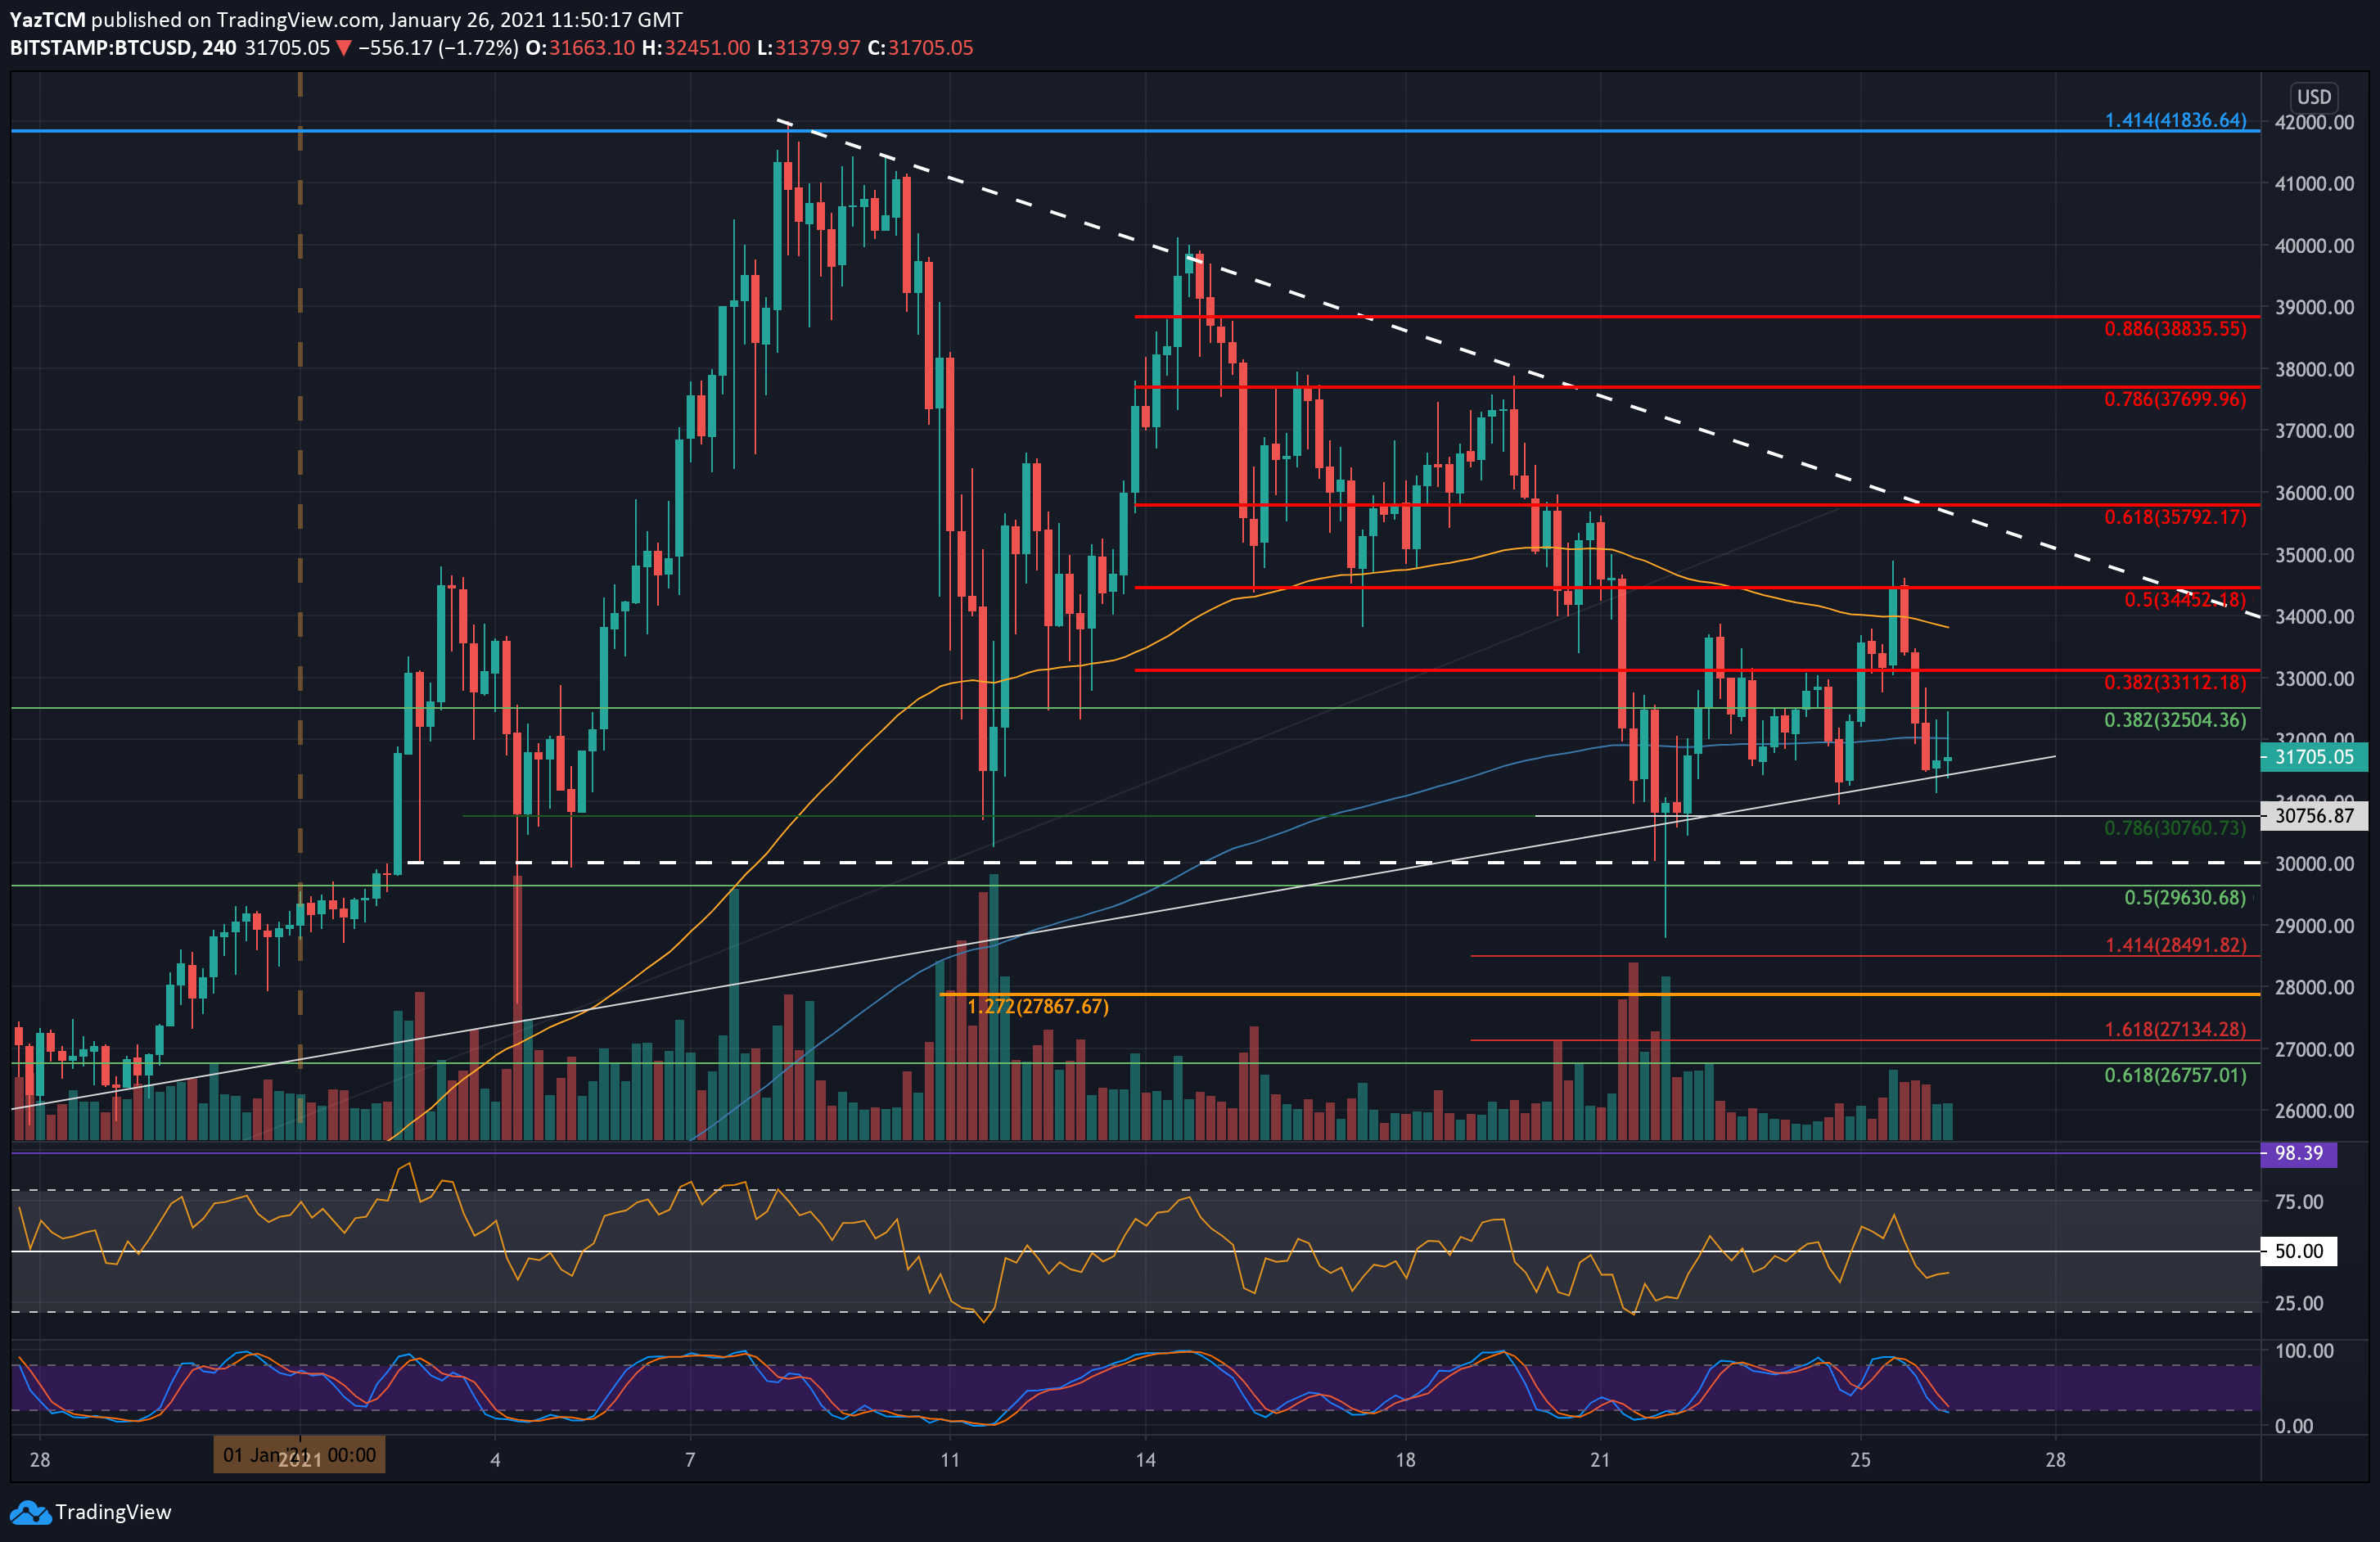
Looking ahead, the first level of resistance now lies at $32,500. This is followed by $33,110 (bearish .382 Fib), $34,000, and $34,450 (bearish .5 Fib). Additional resistance lies at $35,000 (upper angle of triangle and yesterday’s high) and $35,800 (bearish .618 Fib).
On the other side, the first level of support lies at the short term rising trend line at $31,400. This is followed by support at $31,000 – along with today’s low, $30,760 (short term .786 Fib), $30,000 (base of descending triangle), and $29,630. Further below lies $28,800 (last week’s low), followed by further support of $26K.
The daily RSI remains in the bearish territory as the buyers fail to establish any momentum since breaking the previous symmetrical triangle pattern on January 21st.