Bitcoin price had a wild weekend: After losing the $6,000 support, Bitcoin plunged onto the next mentioned support level, and since then, saw a decent come-back to the price area the plunge started from. To conclude this, it was a wild ride going back to the same destination.
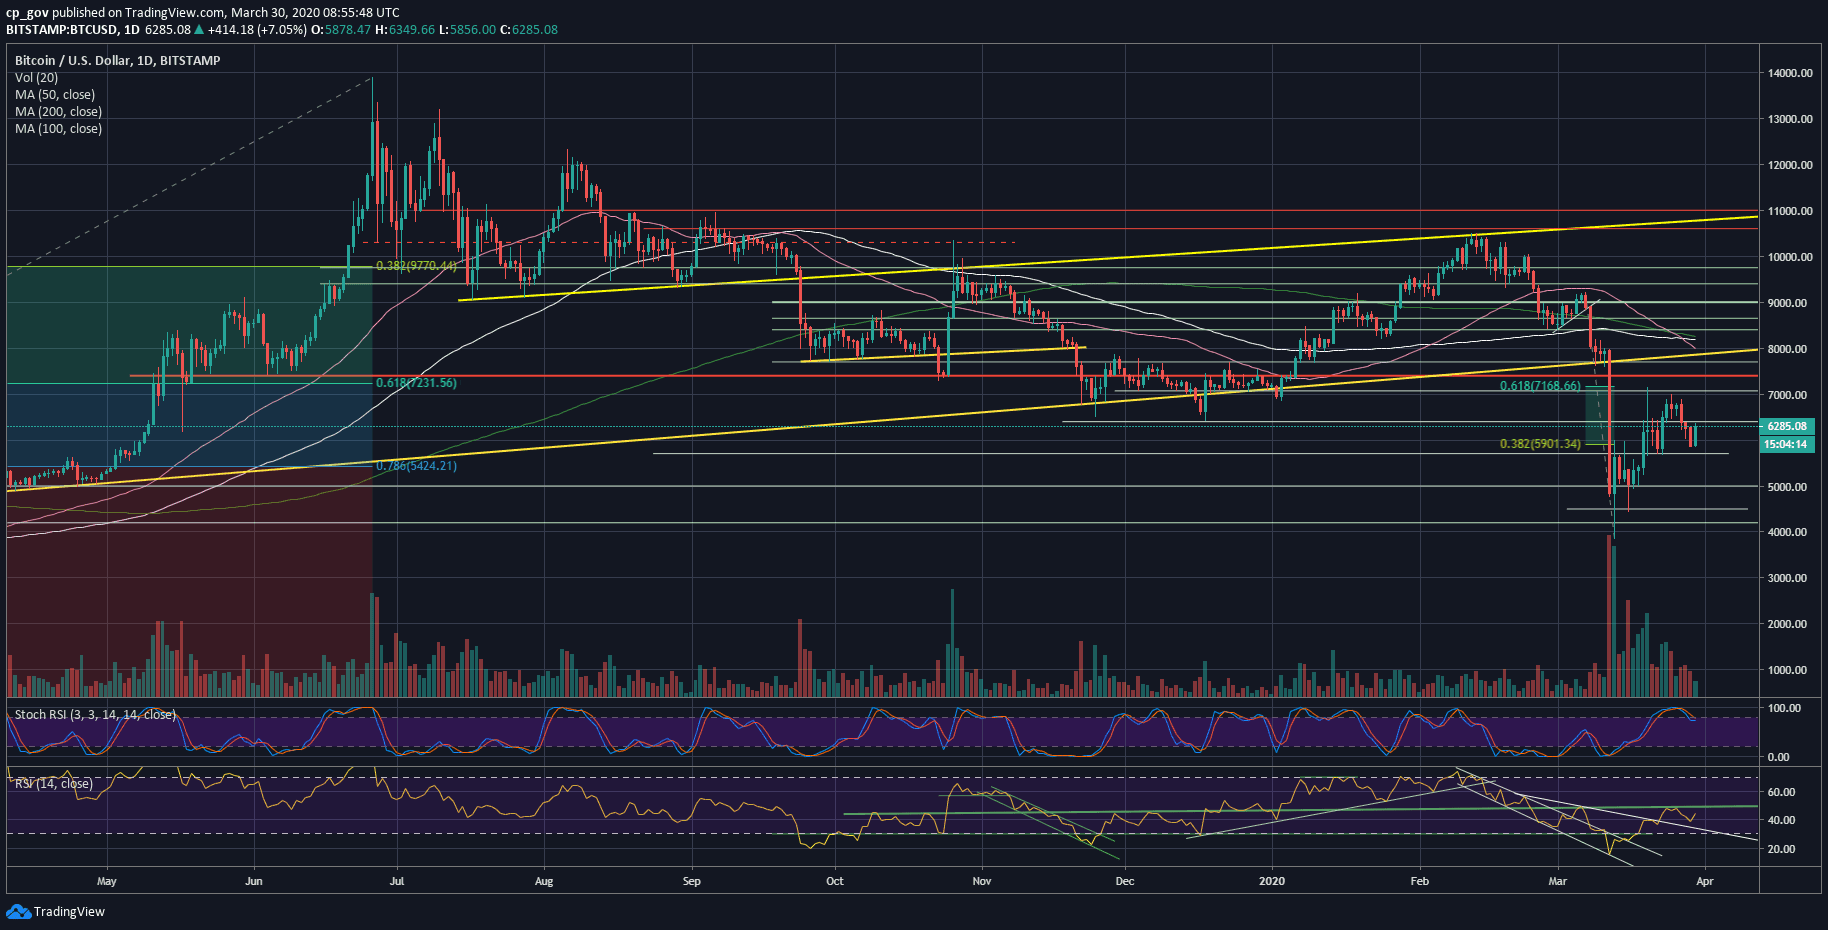
Following our most recent price analysis, we mentioned that ‘new lows’ below $6K are coming up soon. This weekend saw BTC recording $5850 as the current new weekly low, and it’s not a coincidence.
The $5900 area holds strong support since it’s also the 38.2% Fibonacci retracement level from the huge dump of March 12. Looking at the following daily chart, the two primary Fib levels – 38.2% (~$5900) and 61.8% (~$7168) were playing out well as support/resistance levels.
On a macro-level, we will have to see Bitcoin establishing its price above the latter – $7168 – in order to overcome the price plunge from the night of March 12. Until then, the short-term trend is bearish, in my opinion.
Two keys to keep in mind – the volatility is enormous, so caution and broader stop-loss commands are needed. Another thing is the way global markets affect Bitcoin. The markets are volatile as well, and we still see correlation between the two from time to time.
Total Market Cap: $174.8 billion
Bitcoin Market Cap: $114 billion
BTC Dominance Index: 65.5%
*Data by CoinGecko
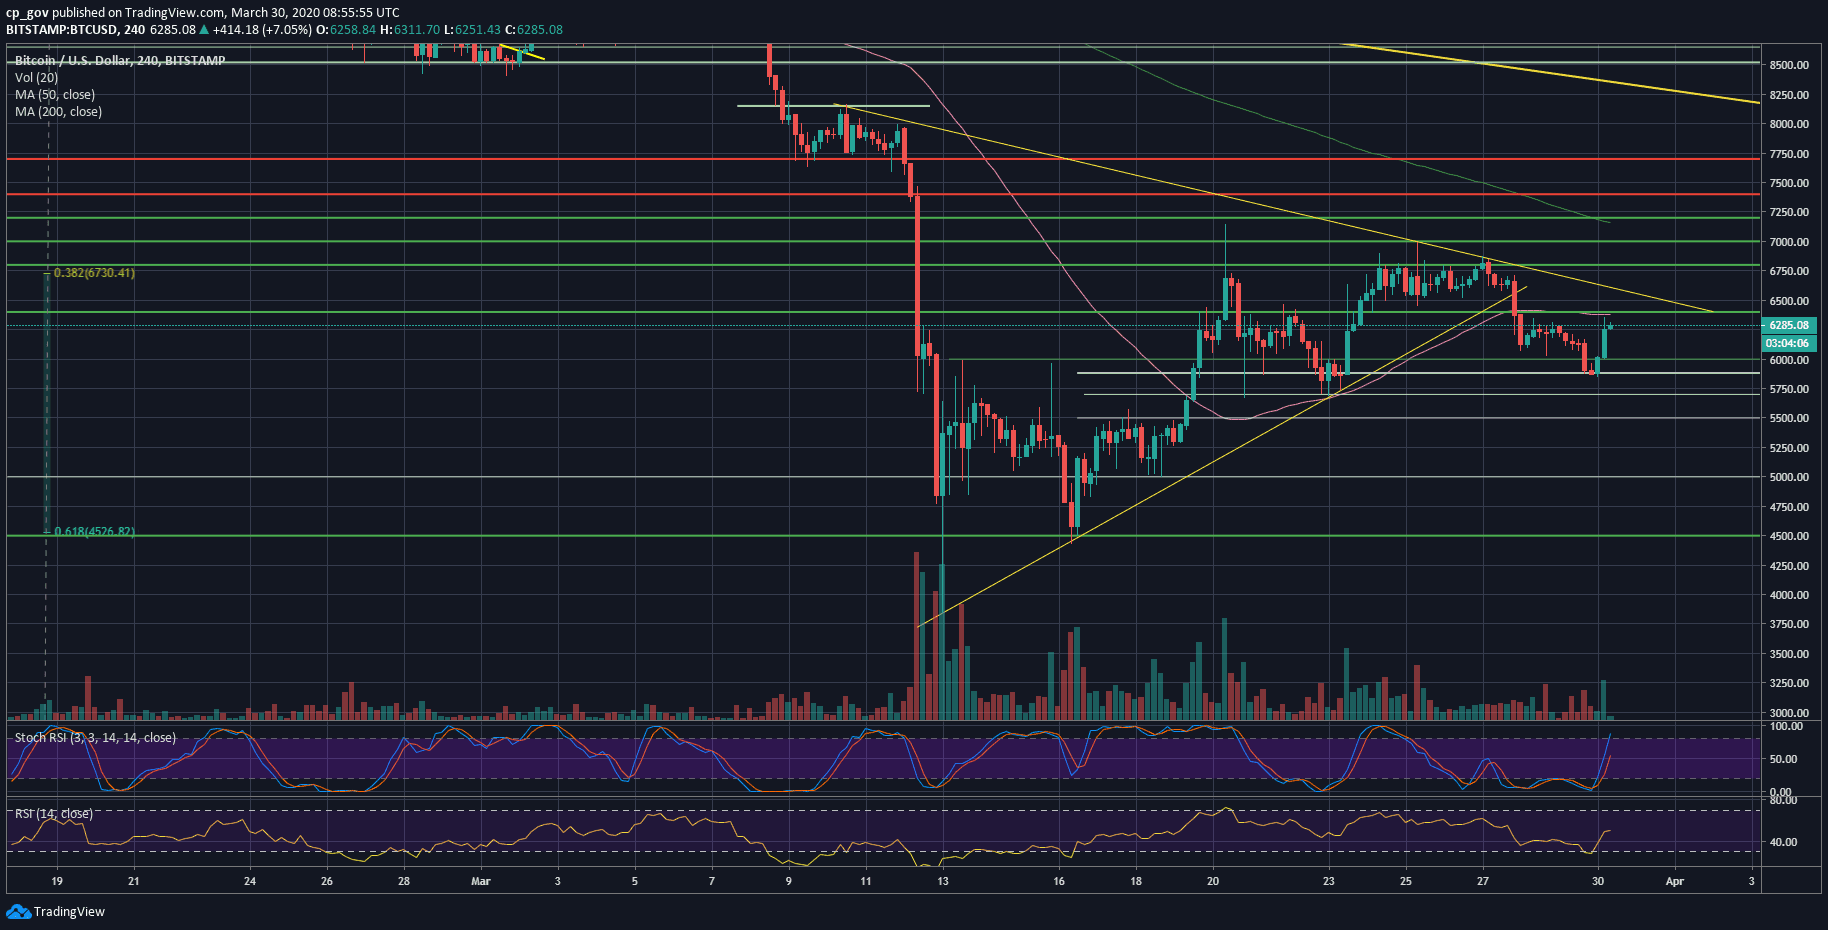
– Support/Resistance levels: After testing the $5900 and finding support there, Bitcoin is back facing the $6300 – $6400 price range (together with the 4-hour MA-50 pink line) as the first level of resistance.
In case of a break-up, then the next resistance level will be the descending trend-line on the following 4-hour chart, currently around $6550. Further above lies $6800 – $6900.
From below, the first level of support now lies at the $6000, followed by yesterday’s low at $5850. Further down lies $5700, $5500 and the $5200 – $5300 support area.
– The RSI Indicator: The RSI found support as well, around the 38 RSI level. However, to think bullish, the RSI will have to go through a higher low above the critical 50 mark.
– Trading volume: The real volume is (still) not here, following 17 days of declining volume, since the rough night of March 12. This can also be explained because of the weekend. I expect some decent volume this week to follow the price action.